适用于MetaTrader 5的新技术指标
RSI Pro 分析器指标是一款功能强大的工具,专为希望在多个时间范围内同时做出明智决策的交易者而设计。 该指标利用 RSI 提供超买、超卖和趋势信号,更容易识别入市机会。 它的主要优点是易于阅读, 因为它具有清晰而独特的颜色代码来指示不同的市场状况。
该指标显示五个不同时间范围(D、H4、H1、M30、M15) 的 RSI 值和相关信号,使交易者能够获得全面的市场视角并在多个时间范围内做出明智的决策。
使用颜色变化来识别不同时间范围内的趋势和潜在逆转。 寻找超买和超卖区域,以发现反趋势或趋势逆转的交易机会。
红色: RSI 指示下降趋势。
绿色 :RSI 指示上升趋势。
深红色 :RSI 表示超卖区域。
深绿色 :RSI 发出超买区域信号。
您还可以通过弹出、电子邮件和推送通知发送的精确警报来通知购买和销售条目。
RSI Pro 分析器指标是交易者决策过程中的补充工具。 建议将其与其他指标和分析结合使用,以了解市场概况。
MT4版本。
输入参数:
RSI period: 14(默认),可根据您的喜好调整。
Enab

MOST is applied on this RSI moving average with an extra default option added VAR/VIDYA (Variable Index Dynamic Moving Average)
MOST added on RSI has a Moving Average of RSI and a trailing percent stop level of the Moving Average that can be adjusted by changing the length of the MA and %percent of the stop level.
BUY SIGNAL when the Moving Average Line crosses above the MOST Line
LONG CONDITION when the Moving Average is above the MOST
SELL SIGNAL when Moving Average Line crosses belo
DYJ SignalSourceOfRSI 是一种动量振荡器, 它通过将指定数量的周期内收盘价的升降运动进行对比,指示价格强弱 。
DYJ SignalSourceOfRSI 提供两种信号:
DYJ SignalSourceOfRSI 达到超买或超卖水平,然后出现一点反转: DYJ SignalSourceOfRSI 低于水平 (30) 时生成买入信号,RSI 高于水平 (70) 时生成卖出信号; DYJ SignalSourceOfRSI 跌破水平 (30) 然后升至水平 (30) 上方可被解释为买入信号。 DYJ SignalSourceOfRSI 上升到水平 (70) 以上然后跌破水平 (70) 可以被解释为卖出信号。 此外, DYJ SignalSourceOfRSI 振荡器还用彩色箭头标记了入场点和出场点,并且还根据这些持仓实时统计总盈利和最大浮动亏损,这是判断交易概率的重要数据。 并且这些BUY与SELL信号被发送出去,您使用 DYJ GameDevice 跟单软件能接收这些信号,并实现自动开仓和关仓,并能使用博弈策略功能,使得亏损订单变为获利。
I

Certainly! Here's the revised Chinese translation including the information about the indicator not repainting its signals and being resistant to market noise:
介绍 Volatility Doctor RSI,这是一款基于可信赖的RSI指标构建的突破性工具,旨在提升您的交易体验。
我们的指标不仅提供实时的RSI读数,还准确预测了未来10步内RSI读数的位置,适用于您选择的任何时间框架和任何偏好的交易符号。此外,我们强调指标不会重新绘制其信号,确保您获得可靠的交易指导,同时对市场噪音具有很强的抵抗力。
自适应智能:这个智能工具学习并动态调整,无缝融入您独特的交易策略,增强您的决策过程。
立即使用 Volatility Doctor RSI 提升您的交易。
祝您和平、繁荣和交易盈利。
Volatility Doctor.

Certainly! Let’s discuss the RSI Rush , an aggressive momentum indicator that combines weighted moving averages (WMAs) at lows, mid-price, and tight highs. Here are the key components: Weighted Moving Averages (WMAs) : The RSI Rush employs three WMAs: WMA at Lows : Calculated based on the lowest prices during a specific period. WMA at Mid-Price : Considers the average price (midway between highs and lows) during the same period. WMA at Tight Highs : Based on the highest prices during the speci

The RSI Advanced tool will help traders capture trends and optimal entry points by:
- Enter a Buy order when the green line crosses the yellow line. Provided that the yellow line is near line 32 or 20 - Enter a Sell order when the green line crosses the yellow line. Provided that the yellow line is near line 68 or 80
Additionally, you can combine it with the convergence divergence that occurs at the green line.
**When you purchase the Mastering the RSI MT4 or Mastering the RSI MT5 indicat

This wonderful tool works on any pair producing alerts whenever the market enters the overbought and oversold zones of the market. The signals come as BUY or SELL but it does not necessarily mean you should go on and execute order, but that you should begin to study the chart for potential reversal. For advanced signal tools check out some of our premium tools like Dual Impulse.
FREE

我们把RSI指标的一个用法写成了指标,并用红绿柱线表示,非常的简单有效。 您只需要按照填入RSI的参数,即可获得红绿柱线的RSI指标。 将RSI指标的一个用法扩展成一个功能强大的新指标,并通过红绿柱线形式直观呈现,无疑是金融技术分析领域的创新之举。红绿柱线的设计独具匠心,使得投资者能够一目了然地掌握市场动态。当柱线呈现绿色时,表明市场处于相对稳定的阶段;而当柱线转为红色时,则意味着市场可能出现波动。这种直观的视觉效果,不仅简化了分析过程,还大大提高了决策效率。
该指标的实用性也得到了充分验证。通过回溯测试和实时数据分析,我们发现它能够准确地预测市场的转折点,为投资者提供了宝贵的交易信号。此外,该指标的参数可根据不同市场和资产类型进行调整,以适应各种投资环境。
它不仅继承了传统RSI指标的优点,还通过创新的设计和功能优化,实现了更加精准、高效的市场分析。

RSI Barometer Pro 通过使用红条和绿条表示RSI值,这一创新指标为交易员和投资者提供了对市场情绪和潜在趋势逆转的直观见解。
RSI Barometer Pro中的红色和绿色条纹设计非常注重细节,在视觉上展现了市场动态。当条形图显示为绿色时,表明RSI低于50,表明市场处于相对稳定的阶段。相反,当条形图变红时,表示RSI高于50,表明潜在的市场波动性。这种直观的视觉效果简化了分析过程,使用户能够快速掌握市场情况并做出明智的决策。
RSI Barometer Pro经过严格的测试和实时数据分析,证明了其在预测市场转折点方面的非凡准确性。这种准确性为交易员和投资者提供了有价值的交易信号,增强了他们有效驾驭市场的能力。
此外,RSI Barometer Pro提供可定制的参数,以适应各种市场条件和资产类型。这种灵活性允许用户根据其特定的交易策略和偏好对指标进行微调,确保不同投资环境下的最佳表现。
通过利用传统RSI指标的优势,并结合创新的设计和功能优化,RSI Barometer Pro为精确高效的市场分析树立了新标准。它使交易员和投资者能够全面了解市场趋势,

产品描述:
RSI动量指标是一种先进的指标,它将传统的超买和超卖信号概念从RSI(相对强度指数)转换为使用红色和绿色条的直观表示。这一创新指标旨在为交易员和投资者提供可操作的见解,提供对市场状况和潜在趋势逆转的清晰评估。
RSI动量指标的独特之处在于其颜色编码的红色和绿色条,它们有效地描述了市场中的超买和超卖情况。当条形图显示为红色时,表示出现超卖情况,表明市场可能已经成熟,可以进行潜在的向上调整。另一方面,当条形图变绿时,标志着超买状态,这意味着市场可能会出现潜在的向下修正。这种可视化表示简化了分析,使用户能够快速识别战略进入或退出的机会。
RSI动量计的实用性和可靠性已通过严格的测试和实时数据分析得到广泛验证。它准确地识别超买和超卖情况,为交易员和投资者提供有价值的交易信号,以便做出明智的决策。
RSI动量表提供可定制的参数,允许用户调整指标以适应不同的市场条件和资产类型。这种灵活性确保了在各种投资环境中的适应性,并使用户能够根据其特定的交易策略和偏好对指标进行微调。
通过利用RSI指标的优势,并结合创新的红绿条设计,RSI动量指标彻底改变了超买和超卖信号的解

What is this indicator? This indicator is the RSI (Relative Strength Index) supporting Virtual Trading mode of Knots Compositor . When the mode is turned on, the indicator will be recalculated based on the displayed candlesticks. When the mode is turned off, the indicator will be recalculated based on the original chart candlesticks.
Types of the applied price - Close - Open - High - Low - Median Price (HL/2) - Typical Price (HLC/3) - Weighted Price (HLCC/4)
KC-Indicators - KC-MA (M
FREE

FusionAlert StochRSI Master is an indicator available for MT4/MT5 platforms, it is a combination of RSI & Stochastic indicator which provide "alerts" when the market is inside "overbought and oversold" regions combined for both indicators, results in more precise and accurate signals to be used as a wonderful tool, in the form of "buy or sell" signals. This indicator comes with many customization options mentioned in the parameter section below, user can customise these parameters as needful. Jo
FREE

QuantumAlert RSI Navigator is a free indicator available for MT4/MT5 platforms, its work is to provide "alerts" when the market is inside "overbought and oversold" regions in the form of "buy or sell" signals. This indicator comes with many customization options mentioned in the parameter section below, user can customise these parameters as needful. Join our MQL5 group , where we share important news and updates. You are also welcome to join our private channel as well, contact me for the priva
FREE

MT5 RSI Experiment: This indicator leverages the Relative Strength Index (RSI) and floating levels to pinpoint potential buy and sell signals.
The code uses enums for prices and RSI calculation methods. These enums define indicator parameters.
Input variables include RSI period, price type for RSI calculation, smoothing method, and look-back period with levels for floating levels.
Index buffers store RSI fill, RSI up line, RSI middle line, RSI down line, and trend line data.
For each ba

MACD RSI THUNDER The idea behind this indicator was initially to be used on RSI_THUNDER EA that we have deveoped towards giving a more granular control of the trend direction and momentum in which, in order to correlate corretly with RSI indicator, it's required.
I have converted the indicator into a signal that can be passed and integrated to the RSI_THUNDER EA or you can use it your own way. It's here for you to use and abuse and we hope you enjoy the experience that it provides.
Support:
FREE

Что такое RSI? Индикатор RSI (Relative Strength Index, индекс относительной силы) — это индикатор, который измеряет соотношение восходящих и нисходящих движений. Расчет ведётся таким образом, что индекс выражается в диапазоне от 0 до 100. Как понять RSI?
Если значение RSI находится равно 70 и больше, считается, что инструмент находится в состоянии перекупленности (ситуация, когда цены выросли выше, нежели того ожидал рынок). Значение RSI на уровне 30 и ниже считается сигналом о том, что инст
FREE
Simple alert system which will alert you on your mobile terminal, email and on the chart whenever RSI crosses below the overbought level or above the oversold level. Use this alert system, so you don’t have to watch the chart all day for the RSI levels to break.
INPUTS: 1. RSI Period- (Default is 14). Number of candles the RSI indicator will look back for the calculations. 2. OB Level- (Default is 70). This is the Overbought level or Upper level for the RSI indicator. 3.

This indicator is based on the RSI indicator
Also, some candlestick patterns are used in it to identify better signals
Can be used in all symbols
Can be used in all time frames
Easy to use method
Adequate settings
Settings: period: The number of candles used to calculate signals. alarmShow: If you want to receive an alert in Metatrader after receiving the signal, enable this setting alarmShowNoti: If you want to receive an alert on your mobile after receiving a signal, enable this sett

A combined indicator of two famous indicators: RSI , Bollinger Bands Can be used in all currency pairs Can be used in all time frames with many signals Very simple and fast to use
Description:
This indicator is made from the combination of RSI and Bollinger Bands indicators
As you can see, it shows good signals and is worth using and testing
We hope you are satisfied with this indicator
Settings: show past show candle: Displays the number of candles that the indicator calculates.
For
FREE

Ever wanted to use StochRSI on MetaTrader5 Terminal which you see and use on TradingView? Now you can use same StochRSI indicator in your MetaTrader5 and enjoy more time in Trading.. You can change StochRSI settings if you want to change and it will be ready to use for you... Now you will not go anywhere to use only indicator there... Open charts , load Indicator this Indicator and you are ready to do analysis in MetaTrader5 and Put Trades when you feel okay with your analysis.
FREE

Special Offer ... It is totally free for all. New one coming soon...................
About This Indicator: RSI vs SMA Indicator: A Comprehensive Technical Analysis Tool for Better for Identify the Short and Long Signals.
The RSI vs SMA Indicator is a powerful technical analysis tool designed to understanding Market Price Fluctuation for Long or Short signals. This user-friendly Indicator good for both novice and experienced traders, providing valuable indication in price chart and separate wi
FREE

About This Indicator: RSI vs SMA Oscillator: A Comprehensive Technical Analysis Tool for Better View of Market Price
The RSI vs SMA Oscillator is a powerful technical analysis tool designed to understanding Market Price Fluctuation for buy or sell signals. This user-friendly Oscillator good for both novice and experienced traders, providing valuable insights into market trends and price movements. Key Features: - RSI Cross Alert: The indicator is based on the Relative Strength Index (RSI), a po
FREE

The RSI Divergence Indicator is a powerful tool designed to identify potential reversals in the market by spotting discrepancies between the Relative Strength Index (RSI) and price movement. Divergences can be a significant indication of an impending trend change, either from bullish to bearish or vice versa. This indicator is built for making the task of identifying potential trade opportunities more straightforward and efficient.
Features: Automatic Detection: The indicator scans the cha

This indicator can automatically scan the RSI values of all varieties on the mt5 and set an alarm.
Note that it is fully automatic scanning, you do not need to enter which varieties, do not need to open the variety chart, as long as there are some varieties in the market quotation column, will be automatically scanned to reach the set rsi alarm value, will pop up the alarm, and cycle with the market changes to scan the latest RSI values of all varieties, and alarm.
This is very helpful t

Introduction
The RSI Plus is an innovative technical analysis tool designed to measure the strength and direction of the market trend. Unlike the traditional RSI indicator, the RSI Plus boasts a distinctive ability to adapt and respond to market volatility, while still minimizing the effects of minor, short-term market fluctuations.
Signal
Buy when the RSI plus has been in the oversold (red) zone some time and it crosses above the 20 level on previous candle close
Sell when the RSI
FREE
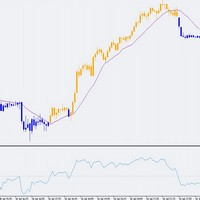
This indicator can be very important in any trading system. The Indicator colors candles above or below the 50 level of the RSI, which is a widely used indicator in technical analysis. With this indicator it is much easier to identify trends, helping with the entry and exit points of negotiations. It is a fact that in the financial market, simple things work. Este indicador pode ser muito importante em qualquer sistema de negociação. O Indicador colore as velas acima ou abaixo do nível 50 do

The RSI (Relative Strength Index) scanner is a powerful technical analysis tool designed to help traders and investors identify potential trading opportunities in the forex, stocks, and cryptocurrency markets. RSI is a popular momentum oscillator that measures the speed and change of price movements and helps determine overbought or oversold conditions in an asset. The scanner takes advantage of this indicator to streamline the process of finding trading signals and opportunities. The RSI value
FREE

正在寻找一个强大的指标来让您的交易更上一层楼? 看看我们独特的基于 RSI 的指标,它结合了 MQL5中最好的相对强度指数 (RSI)、移动平均线和 Heiken-Ashi 指标。
我们的指标提供无任何滞后的实时数据,让您自信地做出明智的交易决策。 它非常适合所有级别的交易者,从初学者到专家。
通过可自定义的设置和参数,您可以轻松地根据您的交易风格和偏好调整指标。 无论您是日内交易者还是长线投资者,我们基于 RSI 的指标都可以帮助您识别趋势反转并最大化您的利润。
我们技术娴熟的开发人员团队孜孜不倦地创建了一个提供无与伦比的准确性和性能的指标。 通过结合 RSI、移动平均线和 Heiken-Ashi 指标,我们为希望保持领先地位的交易者创建了一个真正的强大工具。
它是 RSI、移动平均线和 Heiken-Ashi 指标的强大组合,没有它您就不想交易。
100% 不重涂 100% 无延迟

Schaff trend RSI indicator (It is related with EMA and RSI) It is suited for sub-Indicator to undertand trend(or direction change)
As you can see the screenshot, it's good with Nagaraya-Watson Envelope Indicator (or others) I am using this indicator as Screenshot setting. (Schaff value is default value. 23, 50, 9, close) If you want to get Nagaraya-Watson Envelope, Link: https://www.mql5.com/ko/market/product/97965

介绍 RSIScalperPro - 这款基于 RSI 指标的革命性交易指标适用于 MetaTrader 5,专为一分钟图表的剖刺交易而设计。借助 RSIScalperPro,您将拥有一个强大的工具箱,用于精确的入场和出场信号,提升您的交易水平。 RSIScalperPro 使用两种不同的 RSI 指标,为超买和超卖区域提供清晰的信号。您可以根据自己的偏好自定义两个 RSI 的时间周期和限制值,以实现您的交易策略的最佳效果。图表上的明显箭头使您可以轻松识别何时进入或退出交易。 RSIScalperPro 的另一个亮点是三个可自定义的移动平均线,帮助您识别趋势方向并确认强大的交易信号。这使您可以早早发现趋势并参与到盈利交易中。 此外,您可以设置 RSIScalperPro 发出每个新交易信号的听觉警报。这样,即使您不经常坐在计算机屏幕前,也不会错过任何重要的交易机会。 RSIScalperPro 提供用户友好的界面,并且在 MetaTrader 5 中很容易插入和配置。您可以根据个人交易偏好自定义指标,并利用其多样化的功能,提高交易成果。 利用 RSIScalperPro 的优势,提高
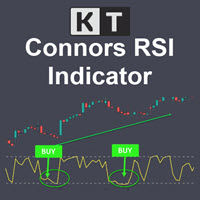
KT Connors RSI is a modified and more advanced version of the original Connors RSI developed by Larry Connors. It was designed to help traders generate trade signals based on short-term price movements.
The Connors combine the standard RSI calculation with two additional elements: a short-term RSI, ROC, and a moving average.
Features Provides more transparent and more actionable buy and sell signals using the overbought/oversold zones. Incorporates short-term RSI and moving average, provid

The idea behind this indicator is to find all currency pairs that are over-bought or over-sold according to the RSI indicator at one go.
The RSI uses the default period of 14 (this can be changed in the settings) and scans all symbols to find the RSI level you will have specified. Once currency pairs that meet the specification are found, the indicator will open those charts for you incase those charts aren't open and proceed to write the full list of currencies on the experts tab.
FREE

欢迎使用 RSI Colored Candles,这是一个创新的指标,旨在通过将相对强弱指数(RSI)直接集成到您的价格图表中,来提升您的交易体验。与传统的 RSI 指标不同,RSI Colored Candles 使用四种颜色方案来表示 RSI 水平,直接显示在您的蜡烛图上,为您提供一目了然的有价值见解。 特点和优势: 节省空间设计: 告别杂乱的指标窗口!RSI Colored Candles 通过消除独立的 RSI 窗口的需求,节省宝贵的图表空间,为您提供更清晰和更简洁的交易体验。 超买和超卖区域的可视化表示: 在您的价格图表上轻松识别超买(由红色蜡烛表示)和超卖(由蓝色蜡烛表示)状态。这种视觉表示赋予您做出更好的交易决策并利用潜在的反转机会的能力。 增强的入场信号: 将颜色编码的蜡烛用作交易信号,蓝色蜡烛表示买入机会,红色蜡烛表示卖出机会。这种简单直接的方法简化了您的交易过程,并根据 RSI 条件提供清晰的入场点。 与供需区域的集成: 将 RSI Colored Candles 与供需分析相结合,进一步增强您的交易策略。通过在关键的供需区域识别 RSI 极端值,您可以最大程度地提
FREE

The Double Stochastic RSI Indicator is a momentum indicator which is based on the Stochastic Oscillator and the Relative Strength Index (RSI). It is used help traders identify overbought and oversold markets as well as its potential reversal signals. This indicator is an oscillator type of technical indicator which plots a line that oscillates within the range of zero to 100. It also has markers at levels 20 and 80 represented by a dashed line. The area below 20 represents the oversold area, wh

macd rsi It is a macd indicator added to the rsi to capture perfect entries in the average crossovers! As seen in the indicator, it has 2 lines, one of gold color and the other violet line, where the cross of the violet with the gold downwards is a sell signal when it crosses the violet up from the gold it is a buy signal! very good to make shorts works for forex markets and synthetic indices It is used in any temporality! Good profit! World Investor.

Rsi Project is an Rsi programmed to scalp on m1 , m5 and m15 , ideal for hunting revotes and with the naked eye the rsi marks the pecks on the ceilings and floors to grab those sails! It also serves to make long periods of time! It works for forex markets works for synthetic index markets fits all pairs ideal for volatility and jumps! Good profit! World Inversor !!!!

The RSI2.0 indicator uses normalized price data and signal processing steps to get a normal distributed oscillator with no skew (mean is zero). Therefore, it can give much better reads than the traditional RSI. Areas/Levels of reversal: Overbought or oversold levels from traditional RSI have no statistical significance, therefore the standard deviation bands are implemented here, which can be used in similar way as possible reversal points. Divergence: As the indicator is nearly normal dist

Scalp Rsi. programmed %100 for scalping perfect for grabbing rebounds on m15, m5 and m1 ideal for catching mini trends echo for forex and synthetic indices ! works on all forex and synthetic pairs It works in all time frames, but it's made for scalping and collecting a quick profit. Accompanied by the ZigZag Gold indicator, it can be found on the market as well, World Investor.

RSI Professional is based on an oscillator to hunt ranges and trends where you can also see it catches rebounds in the measurements according to the pair, it can be used for forex and synthetic indices, it works in any temporality, in the pairs that I use it are, eur/usd, usd/jpy, usd/chf and gbp/usd, in synthetics in the crash and boom pairs all, volatility 75, jumps, and range break!
Adrian MOROSAN (2011) examined the same set of data using both traditional and modified RSI. He also incorporated trading volume in the method's calculating formula. Finally, findings acquired using the indicator's traditional form will be compared to those obtained using the modified version. He found that, in comparison to the original form, his version resulted in a greater advantage when a different, even opposing interpretation was used. And, in the alternative case, it resulted in much lar

To download MT4 version please click here . This is the exact conversion from TradingView: "RSI versus SMA" By "JayRogers". This indicator lets you read the buffers for all Lines on chart. Note: This is an indicator, Not an expert. Meaning It does not take trades. If you want the EA please contact via message. You can easily use the indicator to understand the logic behind trades that the TradingView strategy takes. The strategy is profitable if this indicator is applied to the right symbol at
FREE
RSI Traffic Lights Dashboard Trend is you friend, one of the classical Trend following is the Relativ Streng Index (RSI). With RSI Traffic Light Dashboard you get an Overview how the current trend is moving for several Pairs. How many pairs you monitor, can be configured in Indicator settings. The order of symbols is equivalent to your Market Watchlist. The RSI Traffic Light Indicator alerts you if the trend is changing for your pair. Alert can be switched on/off
Important: Get informed about

A useful scanner/dashboard that shows the RSI values for multiple symbols and Time-frames. It can be easily hidden/displayed with a simple click on the scanner man top left of the dashboard. You can input upper and lower RSI values and the colours can be set to show when above/below these values. The default values are 70 and 30. There are also input colours for when the RSI is above or below 50 (but not exceeding the upper/lower levels
Symbols and time-frames are input separated by commas.
RSI Traffic Light Indicator tracks several RSI ( Relativ Streng Index) Periods and informs you, if the trend is changing. Trend is you friend, one of the classical Trend following is the Relativ Streng Index (RSI). With RSI Traffic Light Indicator you will get information about trendchange. The RSI Traffic Light Indicator alerts you if the trend is changing for your pair. Different trendchange criterials and visualisation themes inclusive. Your can adjust the indicator Trendchange criterials by
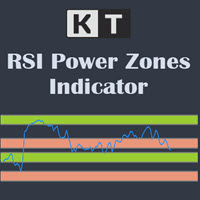
The KT RSI Power Zones divides and shows the movement of RSI into four different power zones to identify the potential support and resistance zones using the RSI.
Bull Support The bull support ranges from 40 to 50. The price is expected to reverse to the upside from this zone.
Bull Resistance The bull resistance ranges from 80 to 90. The price is expected to reverse to the downsize from this zone.
Bear Support The bear support ranges from 20 to 30. The price is expected to reverse to the

一个专业的交易工具是RSI和价格之间的背离指标,它允许您及时收到关于趋势反转的信号或捕捉价格回调走势(取决于设置)。 指标设置允许您根据RSI峰值的角度和价格的百分比变化来调整发散的强度,这使得微调信号强度成为可能。 指标代码经过优化,并作为Ea交易的一部分进行了非常快速的测试。
指标不重绘,交易方向的箭头正好位于信号出现的位置--在柱的开口处。 Fractal True . PeriodRSI_P = 14 ; //Period IndentFrom50_P = 10.0 ; //Indent +- from 50 [0...50] LeftBars_P = 1 ; //LeftBars RightBars_P = 1 ; //RightBars IndDivForce_P = 15.0 ; //Divergences force of indicator (not for the Lite version) PriceDivForce_P = 0.01
FREE

一个专业的交易工具是RSI和价格之间的背离指标,它允许您及时收到关于趋势反转的信号或捕捉价格回调走势(取决于设置)。 指标设置允许您根据RSI峰值的角度和价格的百分比变化来调整发散的强度,这使得微调信号强度成为可能。 指标代码经过优化,并作为Ea交易的一部分进行了非常快速的测试。
指标不重绘,交易方向的箭头正好位于信号出现的位置--在柱的开口处。 PeriodRSI_P = 14 ; //Period IndentFrom50_P = 10.0 ; //Indent +- from 50 [0...50] LeftBars_P = 1 ; //LeftBars RightBars_P = 1 ; //RightBars IndDivForce_P = 15.0 ; //Divergences force of indicator PriceDivForce_P = 0.01 ; //Divergences force of price Pr
FREE

В основу алгоритма этого осциллятора положен анализ веера сигнальных линий технического индикатора RSI . Алгоритм вычисления сигнальных линий выглядит следующим образом. В качестве исходных данных имеем входные параметры индикатора: StartLength - минимальное стартовое значение первой сигнальной линии; Step - шаг изменения периода; StepsTotal - количество изменений периода. Любое значение периода из множества сигнальных линий вычисляется по формуле арифметической прогрессии: SignalPeriod(Number)

Zigzag Indicator For RSI, To easily identify the highs and lows of the rsi signal. It is easier to observe divergent and convergent signals. Default setting: InpRsi =14 //Rsi Period InpDepth =12; // Depth InpDeviation =5; // Deviation InpBackstep =3; // Back Step
If you want open Exness account try this link : https://one.exness-track.com/a/teg5teg5 Dev buy taphu: Ha Van Tan - hatatrata - Trader's profile - MQL5 community Email: tan.ha@outlook.com
FREE

** All Symbols x All Timeframes scan just by pressing scanner button ** ***Contact me after purchase to send you instructions and add you in "RSI scanner group" for sharing or seeing experiences with other users. Introduction RSI divergence is a main technique used to determine trend reversing when it’s time to sell or buy because prices are likely to drop or pick in the charts. The RSI Divergence indicator can help you locate the top and bottom of the market. This indicator finds Regular diver
Simple RSI indicator.
User can choose TimeFrame for the RSI.
For example, you are using chart with M5 data
but want to see RSI from different fimeframe H4 drawn below the main chart window.
RSIhtf.ex5(iRSI.ex5 - another name) (h = higher, tf = timeframe) is designed specifically for this case.
Exports 1 buffer with indicator data.
The indicator is part of TS_DayTrader system.
FREE
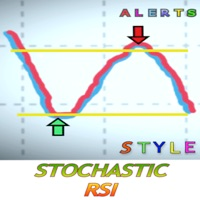
什么是随机RSI?
随机RSI(StochRSI)是技术分析中使用的一个指标,其范围在0和1之间(或在某些图表平台上为0和100),是通过将随机振荡器公式应用于一组相对强度指数(RSI)值而不是标准价格数据来创建的。这个版本包括提醒,不要错过真正的好机会。当你想接收买入信号或卖出信号时,你可以设置参数。为了接收任何信号,你必须通过MetaQuotes ID连接你的桌面版和Metatrader应用程序。MetaQuotes ID在你的MT4/5应用程序的设置>>聊天和信息中找到。在桌面上是在工具>>选项>>通知。你把ID放在桌面版上,激活通知,就可以开始了。
试试MT4版本, 这里
因为风格很重要
我知道每次都要点击属性来改变蜡烛的颜色、背景是浅色还是深色,以及放置或删除网格是多么令人厌烦。这里有一个一键式的解决方案。 三个可定制的按钮可以选择交易者想要的蜡烛样式。 一个按钮可以在白天和夜晚模式之间切换。 一个按钮可以在图表上显示或隐藏网格。 ***** 在设置中,你可以选择按钮在屏幕上的显示位置*****。
另外,请考虑查看我的其他产品 https://www

Indicator alerts for Dual Relative strength index rsi. Large rsi preset at 14 is below 30 small rsi preset at 4 is below 10 for buy bullish signals .
Large rsi preset are 14 is above 70 small rsi preset at 4 is above 90 for sell bearish signals . Includes mobile and terminal alerts. draws lines when alerts.
This indicator can help identify extremes and then the tops or bottoms of those extremes .
FREE

RSI divergence indicator finds divergences between price chart and RSI indicator and informs you with alerts (popup, mobile notification or email). Its main use is to find trend reversals in the chart. Always use the divergence indicators with other technical assets like support resistance zones, candlestick patterns and price action to have a higher possibility to find trend reversals. Three confirmation type for RSI divergences: RSI line cross 50 level Price returns to previous H/L C
FREE

RSI Scanner is a multi symbol multi timeframe RSI dashboard that monitors Relative Strength Index indicator for price entering and exiting overbought and oversold in up to 28 symbols and 9 timeframes.
Download Demo here (Scans only M1, M5 and M10) Settings description here MT4 version here
RSI Scanner features: Signals RSI entering and exiting the overbought and oversold zones. Monitors 28 customizable instruments and 9 timeframes at the same time. Supports all 21 timeframes of Metatra
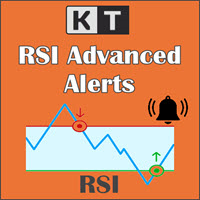
KT RSI Alerts is a personal implementation of the Relative Strength Index (RSI) oscillator that provide signals and alerts on four custom events: When RSI enter in an overbought zone. When RSI exit from an overbought zone. When RSI enter in an oversold zone. When RSI exit from an oversold zone.
Features A perfect choice for traders who speculate the RSI movements within an overbought/oversold zone. It's a lightly coded indicator without using extensive memory and resources. It implements all

该算法预测价格的短期变化,准确率为86%*. 当有一个大的移动由ATR确定,在超买或超卖条件,指标将提醒您。 预测价格是否会高于或低于信号蜡烛。 完美的平均回归交易,二元期权或期货合约在更大的时间框架。 该指标在5年的数据上进行了回溯测试,预测价格随时间变化的准确率为90%。
特征:
简单的设置 拖放到任何图表上 根据您的喜好调整参数(可选) 启用警报(可选) 你就完了! 视觉和音频警报 警报直接发送到您的手机 发送到终端的弹出警报 高胜率 赢得高达90%的交易 回溯测试5年和多种货币。 (请参阅网站的回测细节和分析)。 大量信号 预计每个符号每天1到2个信号*。 *这是如果你有30分钟蜡烛的指示灯。 灵活 适用于外汇,指数,商品和股票。 适用于任何时间范围 从5分钟到每天的酒吧都能很好地工作。 但是,它在更高的时间范围内更准确 很容易在图表上看到。 您可以更改信号条和信号箭头的颜色 关于我:
这个算法是由一个博士工程师,定量和活跃的交易者. 我开发了这些算法来交易我的个人资本,他们正在成功地做到这一点。 但是,我无法在一个组合中使用所有这些算法。 所以我为您提供了一个选
FREE
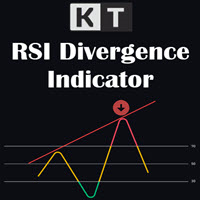
KT RSI Divergence shows the regular and hidden divergences built between the price and Relative Strength Index (RSI) oscillator. Divergence can depict the upcoming price reversal, but manually spotting the divergence between price and oscillator is not an easy task.
Features
Ability to choose the alerts only for the divergences that occur within an overbought/oversold level. Unsymmetrical divergences are discarded for better accuracy and lesser clutter. Support trading strategies for trend r

[ MT4 Version ] [ EA ] Advanced Bollinger Bands RSI MT5 Advanced Bollinger Bands RSI is an Indicator based on the functionalities of the Advanced Bollinger Bands RSI EA . The scope of this indicator is to provide a more affordable solution for users interested in the alerts coming out of the strategy but not in Autotrading. This strategy uses the Bollinger Bands indicator in combination with the RSI, the signal triggers only when both the BB and the RSI indicate at the same time overbought or ov

An Adaptive Moving Average (AMA) is one more moving average overlay, just like EMA. It changes its sensitivity to price fluctuations . The Adaptive Moving Average becomes more sensitive during periods when price is moving in a certain direction and becomes less sensitive to price movement when price is volatile. For more information, welcome to our Telegram Group. https://t.me/InfinXx
FREE

RSI Currencies is an indicator that is based on the RSI concept but with a totally different approach. It calculates its values calculating all RSI values of all pairs related to the same currency and making an average between them: the goal is to obtain a more solid and trustable information about what each currency are doing lowering the impact of market noise and extreme euphory on a particular pair to analyze the whole basket. It works on 28 forex majors and minor pairs related to these curr
FREE

Highly configurable Macd indicator.
Features: Highly customizable alert functions (at levels, crosses, direction changes via email, push, sound, popup) Multi timeframe ability Color customization (at levels, crosses, direction changes) Linear interpolation and histogram mode options Works on strategy tester in multi timeframe mode (at weekend without ticks also) Adjustable Levels Parameters:
Stochastic RSI Timeframe: You can set the lower/higher timeframes for Stochastic RSI. Stochastic RSI
FREE

因为风格很重要
我知道每次都要点击属性来改变蜡烛的颜色、背景是浅色还是深色,以及放置或删除网格是多么令人厌烦。这里有一个一键式的解决方案。 三个可定制的按钮可以选择交易者想要的蜡烛样式。 一个按钮可以在白天和夜晚模式之间切换。 一个按钮可以在图表上显示或隐藏网格。 ***** 在设置中,你可以选择按钮在屏幕上的显示位置*****。 请考虑查看我的其他产品 https://www.mql5.com/en/users/javimorales.fer/seller
什么是随机RSI?
随机RSI(StochRSI)是技术分析中使用的一个指标,其范围在0和1之间(或在某些图表平台上为0和100),是通过将随机震荡器公式应用于一组相对强度指数(RSI)值而不是标准价格数据来创建的。
作者简介
Javier Morales,交易算法的创始人。
FREE
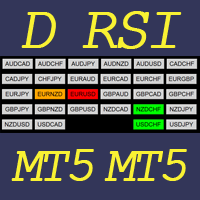
This indicator helps to visualize the RSI status of 28 pairs. With the feature of color panel, alert, and notification features, user can catch the potential buy and sell opportunities when the 28 main pairs cross the oversold/overbought area on one Dashboard quickly. Dashboard RSI is an intuitive and handy graphic tool to help you to monitor all 28 pairs and provide trading signals based on the RSI Rules (Overbought/Oversold and Stochastic Cross).
Color legend clrOrange: RSI signal is above t
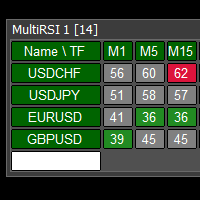
This tool monitors RSI indicators on all time frames in the selected markets. Displays a table with signals to open a BUY trade (green) or SELL trade (red). You can set the conditions for the signal. You can easily add or delete market names / symbols. If the conditions for opening a trade on multiple time frames are met, you can be notified by e-mail or phone message (according to the settings in MT5 menu Tools - Options…) You can also set the conditions for sending notifications. The list of s

RSI Scanner, Multiple Symbols and Timeframes, Graphical User Interface An indicator that scans multiple symbols added from the market watch and timeframes and displays result in a graphical panel. Features: Multi symbol Multi timeframe Alerts and Notifications Live Monitoring Sorting modes One click to change symbol and timeframe Inputs for RSI and scanner settings
FREE

The indicator draws levels based on the overbought and oversold values of the RSI indicator.
The maximum values are taken into account, which are equal to or exceeded certain limits. That is, for example, when the price has gone into the overbought zone, the highest price is selected from all prices in this zone for this period of time, and as soon as the indicator value returns to a value below the overbought value, the level is fixed and the calculation of new values begins.
The sam
FREE
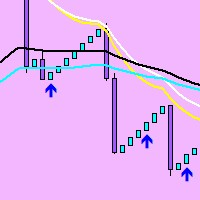
modification of the Rsi ma indicator. Added a filter-the trend indicator iMA (Moving Average, MA). You can also now set the character code (from the Wingdings font) for the arrows and the offset of the arrows.
The 'Rsi ma' indicator draws two indicator buffers using the DRAW_ARROW drawing style. The 'Oversold' buffer is drawn when the indicator LEAVES the oversold zone and the iMA is under the price, and the 'Overbought' buffer is drawn when the indicator LEAVES the overbought zone and the iM

MaRSI Scalper & Trader The combination of moving averages and RSI This setting is flexible so it can be set with regards to user test uses 1. For scalping 2. For long time trading
features 1. Sends push notifications 2. Sends alerts on computers 3. Draws Arrows 4. Draws respective indicators (this feature will be edited in the future)
Have feedback https://t.me/Tz_Trade_Logics or just call +255766988200 (telegram/whatsApp) Head to discussion page to leave your comments Improvement are on t
FREE

RSI Arrow1 is an arrow indicator based on the RSI, is easy to use; no internal adjustments to be made. the user can change the indicator period as desired in the settings. It can be used on all markets but it will all depend on your Trade strategy. There is no better Time Frame for its use; the use will depend on the Trader himself.
Settings:
RSI Period Push Notification Email Notification Audible Alert Down levels Up levels
您知道为什么MetaTrader市场是出售交易策略和技术指标的最佳场所吗?不需要广告或软件保护,没有支付的麻烦。一切都在MetaTrader市场提供。
您错过了交易机会:
- 免费交易应用程序
- 8,000+信号可供复制
- 探索金融市场的经济新闻
注册
登录