适用于MetaTrader 5的新技术指标 - 6

This indicator is designed to help traders to help them Synchronize objects across all charts that have the same pair/currency.
Applicable objects: -Rectangle
-Trendlines
-Trendlines by Angle
-Horizontal Lines
-Vertical Lines
-Arrow Lines
-Channels
Known Issues : - Visualization is not copied to the other charts. - If indicator is only placed in one chart, other charts with the same pair/currency will have difficulty deleting the objects if there is not Sync Objects In Charts indicato
FREE

The Liquidation Estimates (Real-Time) experimental indicator attempts to highlight real-time long and short liquidations on all timeframes. Here with liquidations, we refer to the process of forcibly closing a trader's position in the market.
By analyzing liquidation data, traders can gauge market sentiment, identify potential support and resistance levels, identify potential trend reversals, and make informed decisions about entry and exit points.
USAGE (Img 1) Liquidation refer
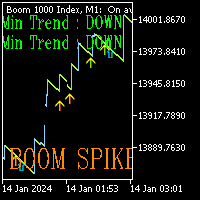
Boom Spike mater is the future for trading Boom markets. It has been designed to run on Boom 300 , 500 and 1000 markets on the 1 minute timeframe. It has 2 different trading modes (Aggressive and Normal) Aggressive mode will plot Yellow and blue arrows. 2 different conditions to help you make the right choice. Enter first trade on yellow arrow and second trade on blue candle. SL in this mode will be 10 Candles from the blue arrow. Normal mode will only plot red arrows on the chart. This mode is

An indicator to show the current U.S. Dollar Index ( USDX , DXY , DX ). It is a weighted geometric mean of the dollar's value relative to the following select currencies: Euro (EUR), 57.6% weight. Japanese yen (JPY) 13.6% weight. Pound sterling (GBP), 11.9% weight. Canadian dollar (CAD), 9.1% weight. Swedish krona (SEK), 4.2% weight. Swiss franc (CHF) 3.6% weight.
You can request me to customize a similar indicator with weighted and currency pairs you desire. Just call me on MQL5, thank

Простой индикатор тренда в NRTR виде с отрисовкой линий стоплосса и тейпрофита, цвет и направление движения которых определяются действующим трендом. Индикатор имеет возможность подавать алерты, отправлять почтовые сообщения и push-сигналы при смене направления тренда. Следует учесть что значение входного параметра индикатора Deviation of the take profit line in points для каждого финансового актива на каждом таймфрейме необходимо подбирать индивидуально!

The Smart Liquidity Profile is color-coded based on the importance of the traded activity at specific price levels, allowing traders to identify significant price levels such as support and resistance levels, supply and demand zones, liquidity gaps, consolidation zones, Buy-Side/Sell-Side Liquidity and so on. Smart Liquidity Profile allows users to choose from a number of different time periods including 'Auto,' 'Fixed Range,' 'Swing High,' 'Swing Low,' 'Session,' 'Day,' 'Week,' 'Month,' 'Quart

Exclusive Limited Time Offer! Grab this useful indicator for a lifetime at just $49. Volatility indicator dashboard designed to revolutionize how traders perceive and navigate market volatility. Track volatile for multiple currency pairs one at time for multiple timeframes. Works best with Forex Market, Gold, Silver, Oil. Available in MT4, MT5. Indicator Features: Multi-Symbol, Multi-Timeframe Dashboard: Gain a strategic advantage by simultaneously monitoring volatility across various currenc

Are you tired of trading without a clear direction ? Do market fluctuations and noise leave you feeling overwhelmed ?
Here is the solution you've been searching for! Imagine an indicator that simplifies trading, cuts through market noise, and provides crystal-clear signals. The Heiken Ashi OHLC Indicator does just that!
What does the Heiken Ashi OHLC Indicator do? It transforms traditional candlestick charts into a trader's dream. Instead of dealing with erratic price movements, you'll wi
FREE

Gobbo è un indicatore professionale che evidenzia il trend del mercato con un aspetto grafico chiaro e comprensibile, è basato sulla Moving Average e può essere impostato su qualsiasi periodo di intervallo, di default impostato sul periodo 14, scegliendo un periodo più alto evidenzierà meno cambi di tendenza per un approccio sul medio o lungo periodo, con un periodo più basso più cambi di tendenza per un approccio sul breve termine L'aggiornamento e l'adattamento al time frame scelto avviene in

"If you're using it, give it a rating."
MBFX Timing is a (MetaTrader 5) indicator and it can be used with any forex trading systems / strategies for additional confirmation of trading entries or exits. The MBFX Timing Indicator is a momentum oscillator that tells about the overbought and oversold levels. Like many other oscillators, the Indicator fluctuates between certain levels. These levels are 0 and 100. When the price is near 100, it’s an overbought level, while near 0 signifies an overs
FREE
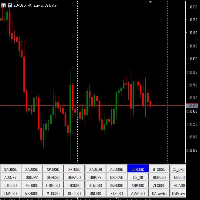
"Symbol Changer" is an indicator created for the Metatrader 5 (MT5) platform, providing the ability to change symbols. To perform all operations with this indicator, use the following characteristics:
Characteristics: Installation: To install the indicator on the MT5 platform, place your .mq5 code in the Indicators folder and restart MT5. Visualization: On the chart, the "Symbol Changer" indicator places special buttons to change symbols. Initial Settings: There are no additional settings for
This Indicator shows the trend of movement. If the candle is red, you need to look for Buy signals. If the candle is Red, then look for a Sell signal.
The indicator is especially suitable for scalping.
When trading, take into account risk management.
For trading, I recommend the timeframe M5 M30
Good luck to all ))
If you have any questions, please contact us at +77767238899
Email dilshodaka25@gmail.com

The GGP Trendlines with Breaks Alert MT5 Indicator is a technical analysis tool that can assist investors in identifying market trends. The indicator returns pivot point based trendlines with highlighted breakouts. Users can control the steepness of the trendlines as well as their slope calculation method. This indicator is MT5 conversion of the Trendlines with Breaks Indicator by “ LuxAlgo “ in Trading View website and some alert methods are added to provide real-time alerts when a trading sign

The GGP Chandelier Exit Alert MT5 Indicator is a volatility-based indicator that identifies stop loss exit points for long and short trading positions. Chandelier Exit is based on the Average True Range (ATR) indicator. It is designed to keep traders in the trend until a defined trend reversal happens. Traders use CE to maximize their returns in a trade and make stop loss exit decisions. It is based on the principle that a trend reversal is highly probable when the price of an asset moves agains

The "Angel Algo" indicator, designed for the TradingView platform, is a powerful technical analysis tool that assists traders in identifying dynamic support and resistance levels in real-time. It provides valuable insights into potential breakout points and market regimes.
At its core, the "Angel Algo" indicator utilizes a rolling window of price data to calculate maximum and minimum price levels. It then dynamically identifies support and resistance levels by examining specific conditions re

GIVE A LOOK TO MY OTHER PRODUCTS ! 100 % PER MONTH PROFIT---- MY NEW SIGNAL HERE -------> https://www.mql5.com/en/signals/2162238?source=Site+Signals+My# Smoothed MA cross alert,is a cool indicator that notificate you directly on your telephone or email when 2 Smoothed Moving average ( you choose the parameters ) crosses. This is very important when you want to know a change of trend and you can't stay in front of your pc! The indicator give you the alert just when the next bar opens ,so give

Introducing our groundbreaking indicator designed to elevate your trading strategy! Unlock the power of precise volume analysis with Buy, Sell, and Neutral indicators. Tailor your approach with customizable levels based on timeframes and moving average methods.
Key Features: Dynamic Volume Insights Instantly identify Buy, Sell, and Neutral volumes for informed trading decisions. Gain clarity on market sentiment like never before. Adaptable Level Configuration Customize and adapt levels to matc

Introducing our cutting-edge product, an innovative MACD Oscillator with a dynamic level enhanced by a decimal point Moving Average (MA) also with the versatility of multiple moving average modes. This advanced trading tool brings precision and flexibility to your technical analysis, offering a seamless experience for traders seeking a competitive edge in the financial markets.
Key Features: Dynamic Level Precision Our MACD Oscillator is equipped with a dynamic level feature, providing traders

Introducing our revolutionary intra-day trading indicator, meticulously crafted to optimize your trading insights within the 24-hour market cycle. Immerse yourself in historical data with precision using two distinctive modes - "All History" and "Last X Hours."
Key Features: All History Mode Uncover a comprehensive view of the day's dynamics. Instantly analyze the preceding day's high and low, 50% mid-point, and the open versus close price for the current day. Decode critical patterns to infor

如你在寻找一款能契合ICT交易理念的可靠指标工具,ICT Market Structure将会为您提供了一份更直观体现ICT理念的市场结构报告,帮助你成为快人一步的领先投资者 这款一体化指标专注于ICT概念(SMC概念),ICT Market Structure能帮您更容易找出机构交易的时间点并跟随其交易脚步。通过理解和利用这种策略,交易者可以获得有关市场走势的宝贵见解,并能根据价格找到更实际的进场出场时机。 以下是一些功能的简要介绍: 不重绘、不重画、不滞后的指标 显示带有成交量指标的订单块(看涨和看跌) 并提供形成警报
实时市场结构和摆动结构高低点(HH, HL, LL, LH) 并提供形成警报
结构突破(BOS), 市场结构转变 (CHoCH)/ 动量转变(MS)
破位订单块标签并提供形成警报
公允价值缺口(看涨和看跌FVG)检测 并提供形成警报
显示银弹时间
显示以下地区交易时间段:伦敦(London)、纽约(New York)、亚洲(Asia)
可以自定义所有文本和区块的颜色
相关话题标签: ICT交易,SMC交易,聪明钱,智能洞察,机构视角,流动

MomoPoints 是一个在图表上显示多头和空头入场点/加仓点的指标。
根据势头和趋势强度,MomoPoints 显示具有良好风险回报率的条目/添加。
设置
----------------------------------
设计:信号的颜色、大小和翼形(图形符号)可以调整。
信号设置:可以设置移动平均线周期、趋势强度、移动平均线到价格的距离以及RSI周期。
信号值可以显示为注释,以便为资产设置正确的值。该指标还可以适合每个交易对或资产。
每个资产都需要自己的设置来显示好的条目。如果您需要特定配对的设置并且您无法自行找到它,我可以帮助您。
警报:可以激活推送通知和声音语音警报。
信号实时发生,无需重新绘制
如果您有任何疑问或需要其他信息或功能,我可以随时与您联系。
FREE
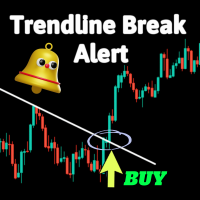
這是一個簡單的指標,可以提供趨勢線突破的警報。
如果您在交易中習慣使用趨勢線,它可能會很有用。 可調參數包括:
蠟燭標識:突破後何時發出信號 以及三種類型的警報: 發送郵件 聽得到的警報 推送通知
為了測試目的,我們建議使用 MetaTrader 4 而不是 MetaTrader 5 的策略測試器,因為它不支持繪製趨勢線。
MT4 版本在: https://www.mql5.com/en/market/product/111112?source=Site+Market+My+Products+Page
觀看此視頻以了解如何在您的手機上設置通知警報:
https://www.youtube.com/watch?v=4oO-3fMQ4QA
安裝指南:
https://www.mql5.com/en/blogs/post/739828
https://www.mql5.com/en/blogs/post/751762
我歡迎您對指標提供反饋或評論。
祝您交易成功!


The new update makes this indicator a complete tool for studying, analyzing and operating probabilistic patterns. It includes: On-chart Multi-asset percentage monitor. Configurable martingales. Twenty-one pre-configured patterns, including Mhi patterns and C3. An advanced pattern editor to store up to 5 custom patterns. Backtest mode to test results with loss reports. Trend filter. Hit operational filter. Martingale Cycles option. Various types of strategies and alerts. Confluence between patter

The MasterOBV indicator is a powerful technical analysis tool that utilizes volume, positive correlation, and a Moving Average (MA) to enhance trend identification in financial markets. By incorporating assets with positive correlation through the indicator menu, MasterOBV provides a refined approach to assessing the strength and direction of trends. The inclusion of the Moving Average adds additional smoothing to price movements, aiding in a more accurate tracking of the underlying trend over
FREE

The MasterOBV indicator is a powerful technical analysis tool that utilizes volume, positive correlation, and a Moving Average (MA) to enhance trend identification in financial markets. By incorporating assets with positive correlation through the indicator menu, MasterOBV provides a refined approach to assessing the strength and direction of trends. The inclusion of the Moving Average adds additional smoothing to price movements, aiding in a more accurate tracking of the underlying trend over

It makes it easier for you to trade by providing trend charts in all frames from bottom to top. If it touches the upward trend, it is a good opportunity to sell, and the target is the downward trend, and vice versa. If it touches the downward trend, it is a good opportunity to buy, and the target is the upward trend. It can automatically redraw the trend. You can monitor higher frames and trade on lower frames for speculation .

Transform your financial chart analysis with our innovative Candle Coloring Indicator. This powerful tool allows you to instantly visualize market trends based on closing prices relative to a customized average. Customized Coloring: Choose colors that best suit your analysis style. Highlight candles above the average in a vibrant color of your choice and candles below the average in another distinctive color. Adjustable Average: Tailor the indicator to your trading strategies by setting the aver
FREE

The BS Vwap 5 Bands indicator is an advanced tool that integrates price and volume data, providing a comprehensive view of market dynamics. Designed with a focus on performance and tested under real trading conditions, this indicator aims to deliver valuable insights to traders. Its innovative approach combines VWAP with five distinct bands, revealing whether the price is aligned with the "fair price" and indicating overbought or oversold conditions. Additionally, the indicator offers visual cus
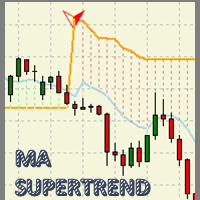
MA Super Trend MT5 An indicator based on the average maximum and minimum of a candle period, and next to the average true range (ATR) result in a powerful visual work tool to optimize the trend zones and potential areas of market entry. With great adaptability in any type of financial asset and with a potential for visual simplification in the graph, which will make the graph a simple work table. An indicator created to measure: - For MT5 desktop platform. - Great for Day trading, Swing Trading

MP Price Change Indicator is a tool to calculate the price movement by percentage. The Value of this indicator can be adjusted to look back of the percent of price change within certain timeframes. This is a powerful tool when used by other indicators as well, such as ATR and ADR, for understanding price fluctuations and tolerance in different strategies. ___________________________________________________________________________________ Disclaimer:
Do NOT trade or invest based upon the analys
FREE

The Buyside & Sellside Liquidity indicator aims to detect & highlight the first and arguably most important concept within the ICT trading methodology, Liquidity levels. SETTINGS
Liquidity Levels
Detection Length: Lookback period
Margin: Sets margin/sensitivity for a liquidity level detection
Liquidity Zones
Buyside Liquidity Zones: Enables display of the buyside liquidity zones.
Margin: Sets margin/sensitivity for the liquidity zone boundaries.
Color: Color option

Индикатор PivotPointSuperTrend отлично показывает данные Тренд на основе мат данных от Pivot и ATR и очень удобен для входа в сделку и выставления стопов. Если кто то сможет добавить в код мултитаймфрем, я и многие пользователи будут очень Благодарны, то есть чтобы ондикатор показывал значение старшего таймафрема на графике младшего таймфрема, Заранее Спасибо!
FREE

To get access to MT4 version click here . This is the exact conversion from TradingView: "Trendlines with Breaks" by LuxAlgo
This is a REPAINT indicator. Buffers are available for processing. However there are objects on chart to process also. All input fields are available. Alerts are generated based on bars closure. You can message in private chat for further changes you need. Thanks for downloading

Traders Dynamic Index (TDI) MetaTrader indicator — a comprehensive but helpful indicator that uses RSI (Relative Strength Index), its moving averages, and volatility bands (based on Bollinger Bands) to offer traders a full picture of the current Forex market situation. Here is single timeframe product. Once puscharse this indicator, you free to use MTF scanner (free at here ) The Traders Dynamic index TDI indicator is the next generation of the popular Trader Dynamic index indicator dev

The Donchian Channel Indicator helps to identyfy the market trend and the breakouts of the channel. Breaking above means the momentum of the market is highly bullish. Breaking below means the momentum of the market is highly bearish.
SETTINGS: PERIOD - default value 20. The number of last candles beeing taken into account when generating the line. OFFSET - default value 0. The percentage number that makes the channel bigger or smaller. LINE_COLOR - default color is set Blue. Here you can set w

El indicador Global Average es una media móvil que difiere significativamente de las medias móviles tradicionales. Su función principal es proporcionar un precio objetivo de take profit que sirve como referencia para la estrategia de regresión a la media. Este manual detallará la estrategia de Venta/Compra basada en este indicador, que implica medir el primer impulso del precio despues de romper la media del indicador, luego avanzar con el nivel de Global Average , y vender/comprar cuando el pre

这是一种基于MACD的趋势跟踪指标,当处于200 MA之上时提供买入信号,当低于200 MA时提供卖出信号。当MACD穿过零线时,将生成信号。此指标还展示了可用作止损的支撑和阻力水平。
可调整的参数包括MA周期、MACD快速EMA、慢速EMA以及支撑-阻力间隔。它绘制在最近蜡烛的最低点和最高点。
默认设置如下: SR间隔:10, MA周期:200, 快速EMA:24, 慢速EMA:26。
调整这些值可能导致信号更频繁或更少,建议进行测试以确定最有效的配置。
推荐使用1小时或4小时的时间框架,但在任何时间框架上都可能有效。该指标适用于所有交易工具,包括外汇、股票和商品等。
欢迎进一步了解其详细应用和优势。此外,它还包含报警功能。
请查看我的其他产品: https://www.mql5.com/en/users/8587359/seller
FREE

Introducing the Quasimodo Genie, a powerful indicator for MetaTrader 5 that automatically identifies the Quasimodo or Over and Under pattern. This indicator is perfect for traders who want to take advantage of this popular chart pattern and make profitable trades. With the Quasimodo Genie, you can easily find the best swing points for the Quasimodo pattern and place virtual trades with stop loss and take profit levels. The Quasimodo Genie is easy to use and comes with a range of customizable set
FREE

The GGP SuperTrend MT5 Indicator is a technical analysis tool that can assist investors in identifying market trends. The indicator is based on ATR and is very useful for capturing the direction of an asset’s momentum and is widely employed when looking at stocks, currencies, and commodities. It plots a line on the price chart, which acts as a dynamic level of support or resistance, helping traders and investors make informed decisions about entry and exit points. This indicator is MT5 conversi

Overview:
The Custom_Timeframe_MAs indicator for MetaTrader 5 lets you study different timeframes using M1 candles. It offers 12 moving average methods for analyzing trends. Why It's Useful: Versatile Timeframes: Even though MetaTrader has fewer timeframes, this indicator expands options by using M1 candles. Various Moving Averages: Choose from 12 moving average types: SMA, EMA, DEMA,TEMA,WMA, VWMA,SMMA, HullMA, LSMA, ALMA, SSMA, TMA, to understand price movements better. For Automated Tradi

我们的基本蜡烛图形态指标让识别主要蜡烛图形态变得前所未有的简单。只要看一眼图表,就能发现锤子、黄昏之星、三白兵等形态。凭借直观的界面和清晰的视觉提示,我们的指标可帮助您快速准确地识别交易机会/ MT4 版本
该指标的仪表盘扫描器:( Basic Candlestick Patterns Dashboard )
指标特点 准确性 : 自动识别主要蜡烛图形态,无需手动搜索。 自定义 : 根据自己的交易偏好调整参数,以适应自己的交易风格。
包括谐波形态 看涨形态 Hammer Inverse hammer Bullish engulfing Morning star 3 White soldiers 看跌形态 Hanging man Shooting star Bearish engulfing Evening star 3 Black crows
主要输入 Show only confirmed patterns :该选项允许仅显示已被蜡烛图确认的形态,建议将其设为默认值。 Max bars :计算指标时需要回溯的条数。 Pop-up alert: 向 MT5
FREE

本产品接收指标/信号工具的信息,在满足特定条件时显示箭头或通知。
例如,当MA25和MA50交叉、SAR反转、MACD改变正负值或收盘价穿过布林线时,都会显示箭头和通知。
具体配置请参考示例设置图。
详细手册和配置文件:
https://www.mql5.com/en/blogs/post/755082
免费版本也可供下载。
箭头可以以多种配置显示,组合方式无限,任您想象。
如果您在设置与信号工具和指标的链接时遇到困难,请联系我们寻求帮助。
我们还可以向您的智能手机、电子邮件、Slack、Line、Discord等推送通知,最多添加8个参数,或根据您的要求单独链接到指标。您可以将其用作信号工具的补充或事件的通知功能。 https://www.mql5.com/zh/users/mt4kabukimono
FREE

One of the most powerful and important ICT concepts is the Power of 3. It explains the IPDA (Interbank Price Delivery Algorithm) phases. PO3 simply means there are 3 things that the market maker's algorithm do with price:
Accumulation, Manipulation and Distribution
ICT tells us how its important to identify the weekly candle expansion and then try to enter above or below the daily open, in the direction of the weekly expansion.
This handy indicator here helps you keep track of the weekly

"Moving Ratio Candle" is used to check the distance of a candle to a theoretical pressure point. Furthermore, we have two points of interest, the first for the mean and the second for the median. This indicator uses the shape of bars and the line that crosses the bar from left to right is based on the calculation of the closing price for both sides. The rest follows a more standard calculation. The same could be done as a line, but I want to know the behavior of this indicator in relation to the
FREE

The PUA MultiType Pivot indicator is built on the daily chart of the previous day. The PUA MultiType Pivot indicator is one of the most popular tools in technical analysis, used by traders to identify potential reversal points in financial markets. This indicator constructs three types of Pivot points: Classic, Fibonacci, and Camarilla, each offering its unique approach to market analysis. The advantages of this indicator include: Simplicity and Clarity PUA MultiType Pivot provides clearly defi
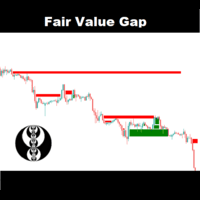
The FairValueGap indicator finds market imbalances which suggest that buying and selling are not equal. Fair value gaps are a very useful concept in price action trading, as they provide a trader with information about where a lot of volatility is in the market which makes having the FairValueGap indicator a must
Check out: Break of structure Features Has a filter for filtering out FVG zones with less volatility Multiple currency pairs supported Very easy to use and very customizable Inpu
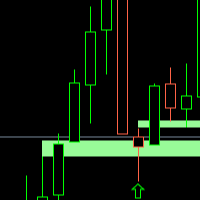
FVG WATCHER is an indicator that helps traders identify fair value gaps in the market. The indicator draws fair value gaps and alerts the user when the fair value gap has been swept. It allows users to specify how it should be swept, what time range to alert, and the size of the fair value gap to alert. It also allows the user to apply a moving average trend filter for better choice of alerts. The indicator also allows push mobile notifications. What makes FVG Watcher special is that it can be

RFX5 Bull Bear Powers indicator shows the absolute power of bulls and bears controlling the market. Both powers are shown simultaneously with red and green colors for bear and bull powers respectively. When red line goes over the green line it means that bears are controlling the market. When green line goes over the red line it means that bulls are controlling the market. The green/red horizontal symbol line at the bottom of the indicators shows which party has more strength. Time Frame: M3
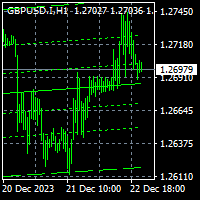
To get access to MT4 version click here . This is the exact conversion from TradingView: "Linear Regression Channel" by "LonesomeTheBlue". This is a repaint indicator. Buffers are not available for processing. You need to parse objects on chart. All input fields are available. You can message in private chat for further changes you need. Thanks for downloading
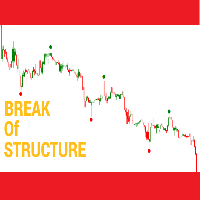
The indicator simplifies the hustle of trying to find market highs and lows. The indicator uses a method called break of structure - a break of structure is simply the process of forming a higher high on an uptrend without first creating a lower low and a lower low on a downtrend without first developing a higher high in other words a break of structure is a change in price behavior and signals a shift in market momentum. That being said the indicator is the ace card every trader should have.

基本供求指标是 一款功能强大的工具,旨在加强您的市场分析,帮助您在任何图表上识别关键机会区域。这款免费的 Metatrader 指标拥有直观易用的界面,能让您清楚地了解供需区域,从而做出更明智、更准确的交易决策/ 免费 MT4 版本 该指标的仪表盘扫描器: ( Basic Supply Demand Dashboard )
功能特点
该指标可自动扫描图表中的供需区,无需进行繁琐的手动分析 图形显示距离最近的供应区和需求区的剩余距离 供应区以一种独特的颜色突出显示,而需求区则以另一种颜色显示,便于快速准确地进行解读 该指标会自动计算最近的供应区或需求区与图表上当前价格之间的距离(以点为单位),为您提供清晰、可量化的参考。以点数为单位的距离会清晰地显示在图表上,让您可以快速识别与当前价格有较大或较小距离的区域 在接近或突破供需区时发出警报 适用于任何时间框架 可选择深色或浅色主题,自定义图表显示效果
如何使用
建议使用 M1 和 M5 时间框架。观看下面的视频,了解其工作原理。
FREE

玛莉指标:MT5 中的精确交易 使用玛莉指标提升您的交易,该指标专为MT4和MT5中的卓越信号精确度设计。这一多功能工具针对加密货币和外汇市场进行了优化,为您的交易策略提供精确性和灵活性。 无缝集成至MT4:对于MT4平台用户,玛莉指标完全兼容且可在 此处 访问。 针对加密货币和外汇市场的优化: 加密货币卓越性 :玛莉指标专为动态的加密货币市场量身定制,提供精确及时的信号,对于导航加密货币交易至关重要。 外汇友好默认设置 :其设置同样适用于外汇市场,确保在不同的市场条件下具有多功能性和可靠性。 主要特点: 灵活的显示选项 :选择您偏好的信号显示方法——视觉冲击力强的箭头或信息丰富的文本标签。 可调敏感度 :微调敏感度,实现信号响应性和准确性之间的平衡。 高级ATR周期自定义 :调整ATR周期,以迅速适应波动的市场条件,增强您的分析。 基于平均趋势指示的信号 :通过基于平均趋势指示蜡烛的信号,探索市场趋势,提供独特的市场视角。 信号设计和提醒: 可定制视觉效果 :个性化信号大小和颜色,以获得清晰的视觉提示。调整文本标签颜色以提高可读性。 实时提醒 :配置提醒以保持最新状态。选择MT4

Cobra Pivot Points 是一个用于绘制最佳优化枢轴点的指标,您可以通过下载 DEMO 自行回测。
1. 选择两种最佳枢轴模式:Cobra Pivots 或 Camrilla Pivots
2. 您可以使用任何时间范围,不限于 D1。
3. 您可以使用 Shift 参数来调整前一天的高低收盘值。 1 = 前一柱,2 = 前一柱之前的柱,依此类推。这些参数将帮助您研究和开发枢轴。
4. 触摸级别后发出警报、电子邮件或推送通知。 一旦触及水平,枢轴水平将被视为缓解,因此不会再次提醒您。 如果您想再次发出警报,则需要更改时间范围以重置警报。
5. 完全自定义线条颜色、线条样式、线条宽度、文本颜色和字体。
Cobra Pivots 分为三个区域:LZone(非常接近的剥头皮水平)、NZone(当市场盘整时)和 HZone(距离稍远的水平最适合头寸交易),可以在指标设置中显示/隐藏。
卡姆里拉枢轴公式为:
LS1 = 前一日收盘价- ((前一日最高价-前一日最低价)*0.50);
LS2 = 前一日收盘价- ((前

很多人通过对冲的方式来交易,例如做多EURUSD的的同时做空GBPUSD,但是很多人却缺乏专业的量化指标来精准计算两个相关性品种的真实价差。清风对冲指标提供完美解决方案,可查看两个相关品种几十年真实价差变化。 这是前所未有的方式,完全的原创、创新。 允许调用任何两个具有相关性的品种,计算其数十年真实价差乃至每一分钟的真实价差。例如EURUSD——GBPUSD,EURUSD——AUDUSD,EURCAD——GBPCAD,XAUEUR——XAUGBP,AUDUSD——NZDUSD,AUDJPY——NZDJPY等等。 只要两个品种价格走势具备一定的相关性,并且涨跌同向,就可以采用该指标精准计算真实价差。 对于自动化套利对冲交易或者手动套利交易,其意义非常重大。 真实价差计算是一切对冲套利的基础,只有这个基础是可靠的,你的对冲套利交易才能得到保障。
FREE

Réngōng zhìhuì qūshì fāxiàn zhě (D Originals).
Wàihuì de shuāiluò.
Wǒmen jīngcháng wèn “jīngjì yèwù rúhé zhuànqián?”, Wǒmen huì qìngzhù wǒmen zhè yībiān de rènhé xiǎo'é yínglì jiāoyì.
Dàn shǐyòngle (D Originals) hòu nǐ huì wèn zìjǐ `wǒ shì rúhé yīyè zhìfù de?'.
Rúcǐ shēnkè, xíngdòng shèng yú xióngbiàn.
Yǒule réngōng zhìhuì qūshì guānchá zhě, bùyào hàipà:
*Shìchǎng cāozòng
*shìchǎng nìzhuǎn
* jū jí shǒu de jìnrù yǔ cúnzài
*làzhú tiàoyuè
cǐ zhǐbiāo shìyòng yú MT5 píngtá

An ICT fair value gap is a trading concept that identifies market imbalances based on a three-candle sequence. The middle candle has a large body while the adjacent candles have upper and lower wicks that do not overlap with the middle candle. This formation suggests that there is an imbalance where buying and selling powers are not equal. Settings Minimum size of FVG (pips) -> FVGs less than the indicated pips will be not be drawn Show touched FVGs Normal FVG color -> color of FVG that hasn't
FREE
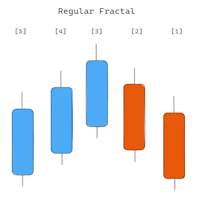
该指标显示较高时间范围内的分形。可以显示两种类型的分形:“常规分形”和“黑白分形”。 考虑分形“UP”的形成。 “常规分形”是一种非常严格的分形,其中每个后续“高”价格(中央柱的左侧和右侧)都较小。而在“BW Fractal”中只有一个条件:中央柱(其价格“最高”)必须是最高的。从视觉上看,这两种模式之间的差异如图 1 所示。 “较高时间范围”参数必须大于当前时间范围,如果不满足这一要求,将会出现一条包含错误描述的警报,并且指标将无法工作。此外,为了优化,仅在新柱上进行搜索。 我也不能忽略“强制下载历史记录”选项 - 该选项在周末效果很好:它强制下载高时间范围历史记录。 该指标显示较高时间范围内的分形。可以显示两种类型的分形:“常规分形”和“黑白分形”。

This is a simple order block locator. Searched for the existence of order blocks only at extremums. If you want multi criteria order block location check my other indicator which is more powerful here These order blocks are ICT order blocks without any buttering.
The indicator can be a useful tool for detecting reversals, continuations. You can also use the indicator as confluence with your other tools
FREE

This is a simple trend strenght indicator that is based on 5 moving averages on five diferente timeframes. As for now, the end user has no access to the SMA configurations but ill implement that on the future.
This indicator has 7 diferents trend indexes they are. Strong bearish, bearish, slighly bearish, normal, slighly bullish, bullish and strong bullish. You can change the gauge colors to better fit your taste and the chart background.
FREE

Stochastic indicator alerts when EA Available in comments , must have indicator installed buys stochastic main line is above signal line stochastic is below 30 rsi 5 is below 20 sell stochastic main line is below signal line stochastic is above 70 rsi 5 is above 80 ADD to chart Stochastic k 30 - d 9 - slowing 3, levels 30/70 rsi 5 lelels 20.80
Full alerts push, mobile , email ect All input settings variable feel free to contact for more information or alert sugestions
FREE

This Mt5 Indicator Signals when there is two opposite direction bars engulfed by current bar. has a recent Exponential Moving Average Cross and past bar was oversold/bought Expert Advisor Available in Comments Free Version Here : https://www.mql5.com/en/market/product/110114?source=Site  ; Full Alerts for mt5 terminal , phone , email, print to file, print to journal Buy Signal ( blue line ) Past ema cross ( set at 30 bars back ) Past bar rsi is oversold ( level 40 ) Engulfing bar closes
FREE

The " Pure View " indicator is designed to quickly display and hide indicators on the chart. Description
1. Currently Pure View works with Stochastic, MACD, RSI indicators 2. Displaying and hiding indicators occurs using hot keys 3. The key combination Shift + C will display or hide the "Stochastic" indicator on the chart 4. The key combination Shift + V will display or hide the "RSI" indicator on the chart 5. The key combination Shift + B will display or hide the "MACD" indicator on the chart
FREE

MT5 Candlestick Pattern Alert Indicator: Enhance Trading Precision and Speed Overview The MT5 Candlestick Pattern Alert Indicator stands as a robust solution tailored to empower traders by swiftly detecting candlestick patterns and delivering timely alerts through various channels. This advanced tool facilitates efficient analysis of patterns, enabling traders to seize potential profitable trades promptly. Significance of Candlestick Patterns Candlestick patterns play a pivotal role in technical
FREE

Camarilla Swing Trade Indicator is an Indicator. Support and resistance points are calculated from the High Low Close of the previous TF Week's price.
What are Camarilla Pivot Points?
1.Camarilla Pivot Points is a modified version of the classic Pivot Point. 2.Camarilla Pivot Points was launched in 1989 by Nick Scott, a successful bond trader. 3.The basic idea behind Camarilla Pivot Points is that price tends to revert to its mean until it doesn't. 4.Camarilla Pivot Points is a mathematical
FREE

Alert Indicator for exponential moving average cross blue arrow for buy alert , fast ema 14 crosses above 50 pink arrow for sell alert , fast ema 14 crosses below 50 Default 14 ema fast & 50 ema slow add these indicators to chart Full Alerts , push, email, phone inputs for moving average lengths and alarm on off settings Please contact for help of an indicator alert suggestion
FREE

McS Super Trend -This is one of the most popular classic trend indicators. It has a simple setting, allows you to work not only with the trend, but also displays the stop loss level, which is calculated by this indicator. Benefits:
Instruments: Currency pairs , stocks, commodities, indices, cryptocurrencies. Timeframe: М15 and higher. Trading time: Around the clock. Shows the direction of the current trend. Calculates the stop loss. It can be used when working with trading. Three types of n
FREE

Key Features: Robust Algorithm: Based on John F. Ehlers’ renowned Fisher Transform formula, our indicator excels in pinpointing major price shifts, facilitating more informed trading decisions. Versatile Application: Works seamlessly with any asset, including forex, stocks, commodities, and indices, offering wide-ranging applicability for diverse trading strategies. Customizable Settings: Tailor the indicator to your trading style with adjustable parameters, including the transformation length,
FREE

All about time and price by ICT. This indicator provides a comprehensive view of ICT killzones, Silver Bullet times, and ICT Macros, enhancing your trading experience. In those time windows price either seeks liquidity or imbalances and you often find the most energetic price moves and turning points. Features: Automatic Adaptation: The ICT killzones intelligently adapt to the specific chart you are using. For Forex charts, it follows the ICT Forex times: In EST timezone: Session: Asia: 20h00-0
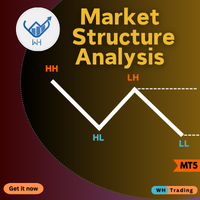
Are you tired of missing crucial market movements? Do you wish for a tool that not only identifies swing points but also provides insights into price action movements?
Look no further – our Market Structure Analysis indicator is here to revolutionize the way you analyze markets on MQL5! MT4 Version : WH Market Structure Analysis MT4 Key Features:
Swing Point Detection: Our indicator excels at identifying significant swing points in the market, helping you understand key turning points with
MetaTrader市场是独有的自动交易和技术指标商店。
阅读MQL5.community用户备忘更多地了解我们提供给交易者的独特的服务:复制交易信号,自由职业者开发的自定义应用程序,通过支付系统完成的自动付款和MQL5云网络。
您错过了交易机会:
- 免费交易应用程序
- 8,000+信号可供复制
- 探索金融市场的经济新闻
注册
登录