 MetaTrader 5
 专家
专家
 指标
指标
 程序库
程序库
 实用工具
实用工具
 窗口小部件
窗口小部件
 规则
规则
适用于MetaTrader 5的新技术指标 - 159
 技术指标的信号外汇和股票市场的开仓交易和平仓交易起着至关重要的作用。指标的本质就是一种交易品种的数学转换,旨在预测未来的价格变化。
测试技术指标可以更有利于预测市场行为并从中获利。
技术指标的信号外汇和股票市场的开仓交易和平仓交易起着至关重要的作用。指标的本质就是一种交易品种的数学转换,旨在预测未来的价格变化。
测试技术指标可以更有利于预测市场行为并从中获利。 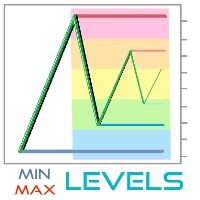
MinMax Levels – 是重要交易時段(日、週和月)的最高、最低和開盤價格水準的指標。
每個外匯市場參與者都在其交易系統中使用等級。 它們可以是進行交易的主要訊號,也可以是作為分析工具的附加訊號。 在該指標中,選擇日、週和月作為重要時段,因為它們是大型市場參與者的關鍵交易時段。 如您所知,價格從一個水平移動到另一個水平,了解相對於重要水平的價格位置有助於做出交易決策。 為了方便起見,新增了按鈕來啟用和停用這兩個等級本身,並折疊按鈕以釋放價格圖表工作視窗中的空間。
每個外匯市場參與者都在其交易系統中使用等級。 它們可以是進行交易的主要訊號,也可以是作為分析工具的附加訊號。 在該指標中,選擇日、週和月作為重要時段,因為它們是大型市場參與者的關鍵交易時段。 如您所知,價格從一個水平移動到另一個水平,了解相對於重要水平的價格位置有助於做出交易決策。 為了方便起見,新增了按鈕來啟用和停用這兩個等級本身,並折疊按鈕以釋放價格圖表工作視窗中的空間。
此指標的優點: 方便 能見度 資訊內容 最新等級 可自訂的級別 此指標很方便,因為您在工作時無需切換到不同的時間範圍。

If you need an indicator that shows market entry points, then this is your indicator.
The indicator is not redrawn. Shows buy and sell points for any TF (time frame) and any currency pair. Settings are adjustable for all instruments. You can configure each parameter for any broker, for any account.
This is a PILLOW that is comfortable :)) Just check it out.....
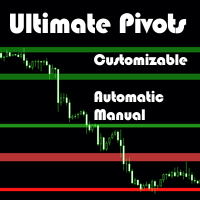
### 介绍 MetaTrader 5 的终极枢轴点水平指标
Ultimate_Pivot_Levels 是一种多功能工具,旨在通过准确绘制枢轴点水平来增强您的交易体验。它允许您手动输入所需的值或使用众所周知的枢轴点计算方法来创建枢轴点水平。它在背景中绘制这些水平,并允许您自定义水平、区域的大小和颜色,同时在每个新柱状图中保持您的调整。无论您是新手交易者还是经验丰富的专业人士,此指标都能为您提供灵活性和精确度,使您能够做出明智的交易决策。
### 主要特点
1. **多种枢轴点计算方法**:Ultimate_Pivot_Levels 指标支持多种枢轴点计算方法,允许您选择最适合您的交易策略的方法:
- **手动值**:输入您的自定义枢轴点水平,或从所需的频道或网站复制粘贴。
- **标准方法**:基于前一周期的高、低和收盘价格的经典枢轴点计算方法。
- **Camarilla 方法**:以其独特公式而闻名的流行方法。
- **Woodie 方法**:一种变体,更多地考虑了收盘价。
- **DeMark 方法**:由 Tom DeMark 开
FREE
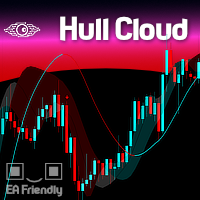
The Hull Moving Average is known for its ability to reduce lag and provide a clearer, more accurate depiction of market trends. By smoothing price data more effectively than traditional moving averages, it helps traders identify trend directions and reversals with greater precision. The Hull Cloud indicator elevates this by using four Hull Moving Averages working together like an orchestra. This combination creates a dynamic system that highlights short, medium, and long-term trends, giving trad
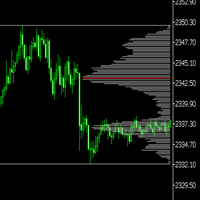
成交量在交易中扮演着至关重要的角色,它是衡量市场活跃度和投资者情绪的关键指标。以下是成交量对交易的几个重要作用: 确认趋势 :道氏理论强调了成交量在确定市场趋势中的重要性。较大的成交量通常表明市场多空双方的分歧较大,而较小的成交量则可能意味着市场对当前价格的认同度较高。 捕捉主力动作 :通过一段时间的成交量分析,可以捕捉到主力资金的动向。一天的成交量可能会被操纵,但长期的成交量更能真实反映市场主力的行为。 预测价格变动 :成交量的变化往往先于价格变动。例如,价格上涨时伴随着成交量的增加,可能预示着后市将继续上涨;相反,如果价格上涨但成交量减少,则可能意味着上涨动力不足。 衡量市场活跃度 :成交量的大小可以直接反映市场的活跃程度。高成交量表明市场活跃,低成交量则可能意味着市场冷淡。 供需关系的体现 :成交量是市场供需关系的直接表现。供不应求时,成交量会放大;供过于求时,成交量会萎缩。 辅助技术分析 :在技术分析中,成交量与价格、时间和空间一起构成了分析的四大要素。成交量的分析可以帮助投资者更准确地判断市场趋势和转折点。 决策依据 :有经验的投资者会将成交量作为进出市场的依据之一。例如,带
Apresentamos o Indicador de novo grafico - uma ferramenta poderosa para traders que buscam uma análise de preço suave e clara. Este indicador inovador calcula a média simples dos preços, oferecendo uma visão precisa e ajustada dos movimentos do mercado. Como Funciona : O Indicador de Média de Preços Simples (SMA) utiliza uma fórmula simples e eficaz: Ele soma o valor do último preço com o preço anterior. Em seguida, divide essa soma por 2 para obter a média. Fórmula : SMA = U ˊ ltimo Pre c ¸ o +
FREE
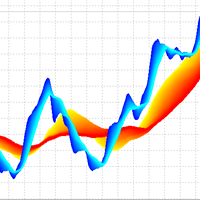
3D Trend Indicator is a non-repaint indicator using multiple moving averages with a 3D surface view. By using this indicator, you can remove uncertainties that can happen using a single and fixed moving average period. You can use a cloud area using a range of moving average periods. Also a wide range of visual settings are added to this indicator to have a better view from the cloud area. Alert and notification system added to the indicator to inform the trader about the action of candles on t

This indicator displays the remaining time of the current candle, providing a visual representation of the time left until the candle closes and a new one begins, helping traders to make more informed decisions and stay on top of market fluctuations with precise timing, enhancing their overall trading experience and strategy execution, and allowing them to optimize their trades and maximize their profits.
FREE

TMA CG FAST MT4 REPLICADO PARA MT5 Cuenta con todas las caracteristicas del original con la funcion adicional de tener señal al fallo que consiste en que despues de una cantidad de velas establecida por el usuario emita una preseñal para una potencial entrada tiene alerta sonora para la posible entrada y la entrada definitiva tiene la posibilidad de repintar o no , queda a eleccion de usuario

Introduction
The "Smart Money Concept" transcends the realm of mere technical trading strategies to embody a comprehensive philosophy on the dynamics of market operations. It posits that key market participants engage in price manipulation, thereby complicating the trading landscape for smaller, retail traders.
Under this doctrine, retail traders are advised to tailor their strategies in alignment with the maneuvers of "Smart Money" - essentially, the capital operated by market makers.
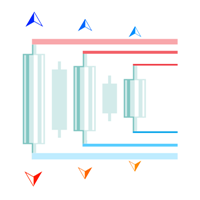
MultiFractal Levels MultiFractal Levels – 這是經過修改的 Bill Williams 分形指標,增加了等級。 分形是根據設定中允許的所有 TF 建構的。
水平僅基於尚未經過價格測試的最新分形構建。 與原廠終端指示器相比的優點: 方便 能見度 資訊性 最新等級 可自訂的分形 可自訂的級別 此指標很方便,因為您在工作時無需切換到不同的時間範圍。
可見度 - 在一張圖表中,您可以看到從小到中、大市場走勢的圖表結構。
資訊內容-從視覺上我們獲得更多有關圖形的資訊。
自訂分形可以從兩側進行更改:可以在設定中指定左側和右側的條形數量。
可變更可自訂的水平:根據極值繪製,或根據訊號陰影(中央蠟燭)繪製為區域。 因此,如果舊 TF 的分形具有較大的陰影,則當前 TF 上的符號將很大。
現在,所有基於或基於多重分形指標的交易策略都將具有附加訊號。 此外,分形可以充當支撐位和阻力位。 並且在一些交易策略中,顯示流動性水準。 為此,引入了層次。
使用多重分形水平指標作為您交易系統的補充
也試試我在市面上的其他產品 https://www.mql5.c

順應潮流。是的,在 15 分鐘的框架上等待進場信號,無論是買入還是賣出,並檢查信號是否出現在 30 分鐘的框架上(有時信號需要一個小時或更長時間才會出現。您可以返回到15分鐘框架並返回到30分鐘框架,重複此操作,直到主要訊號出現在您面前。被記錄,或當相反的訊號出現時它非常簡單並且適用於所有主要貨幣。 金屬、指標和所有框架,但最好的結果是 30 分鐘框架。
始終將止損設置在蠟燭底部下方,資金管理不得超過 資本的10% 順應潮流。是的,在 15 分鐘的框架上等待進場信號,無論是買入還是賣出,並檢查信號是否出現在 30 分鐘的框架上(有時信號需要一個小時或更長時間才會出現。您可以返回到15分鐘框架並返回到30分鐘框架,重複此操作,直到主要訊號出現在您面前。被記錄,或當相反的訊號出現時它非常簡單並且適用於所有主要貨幣。 金屬、指標和所有框架,但最好的結果是 30 分鐘框架。
始終將止損設置在蠟燭底部下方,資金管理不得超過 資本的10%
順應潮流。是的,在 15 分鐘的框架上等待進場信號,無論是買入還是賣出,並檢查信號是否出現在 30 分鐘的框架上(有時信號需要一個小時或更長時間才會

- Real price is 80$ - 40% Discount (It is 49$ now) Contact me for instruction, any questions! - Non-repaint - I just sell my products in Elif Kaya Profile, any other websites are stolen old versions, So no any new updates or support. - Lifetime update free Related product: Bitcoin Expert Introduction The Breakout and Retest strategy is traded support and resistance levels. it involves price breaking through a previous level. The break and retest strategy is designed to help traders do two ma
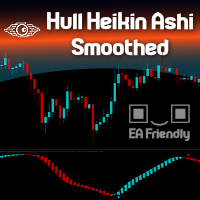
Heikin Ashi candlesticks are a powerful tool for traders, offering a clear and smooth visualization of market trends. Unlike traditional candlesticks, they filter out market noise, providing a cleaner view of the market's direction and strength, which helps traders make more informed decisions. The Hull Heikin Ashi Smoothed indicator from Minions Labs takes this a step further by integrating the Hull Moving Average for enhanced smoothing and precision. This indicator not only simplifies trend id
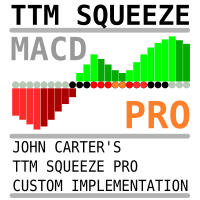
This is actually just a combination of 3 classic TTM_Squeeze indicators, nothing special. As I know exactly this is implemented in original TTM_Squeeze PRO indicator. It shows strong, middle and weak squeeze. If someone interested, TTM_Squeeze is not completely John Carter's invention. Concept of squeeze is commonly known as well as the method of squeeze search using Bollinger Bands and Kelthner Channels. How to use
As always there is a lot of variations. For example here is simple strategy Use

The indicator determines the ATR value (points) in a classic way (taking into calculation paranormal bars/candles) and more correctly - ignoring paranormal movements of the Instrument. Correctly it is excluding paranormal bars from the calculation, extremely small bars (less than 5%( customizable ) of the standard ATR) and extremely large bars (more than 150% ( customizable ) of the standard ATR) are ignored. This is a Extended version - allows you to set calculation parameters a

Overview
In the evolving landscape of trading and investment, the demand for sophisticated and reliable tools is ever-growing. The AI Trend Navigator is an indicator designed to meet this demand, providing valuable insights into market trends and potential future price movements. The AI Trend Navigator indicator is designed to predict market trends using the k-Nearest Neighbors (KNN) classifier.
By intelligently analyzing recent price actions and emphasizing similar values, it helps t
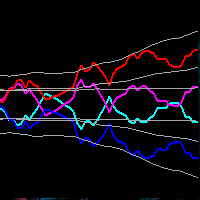
This indicator obeys the popular maxim that: "THE TREND IS YOUR FRIEND" Channel indicators incorporate volatility to capture price action. The Bollinger Bands is widely used, however, there are other options to capture swing action opportunities. Each study you will find here is unique, and reveals different types of price action.
https://www.mql5.com/en/market/product/116256
https://www.mql5.com/en/market/product/115553
FREE
The Boom300 Spike Indicator is a powerful tool designed to identify significant price spikes in the market.
Key Features: Real-time Spike Detection: The indicator continuously scans the market for sudden spikes in price action, providing timely alerts when significant spikes occur. And recommend to use the 1Min chart Customizable Alerts: Traders can customize alerts to suit their preferences, including audible alerts, email notifications, and push notifications to mobile devices. User-Friendly

Description: The Spike Sniper Crash Market Indicator is a sophisticated tool designed to identify and navigate volatile market conditions, often associated with sudden price spikes and market crashes. Leveraging advanced algorithms and technical analysis, this indicator serves as a vigilant guardian, alerting traders to potential market disruptions and providing actionable insights to mitigate risks and capitalize on opportunities. Key Features: Precision Spike Detection: The indicator employs c
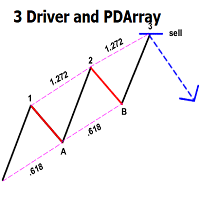
This indicator automatically identifies the SMC 3-Drive pattern and sends notifications to users when the pattern is detected. Additionally, the indicator identifies PDArray (including FVG and OB) and offers an option to combine the 3-Drive pattern with PDArray. This combination provides users with more reliable signals. What is the 3-Drive Pattern? This pattern is formed by three price pushes in one direction, providing a strong reversal signal (Figure 3). The key to identifying this pattern is

Introducing our state-of-the-art Wave Indicator, meticulously designed for the discerning traders of the MQL5 community! At the core of this innovative tool lies an unmatched sensitivity to capture even the slightest market movements. Our Wave Indicator serves as the foundational element for constructing comprehensive trading strategies, providing you with an unwavering edge in the dynamic world of finance. Whether you're aiming to refine short-term tactics or develop long-term systems, this ind
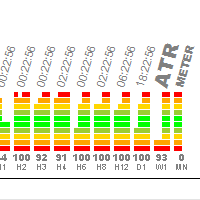
该指标旨在快速确定仪器的波动性。 改变图表是非常方便的,以立即了解哪些工具和时间段有一个活跃的交易,以及哪里有一个平静。 该指标使用转换成百分比的ATR指标的数据。 如果您将ATR放在图表上,大约100-300条将在屏幕上可见,我将此值平均并默认设置为150(您可以自行决定在设置中更改它)。 操作原理:我们取150个ATR值,找到最大和最小,它们之间的距离是100%,基于此我们计算当前位置的百分比。 指标的每一列对应于它自己的时间段,分为4段(3、2、1、0是当前的柱)。 这样做是为了说明ATR指标的行为。
设置: 1)"警报如果信号"组
如果指标超过50%,将显示一个包含工具描述和周期的窗口。
使用警报1TF如果信号-是否使用信号通知
信号时间段1-信号搜索时间段
到目前为止,已经完成了5个时间段。.. (如有必要,您可以添加)
2)ATR设置
ATR周期=14-默认
历史条返回-使用多少条来计算100%百分比
3)查看和警报系统信息-显示有关指示器操作的系统信息
使用建议:
为了实现指标的最佳和快速操作,您应该减少图表上显示的柱线数量:
在MetaTrad

Introduction
"Smart money" is money invested by knowledgeable individuals at the right time, and this investment can yield the highest returns.
The concept we focus on in this indicator is whether the market is in an uptrend or downtrend. The market briefly takes a weak and reversal trend with "Minor BoS" without being able to break the major pivot.
In the next step, it returns to its main trend with a strong bullish move and continues its trend with a "Major BoS". The "order block" beh

当然可以!以下是您提供的文本的中文翻译: 引入 MT4 / MT5 天文指标:您的终极天体交易伙伴 您准备好将交易体验提升到天文高度了吗?不用再寻找,就在我们的革命性 MT4 天文指标中。这个创新工具超越了传统的交易指标,利用复杂的算法提供无与伦比的天文洞察力和精确计算。 指尖上的宇宙信息: 瞻仰一个详尽的面板,展示了一宝藏般的天文数据。了解行星的地理/太阳心坐标,太阳/地球距离,亮度,伸长度,星座,黄道和赤道坐标,甚至是水平坐标——每个细节都经过精心计算并呈现得美轮美奂。指标生成的垂直线对应于时间值,为您的交易旅程提供了宇宙的视角。 行星线条与关系: 在您的图表上欣赏行星线条的魔力,具有可自定义的比例和角度。通过直观的控制面板轻松切换每个行星线条的可见性。通过连结、六分、四分、三分、对冲和逆行等指标,发现行星关系的艺术。在您选择的时间范围内探索这些宇宙构造,使您能够识别重要的交易机会。 揭示甘恩的智慧: 通过受甘恩启发的平方垂直线揭示潜在的反转时机。这种创新修改将甘恩历经考验的原则带入现实,帮助您提前了解市场的转向和趋势。 月亮引导: 在您的图表上优雅地导航月相,
具有多时间框架支持、可自定义视觉信号和高度可配置警报系统的交易者动态指数(TDI)指标。
免费编程服务、更新及其他 TrueTL 产品请访问 MQL5 个人主页 。
非常感谢您的反馈和评价!
什么是 TDI? 交易者动态指数(TDI)是由 Dean Malone 开发的复合指标,将 RSI、应用于 RSI 的布林带以及 RSI 的两条移动平均线组合在单一显示中。它提供了市场动态的全面视角,包括动量、波动性和趋势方向。 该指标由五条线组成:RSI 价格线(原始 RSI)、交易信号线(RSI 的快速 MA)、RSI 信号线(RSI 的慢速 MA,也是波动率带的中线)、以及波动率带高点和低点(应用于 RSI 的布林带)。 功能特点: 五条独立样式的线:RSI 价格、交易信号、RSI 信号、VB 高点、VB 低点 带箭头标记和垂直线的视觉信号标记 具有可配置触发条件的三个独立信号缓冲区 信号检测选项:方向变化、水平线穿越、峰值/谷值 每个信号可配置警报功能(邮件、推送、声音、弹窗) 支持插值方法的多时间框架(MTF)功能 多种颜色模式(简单、方向型、水平线型) 支持 Expert Adv
FREE

Ultra-fast recognition of parabolic channels (as well as linear, horizontal and wavy channels) throughout the depth of history, creating a hierarchy of channels. Required setting: Max bars in chart: Unlimited This indicator is designed primarily for algorithmic trading, but can also be used for manual trading. This indicator will have a very active evolution in the near future and detailed descriptions on how to apply to create robots
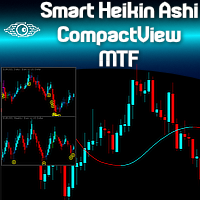
Are you already a fan of the Minions Labs Smart Heikin Ashi chart analysis tool? Or perhaps you're looking for a versatile Heikin Ashi chart capable of operating across multiple timeframes? Want to see the bigger picture before diving into the details, to make smarter ENTRY decisions? Do you want to build your own Dashboard of Symbols in just one chart, without dealing with messy multi-window MT5 stuff? Welcome to the Minions Labs Smart Heikin Ashi CompactView MTF indicator! Please see the power

Certainly! Let me introduce you to a powerful tool for MetaTrader 5 (MT5) that can automatically identify and draw support and resistance (S&R) levels on your trading charts. This tool is called the “Support and Resistance Levels Guru” . Support Resistance Levels Guru The Support & Resistance Indicator automatically displays essential S&R levels on your chart. These levels are crucial for technical analysis and are used by many traders. Resistance levels (zones) are shown in R ed , while suppo
FREE

FOTSI is an indicator that analyzes the relative strength of currencies in major Forex pairs. It aims to anticipate corrections in currency pairs following strong trends by identifying potential entry signals through overbought and oversold target areas. Theoretical Logic of Construction: Calculation of Individual Currency Momentum: FOTSI starts by calculating the momentum for each currency pair that includes a specific currency, then aggregates by the currency of interest (EUR, USD, GBP, CHF,

The Ultimate Trend and Reversals Detector The Ultimate Trend and Reversals Detector is a powerful tool designed to identify potential trend reversal zones in the financial markets. Here are the key features: Objective : Detect trend directions and reversals. Signal Colors : Green : Indicates a potential bullish trend reversal. Red : Signals a potential bearish trend reversal. Non-Repainting : The indicator’s signals are not redrawn, providing reliable information. Suitable for All Styles : Scal

Using the Future Trend indicator, you can predict the future price movement a certain number of bars ahead. This indicator creates a line depicting simulated future price values, providing you with valuable information for making decisions about entering or exiting the market, and for setting or adjusting stop losses accompanying your position.
In addition, the Future Trend indicator has several parameters: HistoricBars - determines the number of historical bars that are used for analysis. Fut
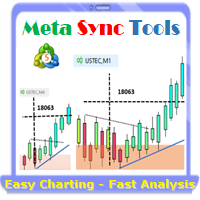
Supercharge Your MetaTrader Analysis and Trading with Meta Sync Tools! Struggling to analyze price action across different timeframes? Meta Sync Tools eliminates the frustration of unsynced crosshairs and charts, allowing seamless multi-timeframe analysis. Missing key correlations between assets and constantly switching between charts? Meta Sync Tools empowers you to visualize relationships between instruments effortlessly. Tired of wasting time on repetitive tasks? With 30+ Customizable Short

Introduction
The "Smart Money Concept" transcends mere technical trading strategies; it embodies a comprehensive philosophy elucidating market dynamics. Central to this concept is the acknowledgment that influential market participants manipulate price actions, presenting challenges for retail traders.
As a "retail trader", aligning your strategy with the behavior of "Smart Money," primarily market makers, is paramount. Understanding their trading patterns, which revolve around supply, de

PMax is a brand new indicator developed by KivancOzbilgic in earlier 2020.
It's a combination of two trailing stop loss indicators;
One is Anıl Özekşi's MOST (Moving Stop Loss) Indicator and the other one is well known ATR based SuperTrend. Both MOST and SuperTrend Indicators are very good at trend following systems but conversely their performance is not bright in sideways market conditions like most of the other indicators.
Profit Maximizer - PMax tries to solve this problem. PMax combi
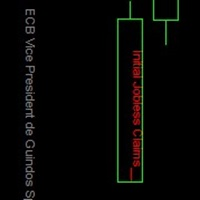
This is one of the most powerful indicators I've ever made.
I was tired of looking at other windows/websites for economical news, and regularly something would happen without me realising.
So I made this indicator which displays all news at the exact time of arrival, directly on the charts!
Now you too can just focus on the charts and know that you won't miss any news events.
There are options:
1. You can choose to display on the price line, or at the bottom of the chart. 2. You can choose t
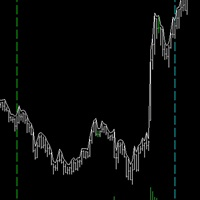
This is one of my most important indicators. Did you ever miss the session open/close? I did, which is why I made this indicator. It took a long time to get this right, since depending on your platform and timezone, it can be incorrect. It should be accurate for everyone now. It takes into account Daylight savings for NY and EU timezones, and should just work like magic on your charts.
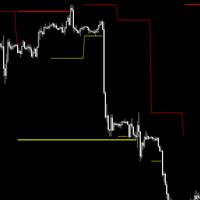
## Check screenshots to see proof that this indictor is a must! ##
Do you hate having to have a Monthly, Weekly, Daily chart when looking at your lower timeframes? I hated it too, so I made this. It will show you the High and Low of other timeframes on your chart, so you will always be aware where some support/resistance may be! Even on the 1 minute chart!
I recommend you use it 3 times, one with Day, Week and Month selected with different line widths.
I use this on every chart I look at. Yo

The Fat and Slim indicator tracks strong and weak money in the market. It is derived from RSI, MFI and many similar indicators. Input values are closing prices and volumes. The RSI (yellow curve) is in the range -100 ... 100. It is additionally multiplied by a coefficient so that the curve is not compressed to the middle values at higher periods (a problem with the classic RSI with different periods). Strong/Fat red curve is RSI weighted by higher volumes. Weak/Slim blue curve is calculated so t
With this indicator TheStrat bar numbers can be displayed above and below candles of the chart. The numbers have the following meaning: 1 = Inside Bar 2 = Directional Bar 3 = Outside Bar. In TheStrat-method there are Actionable and In-Force patterns / combos to define entries for trades. These patterns are also displayed by the indicator.
Here are the settings that can be configured: Number of lookbar bars : For how many candles in the past numbers are dislayed Color of inside bar : The color o

THis indicator is a typical trend following indicator. ION BOT is based on the price position and its trail stop. When the price is above its trail stop the indicator is in an uptrend, and therefore the candles are coloured green, signalling the beginning of a trend with a green arrow.
Here are some of its key functionalities: Trend Analysis: The UT Bot Alert Indicator uses advanced algorithms to analyze market trends and identify key support and resistance levels. This information can help tra
您想在外汇市场取得成功吗? 我们创新的 AI Swing Trading 指标是您交易成功并盈利的秘密钥匙。 我们向您展示这个独特的工具:
我们的指标配备了内置神经网络,可让您分析大量数据、识别变化并预测价格走势。 该技术使您能够根据深入的市场分析做出明智的交易决策。 该指标算法基于:斐波那契水平、价格行为和交易量。 这使您可以根据数学模式确定潜在的进入点和市场进入点。 应在 M30 时间范围内对 EURUSD 货币对使用 AI 波段交易! AI Swing Trading 指标不会停滞不前。 在工作过程中,不断优化自身,适应不断变化的市场情况。 这意味着即使市场发生变化,您也将始终领先一步。
AI Swing Trading 不仅分析当前走势,还分析外汇市场的全球趋势。 这使您可以了解发生了什么并做出明智的决定。
该指标是从2009年开始的多年交易经验的成果。它是由交易者为交易者开发的,考虑到了外汇交易的各个方面。
不用担心错误信号。 AI Swing Trading 不会重绘,这意味着您看到的信号保持不变,您可以依靠它们做出已知的交易决策。
我们的指标的设计
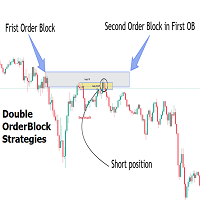
Introduction
The Price Action, styled as the "Smart Money Concept" or "SMC," was introduced by Mr. David J. Crouch in 2000 and is one of the most modern technical styles in the financial world. In financial markets, Smart Money refers to capital controlled by major market players (central banks, funds, etc.), and these traders can accurately predict market trends and achieve the highest profits.
In the "Smart Money" style, various types of "order blocks" can be traded. This indicator uses
RSI Pro 分析器指标是一款功能强大的工具,专为希望在多个时间范围内同时做出明智决策的交易者而设计。 该指标利用 RSI 提供超买、超卖和趋势信号,更容易识别入市机会。 它的主要优点是易于阅读, 因为它具有清晰而独特的颜色代码来指示不同的市场状况。
该指标显示五个不同时间范围(D、H4、H1、M30、M15) 的 RSI 值和相关信号,使交易者能够获得全面的市场视角并在多个时间范围内做出明智的决策。
使用颜色变化来识别不同时间范围内的趋势和潜在逆转。 寻找超买和超卖区域,以发现反趋势或趋势逆转的交易机会。
红色: RSI 指示下降趋势。
绿色 :RSI 指示上升趋势。
深红色 :RSI 表示超卖区域。
深绿色 :RSI 发出超买区域信号。
您还可以通过弹出、电子邮件和推送通知发送的精确警报来通知购买和销售条目。
RSI Pro 分析器指标是交易者决策过程中的补充工具。 建议将其与其他指标和分析结合使用,以了解市场概况。
MT4版本。
输入参数:
RSI period: 14(默认),可根据您的喜好调整。
Enable/disable alert: 启用或禁
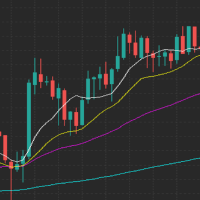
帶輸入訊號平均濾波器的趨勢追蹤指示器
此指標充當趨勢追蹤器和過濾器,使用移動平均線作為入場訊號。 移動平均線是確定不同趨勢範圍的關鍵:
- 標準 200 週期主要平均值顯示長期趨勢。 - 50 週期二級平均線指示中期趨勢。 - 20 週期第三平均值表示最短趨勢。 - 九個週期的平均值可作為立即採取行動的入場觸發因素。
此指標對於交易者來說是一個有價值的工具,它可以提供準確、全面的市場趨勢分析,並根據精心選擇的移動平均線來確定及時的入場點。
使用帶有入場訊號平均過濾器的趨勢追蹤指標增強您的交易策略並做出更明智的決策。 立即下載並提高您的交易結果 _____________________________________________________________________________________________________________________
FREE
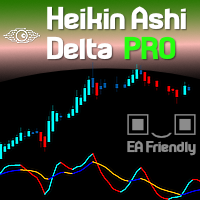
The Heikin Ashi Delta Pro leverages the refined elegance of Heikin Ashi candlesticks, renowned for their ability to filter market noise and highlight clearer trends and reversals. Building on a solid foundation, this advanced indicator integrates the Hull Moving Average method, enhancing its precision and responsiveness. Alongside an intuitive alert system, it transforms raw market data into actionable trading insights, empowering traders to make more informed decisions swiftly. Learn more about

The TimeCycleCaptor indicator is an innovative tool for accurately visualizing the market trend and generating buy and sell signals.
The market trend plays a key role in making trading decisions, and our indicator provides a reliable tool for determining it. We have made traders' dream of non-lagging moving averages come true in our indicator.
TimeCycleCaptor is capable of predicting future values and is designed to both identify the underlying trend and identify short-term buy or sell sign

In the trading world, there is no universal indicator that always provides exceptionally profitable signals regardless of market conditions. Despite your persistence, such a tool simply does not exist. However, with the Trend Master Arrow indicator you will have a reliable assistant in creating your own trading system.
Although following arrow signals requires caution and additional filters, the Trend Master Arrow indicator provides valuable information for identifying possible reversals or si

Do you want to know how an economic event will impact price? What will happen to price after the news? How has an economic news affected price in the past? This indicator can help you with that.
Do you like technical analysis? Do you enjoy studying the tick history to predict the future? But what do you think could be more important than technical analysis, what could improve technical analysis? Of course, it's fundamental analysis! After all, economic events directly impact the market, and th

Introducing the “Symbol Cost Info MT5” indicator – your ultimate tool for staying ahead in the forex market! This innovative indicator is designed to empower traders with real-time cost information, directly on their charts. Here’s why every trader needs the “Symbol Cost Info MT5” in their arsenal: Real-Time Spread Monitoring : Keep a close eye on the spread for any currency pair, ensuring you enter the market at the most cost-effective times. Pip Value at Your Fingertips : Instantly know the v
FREE

The Market Might indicator, despite its apparent simplicity, is based on complex analytical algorithms that allow you to accurately determine the moments of entry and exit from transactions. The signals generated by this indicator are accurate and timely, appearing directly on the current candle.
The main task of the Market Might indicator is to determine the moments of entry and exit from trades. Therefore, it displays only the trend line and entry points, which provides a clear view of the m
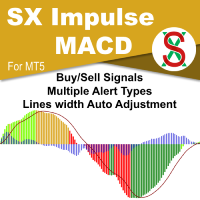
MACD is probably one of the most popular technical indicators out there. When the market is trending, it actually does a pretty good job, but when the market starts consolidating and moving sideways, the MACD performs not so well. SX Impulse MACD for MT4 is available here . Impulse MACD is a modified version of MACD that works very well for trading Forex, stocks, and cryptocurrencies. It has its own unique feature which perfectly filters out the values in a moving average range and enables it
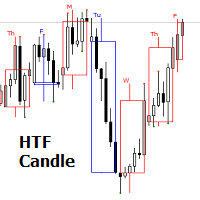
The indicator show Higher timeframe candles for ICT technical analisys Higher time frames reduce the 'noise' inherent in lower time frames, providing a clearer, more accurate picture of the market's movements.
By examining higher time frames, you can better identify trends, reversals, and key areas of support and resistance.
The Higher Time Frame Candles indicator overlays higher time frame data directly onto your current chart.
You can easily specify the higher time frame candles you'd li

受到2016年(05月份)ICT私人辅导课程在YouTube上的启发,我们的创新工具赋予交易者精准驾驭市场的能力。通过标记60、40和20天的周期,它有助于识别重要的市场变动,借鉴了ICT传授的智慧。 这个指标真正与众不同的地方在于它的前瞻能力,这一特点基于对历史数据的深入分析,提供宝贵的未来市场行为洞察。这种前瞻性方法赋予交易者做出明智决策所需的远见,为他们在当今充满活力的交易环境中提供了独特的优势。 此外,我们的指标提供了定制选项,允许交易者根据自己的特定偏好和交易策略进行调整。凭借这种高度的适应性,交易者可以自信地预测市场趋势,利用ICT的教导保持领先地位,并抓住有利可图的机会。 体验我们的指标的前瞻性和定制化能力,开始一段旅程,提升您的交易技能,实现您的财务目标
FREE

基本主题构建器:简化您的图表自定义 通过 基本主题构建器 指标,彻底改变您的交易体验。这款多功能工具旨在简化您在MetaTrader 5 平台上自定义图表外观的过程。该指标提供了一个用户友好的面板,您可以轻松切换不同的主题和配色方案,提升交易环境的视觉吸引力和功能性。 Free MT4 version 基本主题构建器 指标是那些希望轻松个性化MetaTrader 5图表的交易者的终极工具。通过其简单的面板界面和各种主题预设,您可以迅速调整图表的外观,以匹配您的交易风格或心情。无论您偏爱经典外观还是现代美学,基本主题构建器提供了一系列选项,以增强您的视觉体验并提高专注度。立即优化您的交易设置,体验这款实用且易于使用的指标。
主要特点: 轻松管理主题: 使用便捷的面板界面,单击即可快速更改图表主题。 预定义预设: 从几种预配置的主题和配色方案中进行选择,包括经典、深色、浅色等,以适应您的交易偏好。 可自定义选项: 调整颜色和样式,按您的喜好定制图表外观。 用户友好界面: 享受简单直观的设计,无需复杂设置或配置。 提升交易专注度: 通过视觉吸引力强且无干扰的图表环境,改善您的交易体验。
FREE
该指标能在ATR超过设定值或出现显著百分比波动时发出警报,精准捕捉波动率异动。特别适用于: 波动率交易系统 Recovery Zone或Grid Hedge对冲系统 作为波动率策略的核心工具,本指标直接在图表标注:
入场区域
加仓点位
止盈水平
助您快速回测任意品种,定制专属参数组合 核心优势
参数/颜色全自定义
时段过滤器(仅接收指定时段信号)
智能绘制Hedge Zones(含入场/补仓/复苏区/止盈位)
单信号分析功能(统计价格在Recovery Zone线的反弹次数)
可开关的桌面弹窗/APP推送提醒
一键转换Expert Advisor(提供完整技术支持)
点击下载最佳参数模板
使用策略
核心价值在于识别ATR值的剧烈波动。为何关键?当市场横盘时:
难以获得理想风险回报比
多数交易系统会失效 两大应用场景:
A) 作为现有波动率策略的辅助过滤器 B) 用于Grid Hedge系统: 当ATR激增信号出现时立即建仓 完美规避网格策略在盘整市的致命缺陷
( 详细了解Recovery Zone/Grid Hedge系统 ) 参数配置
基础设置: ATR周期 模式选择(固定阈值/百
MACD Multicurrency Scanner MT5 是一个先进的交易指标,旨在使用移动平均收敛发散 (MACD) 策略分析多个货币对。这个工具非常适合希望通过识别各种时间框架中的潜在买卖信号来优化交易表现的交易者。 凭借其用户友好的界面,MACD Multicurrency Scanner MT5 使交易者能够做出明智的决策。通过提供实时警报和视觉信号,它增强了交易过程,使在快速变化的 forex 市场中捕捉机会变得更加容易。 MQL产品安装指南 | 在 MT4/MT5 上更新已购买的MQL产品 | 常见故障排除指南 | 指标设置 / 指南 主要特点 缓冲区集成:将指标值暴露为可访问的缓冲区,使其可被 Expert Advisor 用于自动交易策略。 视觉箭头信号:在信号蜡烛上直接在图表上显示清晰的买入/卖出箭头,便于快速识别交易机会。 快速且可回测:基于 MetaTrader 的本地 OnCalculate() 引擎构建,确保快速执行并与策略测试器兼容,以进行历史表现分析。 弹出警报:在信号事件上触发 MetaTrader 警报弹出窗口,确保您不会错过关键的交易机会。 推送
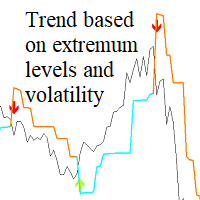
Trend based on Extremum Levels and Volatility (基于极端和波动性的趋势1)指标是一个方便的工具,旨在帮助交易者在不同的时间框架上识别趋势突破点和潜在的获利水平。
该指标可用于外汇、期货、股票、指数、商品和加密货币市场。
该通用指标根据局部极值、波动率和平均价格偏差构建趋势,提供可用于小时间框架和大时间框架的有价值信息。
Trend based on Extremum Levels and Volatility 指标的显著特点是能够考虑到独立于输入参数的局部极值,这使其成为分析市场趋势的更客观、更可靠的工具。这种方法消除了将指标拟合到历史数据以显示夸大盈利能力的可能性,从而使其具有更高的价值。这确保了该指标能根据实际市场情况提供更准确、更客观的信号,而不是人为夸大指标。
基于极值和波动性的趋势指标还有一个有用的功能,允许用户使用四种不同的方法获得趋势反转的通知。
- Print
- Alert
- Notification
- Send Mail
此外,该指标还提供根据止损点和进场点计算获利水平的功能。无论您是选择市价
Commodity Channel Index(CCI) Multicurrency Scanner MT5 是一个强大的指标,专为希望通过同时监控多个货币对来增强市场分析的交易者量身定制。凭借其先进的功能,这个工具非常适合依赖商品通道指数 (forex) 来识别各种时间框架下潜在交易机会的交易者。 该扫描仪提供了市场状况的全面概述,帮助交易者根据实时信号做出明智的决策。通过利用 CCI,用户可以有效识别超买和超卖状态,优化他们在快节奏环境中的交易策略。 MQL产品安装指南 | 在 MT4/MT5 上更新已购买的MQL产品 | 常见故障排除指南 | 指标设置 / 指南 主要特点 缓冲区集成:将指标值暴露为可访问的缓冲区,使 Expert Advisor 能够有效利用基于信号的交易。 可视化箭头信号:在信号蜡烛上直接在图表上显示清晰的买入/卖出箭头,便于视觉阅读。 快速且可回测:基于 MetaTrader 的本地 OnCalculate() 引擎构建,确保快速计算并与策略测试器完全兼容,以进行历史回测。 弹出警报:在信号事件上触发 MetaTrader 警报弹出窗口,确保交易者不会错过潜
Heikin Ashi candlesticks smooth out the price data to help traders spot trends and patterns in the market. By averaging the price values, these candlesticks provide a clearer visual representation, making it easier to identify trends and predict future movements without the noise of standard candlesticks. We at Minions Labs are revisiting this topic because of our fellow Swing Traders, who love Heikin Ashi.
WHY SHOULD I CARE about the Smart Heikin Ashi? The Smart Heikin Ashi is an innovative to

SmartTrend Analyzer is a reliable non-repainting indicator that will interest any trader.
SmartTrend Analyzer is a tool that analyzes all five aspects (opening price, high, low, closing price, and volume) based on mathematical calculations. With the algorithm of the forex indicator SmartTrend Analyzer, you can quickly determine which trend is developing in the market at the moment. The SmartTrend Analyzer technical indicator is presented on the chart as a set of points for easy interpretatio

The "Trend Tandem" indicator is a trend analysis tool in financial markets that helps traders determine the direction of price movement.
Options:
RISK: Determines the level of risk taken into account in the trend analysis. The higher the value, the more aggressively volatility is taken into account. SSP (SSP Period): Defines the period of the moving average used to identify a trend. The higher the value, the smoother the trend signal will be. CountBars: Determines the number of bars on which
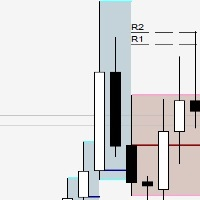
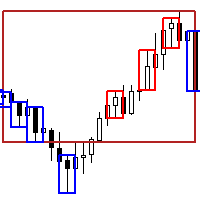
The outside bar indicator shows a range of inside bars and the breakout up and down from the range. The breakout is always displayed at the start of a new range and is extended until another breakout. The calculation always takes place at the start of a new candle. So it is displayed accordingly in all time frames. In inside bar ( insidebar ) trading you can see the top and bottom of a range.
In outside bar ( outsidebar ) trading, the breakout from a range and thus the trend following.
The col
FREE

The "Trend Orbital" indicator is a tool for tracking trends in the financial asset market. It is based on the analysis of price data and provides a visual interpretation of the current direction of price movement.
Options: InpAmplitude: Amplitude - determines the amount of volatility that the indicator takes into account when determining the trend. Group "Arrow": InpCodeUpArrow: Up Arrow Code - Defines the arrow symbol to display an uptrend. InpCodeDnArrow: Down Arrow Code - Defines the arrow

DYJ StochasticSignalSource随机振荡指标 显示为两条线。主线称为%K线。第二条线,称为%D线,是%K的移动平均线。 %K线通常显示为实线而%D线显示为虚线。有很多方法来解释随机振荡指标。其中有4种方法比较常用: 随机振荡指标(或%K或%D)降到特定水平以下(例如,20),可以买入。当随机振荡指标上升到特定水平以上(例如,80),需要卖出。 在线内区域交叉:K、D线在20以下时,%K线升到%D线以上买入。K、D线在80以上时,%K线降到%D线以下卖出。 只要交叉:%K线升到%D线以上买入。%K线降到%D线以下卖出
随机振荡指标(或%K或%D)升到特定水平以上(例如,20),可以买入。当随机振荡指标下降到特定水平以上(例如,80),需要卖出。 您能使用 DYJ Mathematical model trader 指标交易分析模型,显示指标真实交易开仓和关仓以及计算总体利润和最大浮动亏损! 此外, DYJ StochasticSignalSource随机振荡指标 还在入场点和出场点标记了彩色箭头,并且还根据这些位置实时统计总利润和最大浮亏2项判断交易概率的重要数据
该DYJ SignalSourceOfMACD软件基于MACD指标。一般而言,当 MACD 和 MACD 指标的信号线交叉时会产生信号。 如果在 MACD 开仓参考位置下方的负数区,MACD 线向上穿越信号线,则产生买进信号。 负数区是 MACD 和信号线的值小于零的区域。 MACD 开仓参考位置的参数以点数设置。但是在代码中它被转化为:MACD 开仓参考位置 * 商品的每点大小。 例如,如果您将该值设为“3”,并对 EUR/USD 应用策略,MACD 开仓参考位置将等于 0.0003(3 点 * 每点大小 0.0001)。请注意,对于买进信号,该参数被解读为一个负值。 如果在 MACD 开仓参考位置上方的正数区,MACD 线向下穿越信号线,则产生卖出信号。 正数区是 MACD 和信号线的值大于零的区域。 请使用高概率开仓参数OpenLevel($)控制开仓位置,它决定低买高卖的深度,从而有机会获得更大利润! 并且这些BUY与SELL信号被发送出去,您请下载实用工具跟单软件 DYJ follow Me 或者更好的具有博弈策略的 DYJ GameDevice 跟单软件能接收这些信号,并
DYJ SignalSourceOfRSI 是一种动量振荡器, 它通过将指定数量的周期内收盘价的升降运动进行对比,指示价格强弱 。
DYJ SignalSourceOfRSI 提供两种信号:
DYJ SignalSourceOfRSI 达到超买或超卖水平,然后出现一点反转: DYJ SignalSourceOfRSI 低于水平 (30) 时生成买入信号,RSI 高于水平 (70) 时生成卖出信号; DYJ SignalSourceOfRSI 跌破水平 (30) 然后升至水平 (30) 上方可被解释为买入信号。 DYJ SignalSourceOfRSI 上升到水平 (70) 以上然后跌破水平 (70) 可以被解释为卖出信号。 您能使用 DYJ Mathematical model trader 指标交易分析模型,显示指标真实交易开仓和关仓以及计算总体利润和最大浮动亏损! 此外, DYJ SignalSourceOfRSI 振荡器还用彩色箭头标记了入场点和出场点,并且还根据这些持仓实时统计总盈利和最大浮动亏损,这是判断交易概率的重要数据。 并且这些BUY与SELL信号被发

ENG-GOLD Scalper It is an auxiliary indicator that identifies potential targets and determines the place of entry with a stop loss that works on Heiken Ashi candles
The green lines are usually the targets, the red lines are the stop loss, and the yellow lines are the entry location.
This file is recognized on small and medium frames, usually less than the watch frame
I highly recommend using XAUUSD Nasdaq100 Dow30 USOIL
Next Arrival : Flip or Die Trading Arena. Flip a trading account: https://flipordie.com/chapter-1-thirteen-doublings-double-a-trading-account/
The Expert Advisor for this Indicator can be found here: https://www.mql5.com/en/market/product/116472 Introducing the Rejection Candle MT5 Indicator, a robust tool designed to revolutionize your trading experience on the MetaTrader 5 platform. Built to pinpoint potential reversals with precision, this indicator offers unparalleled insights into market
FREE
Este indicador de Média Móvel Personalizada permite aos traders visualizar a tendência do mercado utilizando diferentes métodos de cálculo e aplicação a várias séries de preços. O indicador é flexível e pode ser configurado para se adaptar a várias estratégias de trading, oferecendo suporte aos métodos de média móvel mais populares, incluindo Média Móvel Simples (SMA), Média Móvel Exponencial (EMA), Média Móvel Ponderada Linearmente (LWMA) e Média Móvel Suavizada (SMMA). Funcionalidades: Seleção
FREE
您知道为什么MetaTrader市场是出售交易策略和技术指标的最佳场所吗?不需要广告或软件保护,没有支付的麻烦。一切都在MetaTrader市场提供。
