适用于MetaTrader 4的EA交易和指标 - 256

Trend Flasher
Trend is your friend is the age old saying quote in trading arena, there are though many ways to gauge the trend and its direction, more scientific measure and logically meaningful will be an ATR break outs to identify and spot the trend and its acceleration, so we created this easy to use trend identification panel and optimized super trend based multi time frame panel entry system to aid and help the traders to make their trading decision.
Unique Features of Trend Flasher
1. H

Trading is based on corrective movements of the trend, positions are opened based on the strength of the trend and trading volumes.
Series of positions have a common take profit, with basis of statistics on correctional movements of a given trading instrument.
Expert Setting: Recommended Time Frame: 15M, 30M, 1H and 4H Chart Recommended Currency: EURUSD Recommended Lot: 0.1 or less for 10000 USD Lots: Defining starting lot Stop Loss: Defining stop loss by pips Take profit: Defining tak

This indicator includes: Currency Strength Meter My currency strength meter gives you a quick visual guide to which currencies are currently strong, and which ones are weak. The meter measures the strength of all forex cross pairs and applies calculations on them to determine the overall strength for each individual currency. Live Heat Map — Multiple time frame Heat Map makes it easy to spot strong and weak currencies in real-time. Get an overview of how world currencies are traded against each

DCC Trading Expert
======================================
The Robot is based on 4 Indicators to catch profitable trades. ======================================================== Watch here how to set the bot https://www.youtube.com/watch?v=2wCzTFIGNp4&feature=youtu.be This Robot is fully automated and has been created for everyone. The Robot works also on cent accounts. =============================================================================================== => works on all Time Fr

Heikin-Ashi charts , developed by Munehisa Homma in the 1700s. Munehisa Honma was a rice merchant from Sakata, Japan who traded in the Dojima Rice market in Osaka during the Tokugawa Shogunate. He is considered to be the father of the candlestick chart. Th e man who invented the use of candlestick charts for finding and profiting from chart patterns.He was a billionaire trader on those days if we compared his net-worth with todays dollar . Heikin Ashi Scanner is an Multi-Currency and Multi

El Fibonacci automatico de Grupo Bazan Inversores, permite al usuario que lo utiliza, ver desplegado de manera automatica los niveles Fibonacci de los periodos que el mismo usuario haya seleccionado.
Esto permimte que el usuario no tenga que seleccionar el Fibonacci de la plataforma de metatrader 4 para colocar manualmente la figura, pudiendose concentrar exclusivamente en su analisis u operativa.

Permite ver el horario comprendido entre la hora inicial que indique el usuario y la hora final, de esa manera, si el usuario desea ver sobre el grafico una sesion de trabajo, solo tiene que indicar la hora incial y la hora final de la sesion que desee.
Esto permite que el usuario identifique con mayor facilidad el horario que comprenda la sesion de trabajo que el usuario desee vigilar, o trabajar, o simplemente tener como referencia.

The principle of this indicator is very simple: detecting the trend with Moving Average, then monitoring the return point of graph by using the crossing of Stochastic Oscillator and finally predicting BUY and SELL signal with arrows, alerts and notifications. The parameters are fixed and automatically calculated on each time frame. Example: If you install indicator on EURUSD, timeframe M5: the indicator will detect the main trend with the Moving Average on this timeframe (for example the Moving

This utility is designed to help you with your Manual Trading. It allows different ways of closing trades. It can display total number of BUY and SELL orders individually and also their individual profits. It can enter trades without stopl loss and take profits. However upon selecting UseStopLossTakeProfit from the settings it can use best possible stop loss and take profits based on the market conditions. Upon selecting the CloseOppositeTrades from the settings it can close opposite trades. Fo
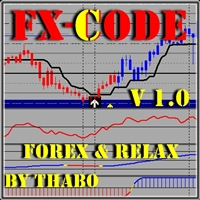
Please contact me or send me a message after you have purchased the FX-CODE This systems supports technical traders fundamental traders sentimental traders NON repaint entry with trend entry confirmations. this is a build up system so please contact me for more indicators to add THE FX-CODE V1.0 is one of the Forex & Relax Strategy systems, and it’s made to fit any kind of trader from newbie to professional. This system can suet any style of trading fundamental or technical all you have t
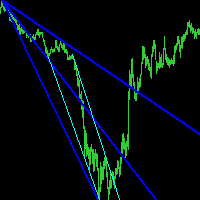
Description
Reverse Rayer Pro is an indicator that draws rays on inclined trend levels.
Recommendations
You can use this indicator to determine the trend and, accordingly, to determine the direction of opening a position or closing an opposite position.
Parameters
===== _INDICATOR_SETTINGS_ ===== - indicator settings Maximum History Bars - maximum number of history bars for calculating the indicator. Average True Range Period - ATR indicator period (used to calculate the difference bet
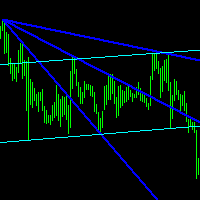
Description
Reverse Rayer is an indicator that draws rays on inclined trend levels.
Recommendations
You can use this indicator to determine the trend and, accordingly, to determine the direction of opening a position or closing an opposite position.
Parameters
===== _INDICATOR_SETTINGS_ ===== - indicator settings Maximum History Bars - maximum number of history bars for calculating the indicator. Average True Range Period - ATR indicator period (used to calculate the difference between

Indicator. "Indicator wave or Indicator Ma".
Using 23 standard indicators and the author's algorithm, the levels of purchases (from 0 to +100) and sales (from 0 to -100) are calculated.
Then, using the calculated levels, the "Wave Indicator" draws a wave with 21 moving averages.
The wave number is equal to the averaging period of the calculated levels.
Waves # 1 - 7 Fast Moving Averages
Waves from No. 8 -14 moving averages
Waves from No. 15-21 slow moving averages
Looking at the figures drawn

Use this EA to calculate your trade volume! This is a semi-automatic EA.
Abilities Calculate trade volume based on risk percent of Account Equity or Account Balance. Calculate the Take Profit based on risk/reward ratio. Break-even system. Trailing Stop system.
Parameters on Dashboard Lot Size - Trade volume. Take Profit (Points) - Take Profit in Points. Stop Loss (Points) - Stop Loss in Points. Enable Risk Percent - True/False. Option to calculate trade volume automatically by Account Equit

The principle of constructing indicator lines and their meaning . The Signal Channel indicator uses a robust filtering method based on two moving medians applicable to the High and Low prices, i.e. the lines <High> and <Low>, where <..> is the sign of linear averaging, which are shifted by certain values in an uptrend and by opposite values in a downtrend, which allows you to get a narrow channel, approximately outlining each bar. Sharp kinks of the lines of such a channel a

Kumo Breakout Indicator is a trading system based on Ichimoku Kumo levels.
Parameters
Trader can set Ichimoku parameters like: Tenkan-Sen (tk) Kijun-Sen (kj) Sekou-Span-A (ku) that are the classic parameters allowed on Ichimoku indicator on Metatrader.
Other interesting parameters: "Configure Alerts" PopUpAlert= true or false PushAlert=true or false Mail= true or false and personalized texts for eMails: TextMailUp1="WP Buy "; TextMailUp2="WP Buy write here your text"; TextMailUp3=""; TextM

Action Scanner is a market scanner. It’s yet another product in my "Can’t trade with out it" series. Do you want to know what is moving right now? Action Scanner scans your watchlist and opens the 10 currently most moving charts. You can chose between, most moving in points, most moving in your account currency(if you were to trade it with a standard lot size 1.00) and most moving in percentage. The standard version is a complete tool with no limitations. However the pro version has additiona

Profit Percent Series 2 The scanner dashboard available here (for Free) : And read detailed information about MA Confluence here: https://www.mql5.com/en/blogs/post/747474
Here's a post about Common Settings for all Profit Percent Series Indicators: https://www.mql5.com/en/blogs/post/747456
Strategy: Main Signal Indicators (Any One): MA Cross (In-built) or Hull, OBV Cross, Heiken Ashi Cross Validation Indicators (Preferably less than 3): OBV (with Min Distance), Heiken Ashi, ADX, SuperTren

Equity Protection EA
一般特徵: 完全控制交易時段的結果。 控制所有外匯交易品種,指數,金屬,股票等的整體結果。對全球股票進行控制。 達到盈虧率時,關閉所有交易品種上的所有交易。- 數量和百分比均可更改的配置。 通過全局跟踪止損來保護結果- 本屆會議取得的成果記錄(更高的權益和更低的權益)。 登錄時,所有計算始終在資產負債表上執行,因此不會影響交易的平倉或平倉。 在Metatrader 4中,您可以用一定比例的賬戶損益來平倉單個交易。 觸發獲利或止損時自動關閉平台的選項。- 通知功能:觸發TP / SL級別時,將報告發送到電話(按通知)或電子郵件的選項。- 觸發TP / SL時可以選擇刪除掛單- 觸發TP / SL時可以選擇截屏並保存在文件中。- 更改字體大小的選項。- 選擇在“獲利百分比”和“止損百分比”中默認設置值 停用自动交易:达到全球止损或止盈水平时,股票保护将停用自动交易,以防止其他EA开立新交易。重要提示:对于Metaquotes市场的规则,“关闭自动交易”功能不可用,如果您需要使用该功能,请通过电子邮件与我联系:tradingxbots@gmail.

MS Trading Expert Advanced
======================================
The Robot is based on 4 Indicators to catch profitable trades. ========================================================
This Robot is fully automated and has been created for everyone. The Robot works also on cent accounts. =============================================================================================== => works on all Time Frames from 1Minute to 1Day => On the lower Frames there are too many small trades but it

The EA uses a trending strategy based on numerous technical indicators "Moving Average" on the timeframe: M4, M5, M6, M10, M12, M15, M20, M30, H1. The Expert Advisor uses elements from strategies such as Martingale, Grid and Averaging. In trading, up to 3 orders can be opened simultaneously on each of the currency pairs. The EA uses a partial order closing algorithm and hidden Stop Loss, Take Profit, Break Even and Trailing Stop. A multi-currency adviser trades in 17 currency pairs. EA uses tim

Multi instrument and multi time frame EA, with the best indicators. The MSD EA can be used for automated and manual trading. Click on the '?' button on the dashboard to obtain information about the various elements of the MSD EA. Uses ATR Take Profits, ATR Stop Losses and ATR Trailing Stops. Comes with an FX Currency Strength meter and a Market Sessions indicator. Has the option to place Trade Lines (Buy, Sell, Close, Alarm). When the price reaches the trendline, the EA will perform the approp

Gold Grail Expert (GGE for short) adopts a unique design to follow the trend of gold fluctuations. When the price of gold goes to one side, the program will open orders in the intermittent of callback trend. Meanwhile, GGE adopts multiple filtering methods including Bollinger Bands, RSI, ADX and DeMarker to improve the accuracy of the signal for trade. Each order has Stop-loss and Profit-take setting automatically to effectively ensure the profit. Foreign exchange is a high risk market. Most in

BeST_ Elliot Wave Oscillator Strategies is an MT4 indicator which by default is the difference of two SMAs displayed as a histogram fluctuating around zero while a Signal Line generates Entry Signals either in a Reverse or in a Normal Mode and it is a very powerful tool that very often exploits huge market movements. Signal Line comes in 2 types: Advanced Get Type – like the corresponding one used in the homonym analysis package Mov. Average Type – as a Moving Average of the Elliot Oscillator I

MA Multi-Currencies Multi-Timeframes Histogram BUY/SELL Indicator up to 6 currencies on time calculations based on 6 time frames : M5, M15, M30, H1, H4, D1 Trading Strategies: **TREND shifts to UP trend when Green point appears after Red and Gray points -> Close SELL positions then add new BUY positions on new Green points **TREND shifts to DOWN trend when Red point appears after Green and Gray points -> Close BUY positions then add new SELL positions on new Red points ** Close BUY position

Moving Averages Of Cci This indicator shows you Average of Commodity Channel Index. You can use this indicator for your own experts with iCustom() CCI is in the buffer ( 0 ) and moving average is in the buffer ( 1 ) there are afew parameters for using this indicator on different currencies and different time frames. you can test it and optimize it . Input Parameters: CciPeriod: default is 14 SignalMaPeriod : default is 28 SignalMAMode : default is SSMA

Moving Averages Of Rsi This indicator shows you Average of Relative Strenght Index. You can use this indicator for your own experts with iCustom() RSI is in the buffer ( 0 ) and moving average is in the buffer ( 1 ) there are afew parameters for using this indicator on different currencies and different time frames. you can test it and optimize it . Input Parameters: RsiPeriod: default is 14 SignalMaPeriod : default is 28 SignalMAMode : default is SSMA

Индикатор ищет уровни поддержки и сопротивления, определяя важные ценовые уровни. Параметры индикатора: Mode - метод определения уровней: 1) High_Low - по теням, 2) Open_Close - по цене открытия и закрытия;
Period_ - период индикатора, внутри которого ищется важный ценовой уровень (например, если стоит 12 - ищет уровень внутри 12 баров, сдвигаясь каждый раз на бар вперёд); Touches - количество касаний цены; BreakAlert - выдавать алерт при обнаружении уровня;
NewLevelAlert - выдавать алерт при о
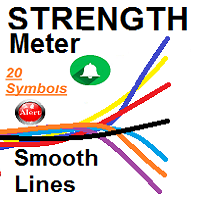
Currencies Strongest Weakest SMOOTH STRENGTH METER INDICATOR (SMOOTH LINE) it draws Currencies TREND Volatility Power / Strength lines : - Detects the 2 highly TRENDED Volatile pairs ( will be the Bold Lines ) - A very Helpful Indicator - It draws smooth lines for up to 20 currencies pairs representing Volatility strength and power - First it indicates the most powerful trended direction pairs : Strongest / Weaker - MAIN FUNCTION :it gives indication of the UP trend mos

The Blue Eagle indicator gives a signal of a trend change, showing signals. High probability of a successful trend, it can be used with an optimal risk to profit ratio. The indicator does not redraw and is not late; it can be used both for piping on small periods and for long-term trading.
The Blue Eagle indicator is designed to analyze price movements with a given amplitude, displaying only the most important reversals, which greatly facilitates the evaluation of charts. The arrows show the c

The basis of the work of the Patterson Expert Advisor is based on trend trading, the direction of which is determined by indicators. In the input parameters of this trading robot, the minimum number of settings for the user, which on the one hand fetters experienced users who like experiments, and on the other hand, simplifies the work for a beginner and protects him from possible errors in using the settings.
The expert works using sharp ticks. The uniqueness of the expert is that it can be l

The PM Ichimoku Dashboard will show you 28 Currencies and 2 metals on a single chart all the timeframes (M1 to Month) with their own status for the indicator. How to understand the status: Zero: Tenkan equal Kijun Green/Red Circle: Price above/below Cloud (Kumo) Green Circle + Down arrow: Price above Cloud but Tenkan below Kijun Red Circle+ Up arrow: Price below Cloud but Tenkan above Kijun Grey Circle: Price inside Cloud Indicator Parameter: Tenkan-sen - Tenkan sen period Kijun-sen - Kijun sen

The Alive Trend arrow indicator shows potential entry points into the market in the form of arrows of the corresponding color: up arrows (blue) offer to open a purchase, down arrows (red) - to sell. Alive Trend visually “unloads” the price chart and saves analysis time: there is no signal - there is no deal, if a return signal appears, then the current deal should be closed. It is supposed to enter the next bar after the pointer, but there may be non-standard recommendations for each strategy.

PROFITABLE HIGHER AND SAFER - Kakarot EA uses indicators combined with AI algorithm according to the principle of trend detection and trend matching. - The principle of order balancing, low DD protects accounts better for high profits. - Flexible command entry and exit - Works on all pairs, preferable to major USD pairs. - Support trade manual methods. - Provide effective bot management parameters at your own discretion to be able to bring a much higher profit. Help Manual Bot configu

The principle of this indicator is very simple: detecting the trend with Moving Average, then monitoring the return point of graph by using the crossing of Stochastic Oscillator and finally predicting BUY and SELL signal with arrows, alerts and notifications. The parameters are fixed and automatically calculated on each time frame. Example: If you install indicator on EURUSD, timeframe M5: the indicator will detect the main trend with the Moving Average on this timeframe (for example the Moving

The indicator works on calculating the price delta. Most likely determines the direction of the market. It works in two modes, calculation for each candle and total calculation of a group of candles. It is used for MT4, works on all instruments. It does not require any settings. Easy to use for all even beginners. Market assessment can be done on all timeframes from 1 minute and above. Instructions for use in the video. Current issues can be discussed in telegram chat, link under the video. Good

Most accurate Pattern indicator on this market. It search triangles, wedges, channels (next patterns and autoscanner in plan) Works on Forex, Commodities, Indicies, Stocks, Crypto, ... on all timeframes and on every brooker.
If you want this and all my other products for FREE , create account here and then write me and I will send you all my actual and future product for FREE + VIP on my http://discord.io/reitakfx
For more info join to http://discord.io/reitakfx where you can get info
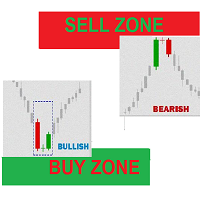
Buy Sell Zones Simple indicator for moving BUY / Sell Zones and Buy / Sell Signals generated with indicator moving Buy and Sell zones : Closest zone is wide and clear : Red for Sell zone , Green for Buy zone >>> old far zones are in bold lines :::BUY Zones (GREEN) appear only in UP Trend and disappear in DOWN Trend :::SELL Zones (RED) appear only in DOWN Trend and disappear in UP Trend input parameters ::: index bars : bars range for zone calculation levels : number of zones Up move/Down mov

Display the date, time and price according to the movement of the mouse cursor on the chart This is useful for discretionary trading.
It is an indispensable tool for verifying and studying past market prices and trades. Large and easy-to-read characters It is easy to see even if your eyesight is weak.
Also, you can tell the date and price to YouTube and webinar viewers in an easy-to-understand manner. Characteristic Date,Time and Price are displayed. The value follows the movement of the mouse.

General information The indicator determines the areas of flat and trending market states by comparing the average and current volatilities. Flat areas are rectangles of a user-defined color. It is easy to determine the maximum and minimum of the flat area, as well as its height in points. The beginning of each trend area is marked with an arrow indicating the direction of the trend.
Tuning parameters
1. Averaging period - period for calculating average volatility
2. Color of flat region -

Qiwi EA is a fully automatic Forex trading system. The system monitors the trend, tracks the actions of large traders in the Asian session and trades with them. The expert does not use dangerous trading methods, does not use a high frequency of transactions, and most importantly, is not sensitive to the spread. An expert is also suitable for dispersal of a deposit. Several trading modes: aggressive, calm. It all depends on your preference.
I am ready to help you set up an expert for a
The brand new trading indicator Trendline Tunnel is presented by KING.Ai. This indicator were built base on the the theory of Latest Up and Down Trend line . Latest Trend are difficult can by seen by human eye. Indicator can help to identical the Trend . KING.Ai Forex trader mainly use this strategy to "See Through" market . We do believe that it is a powerful method to show the latest trend and do the breakout trade strategy . General speaking, Trendline Tunnel have following using: Method
Ultimate Daily Breakout Expert Advisor
Many trading stratergies look to trade daily trend swings by defining levels based on the previous day's high and low on the daily chart. When these levels are broken, price tends to trend in that direction sometimes for 100s of pips. This EA is a tool to both look for these patterns though backtesting and then after being found to trade them live. The Ultimate Daily Breakout EA can be optimised for and used on any currency pair, commodity, stocks or share

The Great Gig In The Sky is an expert advisor and also a song from My favorite Rock Band's. Pink Floyd. There is only one input parameter. Lots amount. You know what do you do in there. Try in a demo account from your real broker to test. Expert logic also includes stop loss and take profit transactions. Do not worry about them. The one-month rental period is only for you to try the experiment and is valid for limited copy. Tested and Preferred pairs are GBPJPY, CHFJPY,CADJPY. I am still contin

Характеристики советника Платформа : MetaTrader 4 Версия : 1.0 Обновлён до : 1.1 Валютные пары : USDCHF и прочие инструменты с умеренной волатильностью Таймфрейм : Н1 Тип робота : сеточник Время работы : не ограничено Принцип торговли Отличие в том, что здесь лот при построении сетки ордер в( при желании можно не увеличивать) увеличивается не в геометрической, а в арифметической прогрессии. Это снижает нагрузку на депозит и позволяет переживать сильные тренды. В остальном ProPribl стандартный

MarketSqueezeEURUSD EA Utility MarketSqueezeEURUSD EA Utility is an Utility EA that works in line with a particular Trading system to remove stress of measuring the pips for distance, take-profit and stop-loss. Upon just a click, it will open both the Buystop and Sellstop pending orders at once. The system states that whenever there is a squeeze market pattern on EURUSD on 15M Time-frame, just place an horizontal line on the highs of the long line of the squeeze and place another horizontal l

This indicator is to follow the trend. When the closing price breaks the trend line, it may mean that the trend has to be reversed. It is cashing well in the trend. It has only two parameter settings. Parameter setting: deviation:15 "deviation" is Follow the distance between the current high and low points. depth:24 "depth" is Depth of high and low points. This is just the default parameter, you can optimize it in use.
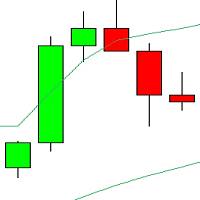
Indicator will send alerts when price has opened and closed outside bollinger bands. THIS INDICATOR SCANS EVERY PAIR ON SIDE OF MARKET WATCH SO YOU DON'T MISS A TRADE! Indicator has pop up alert for all currency pairs in your watch list. It is set up to notify you if price is outside of M15, H1, H4 automatically. This is great for seeing if market is a critical levels and at a possible reversal point.

Pivots MT4 - Простой и удобный индикатор уровней pivot , рассчитывает уровни по методам Classic , Fibonacci , DeMark , Camarilla , WooDie , Central Pivot Range . Индикатор выгодно отличается следующим
Рассчитывает уровни pivot по методам Classic , Fibonacci , DeMark , Camarilla , WooDie , Central Pivot Range ; Выводит на графике текущие уровни и уровни на предыдущих периодах; Выводит на графике выбранные метод и период, названия уровней и их ценовые значения. Параметры Pivot Method - Выпа

The Expert Advisor advantages: Opening the first order is designed to close by Take Profit, that is, the strategy uses the grid only to increase profit and reduce loss! Hurry to buy an adviser Net Spider in the first 2 days, super price only 199$ Watch a detailed video working with our expert Revised loss behavior strategy. Now the client limits the loss himself. Exactly the amount he wants, we recommend setting not bigger half the deposit, That is the maximum that we recommend. Principle o

StepOscillator - необычный осциллятор, выполнен в виде ступенчатой линии в отдельном окне индикатора. Кроме того, что линия меняет цвет при смене направления движения цены, что является сигналом к покупке или продаже, так же о силе тренда можно судить по размеру ступеньки, чем она выше, тем сильнее тренд. Кода ситуация на рынке близка к смене направления движения, линия индикатора становится практически плоской. Входные параметры: Price - цена по которой ведет расчет индикатор AlertsMessage - вк
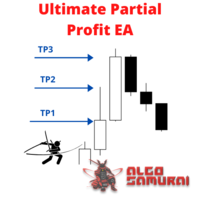
This EA Utility delivers a robust solution for managing an unlimited array of open orders, both manual and automated. It enables customizable partial profit levels utilizing metrics such as pips, ratios, ATR (Average True Range), and profit amounts for precise trade management. The utility features an advanced on-screen display, offering clear visualization of all orders and their profit levels to enhance strategic decision-making and control. To evaluate its performance and interface, the EA s

I will support only my client. สำหรับลูกค้า Parameters
General Trade Settings Money Management
Lot : Fixed (can change) Strategies - M1-D1 Strategies it is fixed with MA, Bollinger band, Candlestick Levels Close Functions - M1-D1 Strategies Close by Money Profit - Close Total Open Profit, Close Total Open Profit Short, Close Total Open Profit Long, Close Profit/Loss Today MagicNumber - individual magic number. The EA will only manage position of the chart symbol with this magic number. Ne

Trade Clone MT4 EA
User description in MQL5 blog
New version 1.57 Read updates
MT5 version download here
With Trade Clone EA you can trade on multiple MetaTrader 4 and MetaTrader 5 accounts simultaneously, clone the trades of any trading robot from server account to your friends and family accounts. Note: All MetaTrader 4 and MetaTrader 5 must run in same computer, or you need copy the trade file to the Client computer. You can run multiple Trade Clone EA as server, and you can

BPS Panel
Breakout Pro Scalper Solution Panel
This indicator is part of the RPTrade Pro Solutions systems. BPS Panel is a daily trend indicator using Price Action, Dynamic Support and Resistances. It's designed to be used by anyone, even the absolute beginner in trading can use it. NEVER repaints . Indications are given from close to close . Designed to be used alone , no other indicators are required. Gives you the trend and potential Take Profit at the beginning of the day.
How doe
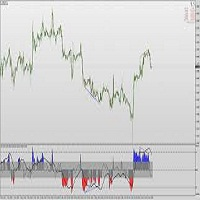
The "Preface" Input-
Broker time is required by the code that features PivotsTz and vLines. When data feed is live the broker time is available. When data feed is not live it is not available. The purpose of this "Preface" section is to find and input the Clock location that has the same time as the broker server. Then, even without live data feed we will still have the equivalent of the broker server time to work with, generated by the Clock, and the PivotsTz
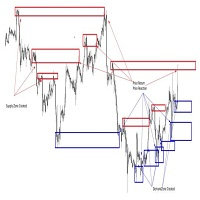
While most traders use various technical indicators, the price action is basically determined by the buying and selling activity. This is how support and resistance levels, which are commonly used terms in technical analysis is formed.
Traders know that when price reaches a support level, price can bounce off this support. This is also known as a level where this is high demand. A high demand area forms when there are more buyers than sellers.
In trading, investors tend to buy at the support

MRS V2 contrôle le niveau des indicateurs: (Croisement des moyennes mobiles, RSI, Stochastique) Il passe un ordre d'achat ou de vente, si ces indicateurs sont orientés dans le sens que vous avez même défini . Il augmente sans problème les probabilités de réussite! -> pas d'algorithmie secrets ou incompréhensibles ... des indicateurs simples, fiables, qui passent le temps et les aléas des marchés. Basé sur une stratégie simple mais efficace : Croisement des moyennes mobiles lente et rapide dét

This indicator will draw monthly, weekly, and daily pivot. Pivot line will be calculated automatically again when the period ends. Auto Pivot Metatrader 4 Indicator The Auto Pivot indicator for Metatrader 4 automatically updates the pivot point (PP), support (S1,S2,S3) and resistance levels (r1,r2,r3) every day. Price above the pivot point means positive while price below the pivot point means negative. S3 indicates extremely oversold while price above resistance r3 means extremely overbought.
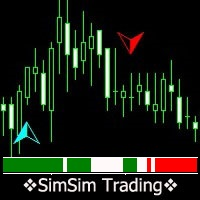
该指标计算和汇总来自25个标准指标的数据。 作为计算的结果,我们获得了当前信号电平。 在输入参数中指示最小信号电平。 此级别显示为直方图(主指示器)和指示器箭头(第二指示器)。 信号的正值表示可能购买,负值表示出售。 该指标实现了一个测试系统,可以通过下载演示版本进行测试。然后,主要用户选择自己所需的指标并指示这些指标的参数。指标可以极大地增加您的交易策略。指示器不会重绘,只有在蜡烛以新信号关闭并且信号仍保留在1号蜡烛上之后,才做出所有决策。
仅此指标就可以替代两个早期产品:
拨号指示器: https://www.mql5.com/cn/market/product/39814
条形图指示器: https://www.mql5.com/en/market/product/39822
您支付一个指标,就得到两个指标。 首次试用-租用或购买! 输入参数 最小信号电平(100)%/最小信号(0-100)% 购物颜色 待售颜色 颜色中性 文字颜色/文字颜色 文字字型大小 指示线粗细信号箭头的类型 垂直线样式/垂直线样式。 #窗口中的信号为(0)-no./窗口中的信号为(0)。 历

Lucky Traders 具有灵活设置的通用智能交易系统,它适用于挂单。该机器人可用于使用剥头皮交易策略的设置从 100 个余额单位开始加速小额存款。用户可以根据来自 10 个指标的信号选择顾问的工作,其中两个是自定义的。智能交易系统也可以配置为非指标工作。一次只能为“EA 交易”选择一个指标。所有指标都有一个 Period_ 设置。对于 DeMarker、Stochastic、RSI、CCI 指标,使用级别设置:upper level - level_up,lower level - level_dn。对于 ADX 指标,使用较低级别的设置 - level_dn。默认情况下,级别设置是标准的。 顾问设置说明: Signal - 信号的指标选择,NONE - 不使用指标 Period_ - 设置指标周期 level_up - 指标的上位,例如,默认情况下,RSI 指标设置为 70 level_dn - 指标的较低级别,例如,默认情况下,RSI 指标设置为 30 Max_Orders - 市场中的最大订单数,例如,如果 = 10,则顾问将仅处理 10 个订单 Level_order

Forex Day Trader EA - reverse
This Robot has passed a 20YEAR Backtest before releasing. ================================================
The Robot is based on 3 Indicators to catch profitable trades. ====================================================== As the name suggest it works best on Day Frames.over 90% success rate in the backtests.
This Robot is fully automated and has been created for everyone. The Robot works also on cent accounts. ===================================================

Forex Day Trader EA This Robot has passed a 20YEAR Backtest before releasing. ================================================
The Robot is based on 3 Indicators to catch profitable trades. ====================================================== As the name suggest it works best on Day Frames.over 90% success rate in the backtests.
This Robot is fully automated and has been created for everyone. The Robot works also on cent accounts. ==============================================================

The indicator is designed for binary options and short-term transactions on Forex To enter a trade when a signal appears blue up arrow buy red down arrow sell signal For Forex enter on a signal exit on the opposite signal or take profit For binary options Enter on 1 candle, if the deal goes negative, set a catch on the next candle Works on all timeframes If you apply a filter like Rsi, you will get a good reliable strategy.. The algorithm is at the stage of improvement and will be further develo
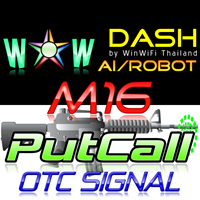
The principle of this indicator is very simple: detecting the trend with Moving Average, then monitoring the return point of graph by using the crossing of Stochastic Oscillator and finally predicting BUY and SELL signal with arrows, alerts and notifications. The parameters are fixed and automatically calculated on each time frame. Example: If you install indicator on EURUSD, timeframe M5: the indicator will detect the main trend with the Moving Average on this timeframe (for example the Moving
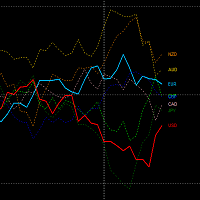
精准、简单地监控货币相对强度 该指标允许您实时分析整个货币篮子中各个货币的相对强度,帮助您识别交易机会,提供战略优势。 主要优势: 即时货币强度分析 :查看货币强度既简单又直接,让您能够快速识别关键差异并抓住机会。 三种显示模式 :根据您的需求选择三种不同的模式: 显示篮子中所有货币。 突出显示当前符号的货币相对于其他货币篮子的表现。 隔离并仅显示所选符号的货币。 兼容所有时间框架 :支持所有时间框架,但建议从15分钟的时间框架开始使用,以获得最佳效果。 高级功能: 可定制的计算选项 :可以限制用于计算的K线数量,从而获得所需的精确分析。 支持前缀和后缀 :轻松处理带有前缀或后缀的货币对名称,适应您的经纪商需求。 颜色自定义 :根据您的喜好调整指标颜色,提升您的交易体验。 货币强度排名 :清晰展示货币按强度排序,简化不同货币之间的对比。

GALAXY it is a Secure Automated Software for trade Forex market and indices. Architecture is a Fully Automatic Autonomous Robot Expert capable
Independently analyzing the market and making trading decisions
GALAXY It is an advanced trading system. This is a fully automatic Expert Advisor.
NO INPUT TO SELECT FOR THE TRADER ALL AUTO MATED THIS SYSTEM IS ALWAIS IN THE MARKET IN THE TWO DIRECCTION MAKE WINING CYCLES
GALAXY . It is a 100% automatic system, the system controls
Buy and Sell stop-limit orders are available in MT5 but not on the Metatrader 4 platform. Now you can place a Buy/Sell limit order or both on your chart with multiple user defined parameters. Save your PIPS and get your orders placed where you want them. Once placed on chart it will place up to 1 order long and short depending upon the choice made by user. Once a Buy or Sell limit order is placed it will not repeat another unless reinstalled on chart. See screenshot below for possible settings.
MetaTrader市场是独有的自动交易和技术指标商店。
阅读MQL5.community用户备忘更多地了解我们提供给交易者的独特的服务:复制交易信号,自由职业者开发的自定义应用程序,通过支付系统完成的自动付款和MQL5云网络。
您错过了交易机会:
- 免费交易应用程序
- 8,000+信号可供复制
- 探索金融市场的经济新闻
注册
登录