适用于MetaTrader 4的EA交易和指标 - 23

Gladius EA Standard is a trading robot specifically designed for the forex market. It uses both technical and standard indicators to identify the best trading opportunities and maximize the potential of every trade. It is best suited for trading the GBPUSD pair and offers the flexibility to set up single, double or triple entries based on your needs. Gladius EA Standard also features a news filter and mathematical predictions to analyze the market, as well as a Super Trend period to track market
FREE
The presented indicator is a joint application of the FATL digital filter and the Ehlers filter (J. F. Ehlers). This indicator gives reliable signals with a small delay, which makes trading based on it very effective. After receiving the signal, you should wait for its confirmation - overcoming the high/low of the bar on which the signal was given by the price.
It is recommended to pay attention to divergence or convergence signals (discrepancy in the ratio of new highs or lows on the oscillat
FREE

By default Metatrader will show any newly created chart object on all timeframes.
This handy utility will set the visibility of any new chart object drawn to be that of the current chart only.
e.g. If the chart timeframe is H4 then a new object will only be visible on the H4 timeframe.
Each object type can be included or excluded as required and, of course you can change the timeframes setting afterwards as this only operates at the point the chart object is created.
Add to your chart a
FREE

Special Trend Oscillator is an indicator designed to detect trend change points and measure the power of the current trend. This indicator is a different model of the MACD indicator. The indicator has two channels. The blue channel is the upper line of the upward trend. The red channel line is the underscore of the downward trend. Buy when the trend line reaches the red line. Sell when the trend line reaches the blue line. Our Popular Products Super Oscillator HC Cross Signal Super Cross Trend S
FREE

Indicator description. The “ Alligator Analysis ” ( AA ) indicator allows you to build various (by averaging types and by scales) “ Alligators ” and their combinations, i.e. allows you to analyze the state of the market based on the correlation of this state with a whole range of different " Alligators ". The classic " Alligator " by Bill Williams is based on moving averages and Fibonacci numbers, which makes it one of the best indicators now. The classic " Alligator " is based on
FREE

Fractals ST Patterns is a modification of Bill Williams' Fractals indicator. Unlike a standard Fractals indicator, Fractals ST Patterns allows setting any number of bars to find a fractal. This simple indicator corresponds to the parameters specified in the ST Patterns Strategy ( https://stpatterns.com/ ) . Structural Target patterns are the market itself, which is consistently divided into components. For the formation of ST Patterns , no trend lines, geometric proportions of the model itself,
FREE

Sirr Advanced Trend Scalper EA Pro is an automated and easy to use expert advisor that has the Stochastic indicator working in combination with RSI and MACD filters built in. We have spent a lot of time testing many expert advisors . After years of testing and development, the result is an dynamic EA that is very active with trades and capital management. Our product is also fully compatible with PipFinite Trend Indicator PRO as well. The EA has been designed for trading with the popular symb

Hi New Update Available At Non Free Version. Its more profitable and saver than older one. Just Grab it fast. Every month price goes up
This Free version Only use Lot 0.01 cannot modify the Lot Size. If You wanna unlock the lot size you can buy Pro Version at https://www.mql5.com/en/market/product/49608 See EA Performance on Backtesting with low balance = https://youtu.be/8Wok_CTzcsQ
Mata Elang EA is a trading robot for the trading on forex and trades Scalping Strategy. This is a Tre
FREE
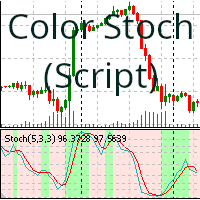
此脚本根据买入或卖出趋势为随机振荡器的背景着色。背景颜色由指标线的位置确定。
可修改的参数如下:
%K Period: %K 周期。 %D Period: %D 周期。 Slowing: 减速周期。 Price Field : Low/High, Close/Close。 MA Method: Simple, Exponential, Smoothed, Linear weighted。 Color Positive Trend: 上升趋势的背景颜色。 Color Negative Trend :下降趋势的背景颜色。 Color Neutral Trend : 中性趋势的背景颜色。 Save variables: 保存当前值以供以后重复使用。 Clean graph : 清除图表的颜色 (Clean colors)。
如何使用脚本:
要使用脚本,只需将指标拖放到图表上。根据您将指标拖放到图表上的哪个位置,您将获得结果。从为指标着色到为整个图表着色。 (请参阅屏幕截图)
脚本将自动应用到指标。
结论:
此脚本是使用随机振荡器的交易者的实用工
FREE

Free parabolic SAR expert advisor is a completely free expert advisor that trades using Parabolic SAR dots. It opens and closes trades based on the first dots of a new trend. The various settings are explained below.
Parameters NOTE: The default settings are just place holders and not necessarily the best. Use the settings that best suites you or your strategy. Lots - This is the lot size of the EAs trades. 0.1 is the default setting. StopLoss - Stop loss setting. AllowBuy - Set to true to all
FREE

OpenEA Trade GPT XT Pro EA is an automated and easy to use expert advisor that has the Stochastic indicator working in combination with RSI and MACD filters built in. We have spent a lot of time testing many expert advisors . After years of testing and development, the result is an dynamic EA that is very active with trades and capital management. Our product is also fully compatible with PipFinite Trend Indicator PRO as well. The EA has been designed for trading with the popular symbols e.g.

Trend Rising 是自定義 MT4 (Metatrader 4) 指標,最適合剝頭皮 TF M30 及以下,使用基於多個時間框架的 Bill William 指標分析趨勢和動量模式。結果,它確定了適用於大多數貨幣對的趨勢的開始和結束。 Trend Rising 指標是基於 Accelerator Oscillator 和 Awesome Indicator 開發的。
主要特徵 用顏色顯示趨勢的開始和結束。 使用 base-TF H1 輕鬆識別趨勢強度(強牛市和熊市)。 識別市場調整。 (當前圖表的弱勢和可能的逆轉) 當建議的條目發佈時,在圖表上繪製 SL 級別。 獲取圖表中發生的每一次趨勢變化的警報。
趨勢上升的優勢 使用所有貨幣對(外匯、加密貨幣、指數和商品) 使用所有時間範圍。 (推薦時段:M30及以下TF) 警報生成器。 (彈出警報、推送通知警報等) 未重新粉刷 100% 免費指標
接觸 如果您有任何疑問或需要幫助,請通過私信與我聯繫。
作者 Safwan Daud,馬來西亞貿易分析師。青年商品交易員(YCT)
FREE

Introductory Pricing for one month
Brute force trader is specially designed to find the best entry point and exit point with the regular tested and proven indicators. The EA will automatically analyse the market and will follow trends with the right entry exit points. Since the timeframe it is using is 30 minutes, the chances that you are stuck into a long trade is very low. Thought it does not use stoploss but it has t
FREE

This indicator will turn the colors of your candles into a trend oriented colored showing 4 different colors based on two moving averages and the slope of the slow moving average. very powerful indicator for all periods of time showing you the direction of the trend to confirm your trades.
Green: Bullish
Dark Green: Bullish Weak
Light red: Bearish Weak
Red: Bearish
For more info:
https://linktr.ee/trader_1st
FREE

Chaos Trader Lite attempts to use aspects of chaos theory to place trades in the marketplace. This Expert Advisor, in particular, draws upon theories made by Bill Williams. Every version of MetaTrader contains the Bill Williams indicators. I wondered why was he deemed so important as to have his own set of indicators added to MetaTrader with name attribution. Conducting research I found that Bill Williams wrote a book using chaos theory to trade the markets. The Bill Williams indicators are usef
FREE

The “ Ticks Overcome Signal ” indicator, as outlined in your provided code, is a custom tool designed for use with MetaTrader 4 (MT4), a popular platform for Forex trading. This indicator seems to focus on tracking the momentum and direction of price movements by counting consecutive up and down ticks. Here’s an overview of the psychological aspects, logic benefits, and usage instructions for this indicator on MT4: Decision Support : Traders often face psychological challenges in decision-making
FREE

ATR Accelerator Indicator informs you about strong price movements based on the ATR Indicator. This Indicator works for all Timeframes and Symbols, the strength of movements can be configured.
Important: Get informed about new Products, join our MQL Channel: https://www.mql5.com/en/channels/etradro
Useage This Indicator works for all Timeframes and Symbols, the strength of movements can be configured. Features works on all timeframes and forex pairs or indices. Alert and Notify function
FREE

This indicator shows in a subwindow the trend in M1, M5, H1, D1 timeframes based on MA, MACD, Stochastic This way you could see in once in different timeframes what happening. This is my first free indicator. Please follow I will put here some more. Thank you for you attention. . . . . .
lfknglkslksnlgslgnsflgjrpoesv ,msv lkrjpfjésmdg sd.npo4wsmdglknsp4jwpkeégmfs.lkmp Thank you
FREE

Trend indicator derived from T3 moving averages. The cloud is bounded by a fast T3 and slow T3 lines. Buying/Selling opportunities above/below cloud. The fast and slow T3 MA lines can also be used as dynamic support/resistance for more aggressive entries. Use default values for best settings. The number of look back bars is user defined. This indicator can be used in combination with other strategies such as price action. Suitable for all time frames. Prerequisites: T3IndiSlow and T3IndiFast in
FREE
Search for an entry with low risk for trading by Lisek Moving Average Indicator. There are many ways to trade with Lisek Moving Average Indicator: Trend continuation (Trend trading). Trade pullbacks (Range trading). Trade breakouts. Trade reversals. Take profits or set stop-loss based on your MA.
Moving Averages are a frequently used technical indicator in forex trading, especially over 10, 50, 100, and 200 periods. Moving Averages are lagging indicators, which means they don't predict where
FREE
This indicator displays the moment when the MFI oscillator crosses its smoothed value. If the MFI oscillator crosses its smoothed value, it is a signal of a trend change. The signal is given after the end of the formation of the candle. The signal is confirmed when the price crosses the high/low of the bar on which the signal was given. The indicator does not redraw.
Custom Parameters: MFI_Period (>1) - MFI indicator period; MA_Period - period for smoothing MFI indicator values; MA_Method - me
FREE

A classic indicator with advanced features for more accurate display of the market situation. All settings of all moving averages are available, such as the moving average type and the priced used in its calculation. It is also possible to change the appearance of the indicator - line or histogram. Additional parameters provide the ability of fine tuning.
Distinctive features Does not redraw. Additional parameters for fine tuning. Displayed as a line or as a histogram. Works on all timeframes
FREE

Due to policy changes in MQL5.com, we cannot continue our free trial program here. However, you can request to test our EA in live account though here . Limitless EA is a martingale based EA , which provide a lot of configuration to customize your martingale strategy to suit your personal risk profile . Trading Strategy Main characteristic of this EA: Martingale based strategy. Determine very short term trend as the aim is to get small profit on each trade. Open more trades to e
FREE

This is a multi-strategy EA. In the night scalping mode, the filters filter a trend-free range market environment and trades are placed in the opposite direction at the edges of the range. With an additional main trend filter in the trend-following mode, you can also trade pull-backs during longer trends on same houers or days. A detailed description of SpotLight EA can be found in the SpotLightBlog and a live monitoring here: If you have any question about the product, please contact me.

EA BUMAN may not have a high frequency of entries, but it can provide stable profits. The entry logic is quite simple. It only uses one moving average line.
It enters trades when the candlestick crosses the Exponential Moving Average (EMA) line. If the closing price of the candlestick is above the moving average line, a BUY entry is executed. If it is below the moving average line, a SELL entry is executed.
To increase the profit-taking win rate, it is important to effectively use the Brea
FREE

This indicator idea comes from Tushar Chande called Qstick.
Technical indicators quantify trend direction and strength in different ways.
One way is to use the difference between close and open for each bar and to sum it up over a period of time.
The formual is:
Qstick (period ) = Average ((close-open ), period )
In this indicator, we can choose how to calculate body by two famous chart types. The first and default indicator settings are based on Heiken Ashi chart, and the second i
FREE

The Detective Pips EA is an automated hands-free tool that trade pending order breakout at previous high and low strategy. This EA is also a non-Martingale and Hedging Mechanism by which most traders are comfortable with, profits are secured by the adjustable trailing stop. Also, this strategy works with small average profits therefore it is highly suggested to trade with a low spread and commission broker. This EA is a great day trading scalping Project that are able to trade both trending and
FREE

This Dashboard is free to download but is dependent on you owning the Advanced Trend Breaker . Get the indicator here: https://www.mql5.com/en/market/product/66335
The Dashboard will show you on a single chart all the timeframes (M1 to Monthly) with their own status for the indicator: Advanced Trend Breaker
all time frame and all symbol: smart algorithm detects the trend,Support and resistance, filters out market noise and find breaker of entry signals!!!
!!!
How to unders
FREE

LOOK AT THE FOLLOWING STRATEGY WITH THIS INDICATOR. Triple RSI is a tool that uses the classic Relative Strength Indicator, but in several timeframes to find market reversals. 1. ️ Idea behind the indicator and its strategy: In Trading, be it Forex or any other asset, the ideal is to keep it simple, the simpler the better . The triple RSI strategy is one of the simple strategies that seek market returns. In our experience, where there is more money to always be won, i
FREE

The ' Average OHLC ZigZag ' indicator was designed for entry confirmations as well as scalping with a larger trend. A custom formula to average the last two bars to generate arrows following market trends with bar 1 confirmation.
Key Features An extreme scalper calculating the averages between the last two market periods to generate a buy or sell arrow. No settings are available due to it's simplicity of custom price action pattern and using repainting four OHLC prices.
Input Parameters Zig
FREE
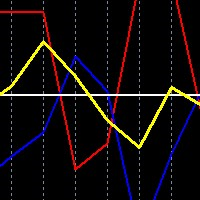
This is a simple free tool for simulating trades when trading both AUDUSD and NZDUSD in a hedge strategy, you can drop the indicator on either market chart. It is essential because you cannot tell at a glance, what a combined trade would be like, just by looking at the two individual charts separately.
New premium low cost indicator
How to use: Drop the indicator on either AUDUSD or NZDUSD chart, or any other chart, it will work.
You choose ploting period, to the number of days/weeks
FREE

Indicator RS 24 Titanium is a multi-currency and multi-timeframe signal indicator created by the author's algorithm. Designed to quickly assess the trend (the mood of market participants) on all timeframes simultaneously, for a specific financial instrument. RS 24 Titanium scans readings from all timeframes for one financial asset and displays data in the form of a visual table. The indicator can be used with any broker (with 4/5-digit quotes). The received trading signals can and should be used
FREE

The indicator searches for the largest candles with minimum wicks for the last X candles. Sometimes, such candles mark the presence of a strong buyer, who quickly and strongly pushes the price in the right direction. However, most often, these are culmination candles, especially at the end of a prolonged trend when a single large candle knocks out stop losses of the most persistent traders and the price reverses instantly. The indicator allows you to open a position on the very edge of the marke
FREE

LIVE TESTING HERE
Welcome! This EA trades the legendary Laguerre RSI . Makes swing trades. This is not a Scalping risky strategy. Most of the time, short timeframes strategies tend to trade noise, resulting in a non lasting winning strategy. Laguerre RSI EA doesnt trade noise, it trades trend changes checking higher TimeFrames (4 hour, daily and weekly) first . It stands 12 year of backtesting on EURUSD.
Features:
Stop Loss protects your account
Recommended Time Frame = 15 min Recommended

WeightTF FREE is a free demo version of the WeightTF automated trading system, which is based on intelligent monitoring of a number of strategies for each time frame of the currency instrument. The user manually sets the numeric parameters of the “Weight” of each timeframe, and the robot makes a decision on opening a trading order to buy or sell on the set of signals for each timeframe. The main idea of a trading robot is minimization of false entries into the market, which arise due to the sh
FREE

Trend indicator with oscillator. Displays price area between two moving averages and an oscillator. An uptrend is indicated in red, a downtrend in blue. Settings: Slow MA Period - Slow MA period Fast MA Period - Fast MA period Smoothed Data - Smoothing data Show Area MA - Display MA price areas Show Oscillation - Display MA oscillation Move Oscillation to Slow MA - Display an oscillator on a slow MA Color Up - Uptrend color Color Down - Downtrend color Size Arrow - The size of the oscillator ic
FREE

AD Trend line draws trend lines on the basis of A/D indicator (Accumulation/Distribution). When A/D indicator breaks a trend line, the probability of the trend reversal is very high. This is a multitimeframe indicator which can display values from higher timeframes. Parameters Time-frame — Select a timeframe; zero is the current timeframe of the chart; Trend Line — Display lines on the chart; Apply to — Apply lines to close the candle's highest/lowest value; Width line — Width of the line; Style
FREE

The Adaptive Moving Average (AMA), created by Perry Kaufman, is a moving average variation designed to have low sensitivity to market noise and volatility combined with minimal lag for trend detection. These characteristics make it ideal for identifying the overall market trend, time turning points and filtering price movements. A detailed analysis of the calculations to determine the AMA can be found in MetaTrader 5 Help ( https://www.metatrader5.com/en/terminal/help/indicators/trend_indicators
FREE

BIG CHIEF
Big Chief is an Expert Advisor that runs its own 2 proprietary analysis & algorithms. No indicator is used to analyze the entry point in the first method and the second method has an Ichimoku Indicator with proprietary settings. For the exit plan, it uses the proprietary Sequence Method & implement the cutlosses-let-profit-run strategy. You will be surprised that at the closing of all trades, almost most of them are having a positive profit and almost half of them ar
FREE

This indicator displays the signals based on the values of the classic WPR indicator. The WPR indicator can be used for determining the overbought or oversold areas on the chart. Reaching these levels means that the market can soon turn around, but it does not give signal, as in a strong trend the market can stay in the overbought or oversold state for quite a long time. As with most oscillators, the signals are generated when leaving these areas. This indicator allows to display three types of
FREE

Modified Parabolic SAR: Your Reliable Market Assistant This enhanced version of the Parabolic SAR indicator effectively reflects the trend direction and can serve as an excellent addition to your trading strategy. Advantages: Trend Direction Reflection: The indicator accurately depicts the market trend direction, aiding you in making informed trading decisions. Signal Filtering: It can serve as an effective filter, complementing your strategy by helping to eliminate false signals and execute mo
FREE

The indicator measures volumes on different charts and instruments. Its main advantage is the ability to compare separate brokers. The less Middle Volume and Tick / Second , the more reliable is the broker. There is a comment in the upper left corner Comment data: Tick/Second — number of ticks per second for a selected instrument Middle Volume — average volumes in the penultimate bar This indicator allows tracking a relative market activity for different timeframes. If the volumes are lower than
FREE

This SMART Expert Advisor trades SAFE and STEADY a nd manages all position's risk.
This is why we call it Smart Safe Steady .
Features Scalper: It is Scalper EA, but does not accept risk a lot to trade over sized, although you can bypass it's default setting in your own risk. Conservative: It is not going to keep trades open in high volatile market so it is SAFE and would close the trades even in zero profit. Martingale: This is not loss accepting so in case of loss, it runs special type of M
FREE

TLM Map AM (Trend Line Momentum Map) is an indicator developed based on a set of digital technical analysis indicators described in the article by Vladimir Kravchuk: " Digital indicators in the technical analysis of financial markets ". The indicator displays in a separate window a complex of digital technical analysis indicators such as FTLM and STLM. Recommended for use in conjunction with the RTL Map AM (Reference Trend Line Map) indicator. The indicator has no customizable parameters.
FREE
-It deletes all graphical objects on a chart. You choose the chart , then you execute the script on the chart. After the execution, all objects will disappear. Objects can be lines: trend lines, horizontal lines, vertical lines. They can be buttons, texts, labels , rectangles, edit boxes... parts of a panel. It executes fast within a second. You can use as many times as you want.
FREE

Action Scanner is a market scanner. It’s yet another product in my "Can’t trade with out it" series. Do you want to know what is moving right now? Action Scanner scans your watchlist and opens the 10 currently most moving charts. You can chose between, most moving in points, most moving in your account currency(if you were to trade it with a standard lot size 1.00) and most moving in percentage. The standard version is a complete tool with no limitations. However the pro version has additiona
FREE

Trend PRO Expert Advisor is developed base on the PipFinite Trend PRO Indicator, the best indicators on the market so far. PipFinite Trend Pro's smart algorithm detects the trend, filters out market noise and gives entry signals with exit levels. This EA open order when the indicator has buy/sell signals and set SL/TP follow the indicator rules. You can read more information about PipFinite Trend PRO indicator here .
Important Information
This EA will only work if you purchased PipFin

Follow the trail of the comet to know the development of the trend. This indicator helps you to determine the evolution of the price depending on how these astronomical objects are shown in the chart. When the comet seems to stop, it opens its tails considerably and warns us of a possible change in trend. On the contrary, when it seems to get speed (looks thin because lines of tail are grouped) demonstrates safety and continuity in trend. The head or comet nucleus will show red or green accordin
FREE
This indicator is based on the idea of a popular Trend Trigger Factor indicator (TTF). The indicator determines a price movement direction comparing high and low of the current candle with high and low of a price for a longer period.
The indicator parameters: Long_TTF_Bars - number of candles to calculate the price movement direction for a longer period of time (cannot be less than 2) Short_TTF_Bars - number of candles to calculate the price movement direction for a shorter period of time (can
FREE
優傲控制面板
UR 控制面板是我想免費與您分享的工具。 這是一個交互式面板,每天幫助我進行交易並加強我的市場掃描。 希望它也能滿足您的需求!
如何使用 UR 控制面板?
它是一個可移動、可調整大小的雙面板,其中: - 其中之一顯示給定時間範圍內的貨幣強度 - 另一個使選項能夠更快地在符號和時間框架之間移動,使用相同的圖表,並且另外顯示價格移動的給定通道內的阻力/支撐水平
設置 符號:啟用您通常使用的所有符號 Channel Trendline to Infinity:擴大通道方向 經紀人標誌:添加您的經紀人在您的符號上使用的特殊字符*如果有* 期間:設置貨幣強度計計算給定貨幣強度的時間範圍 UR 控制面板是我想免費與您分享的工具。 這是一個交互式面板,每天幫助我進行交易並加強我的市場掃描。 希望它也能滿足您的需求!
FREE

This is the author's trading system.
Designed for intraday trading. Signals are not rewritten. Suitable for any instrument and timeframe. You can enable alerts. Easy to use. See screenshots. Simple settings! Everything has already been done for you! The basis is the analysis of the current trend. The indicator is looking for a way out of accumulation. If you have been looking for a good trading system for a long time, then it is in front of you! Subscribe to my telegram channel, where we discu
FREE

The indicator displays signals according to the strategy of Bill Williams on the chart. Demo version of the indicator has the same features as the paid, except that it can work only on a demo account .
Signal "First Wise Man" is formed when there is a divergent bar with angulation. Bullish divergent bar - with lower minimum and closing price in the upper half. Bearish divergent bar - higher maximum and the closing price at the bottom half. Angulation is formed when all three lines of Alligat
FREE
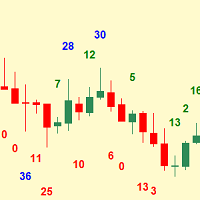
Simplest indicator for bar shadows. Very useful for Kangaroo Tail strategy.
"Shadows" - this is the distance from high and close of the bull bar and low and close of the bear bar. The purpose of the shadow is to show you if the bar is strong or not. Whether it is internal to the trend or is external. It even helps determine if a trend is starting. Input arguments: How many prevoius bars to calculate Value that should be passed to trigger the alarm How many times to repeat the alarm (Put 0 if y
FREE

OVERVIEW
K-means is a clustering algorithm commonly used in machine learning to group data points into distinct clusters based on their similarities. While K-means is not typically used directly for identifying support and resistance levels in financial markets, it can serve as a tool in a broader analysis approach.
Support and resistance levels are price levels in financial markets where the price tends to react or reverse. Support is a level where the price tends to stop falling
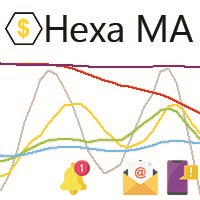
"The trend is your friend, until the end when it bends". The "Hexa MA" custom indicator is a trend following indicator. It uses 6 Moving Averages to spot the trend and follow, and also to filter the bad signals for the fast Moving Averages. The basic is simple, yet the strategy is powerful.
Recommended settings for the indicator : - Moving Average periods : SMA 5, SMA 10, SMA 20, SMA 50, SMA 100, SMA 200. - Timeframe : M15 is the default. But any timeframe can be used. - Currency pair : Since
FREE

The FxSProWPR oscillator generates signals for trend confirmation, which can also nbe used to confirm the emergence of new trends.
Indicator Parameters NumberBars - the number of bars to display the indicator. Too many bars may significantly slow down the operation of the trading terminal. SignalAlert - an Alert notifying of a trend. SignalSound - sound alert to notify of a trend. The sound will be played once the histogram exceeds the level of 15.
Rules to confirm position entry Green histo
FREE

Based on a combination of indicators, PS Acid Fulx is an excellent indicator for knowing when to buy or sell on any asset and temporaryity. The indicator myself I have used it as a tool for my analysis when trading Forex. It is a useful and easy-to-understand trend indicator. If you combine it with your own analyses you will surely get a good result in your operation.
FREE

Stairs Storm EA works on the principle of increasing the trading volume in a trend movement. The Expert Advisor must set SL and TP. Every day we try to improve the work of our advisor, therefore, over time, it will only get better.
Stairs Storm shows excellent results in the tester for 5 years, not a single month in the red. Average profit from 10 to 50% per month.
Recommendations
We recommend placing the EA on ECN accounts, 5 digits.
Currency pair EURUSD
Time frame M5, H1 Min.
FREE

This indicator is Demo version of FiboRec and works only on EURUSD This indicator depends on Fibonacci lines but there are secret lines I used. By using FiboRec indicator you will be able to know a lot of important information in the market such as:
Features You can avoid entry during market turbulence. You can enter orders in general trend only. You will know if the trend is strong or weak.
Signal Types and Frame used You can use this indicator just on H1 frame. Enter buy order in case Cand
FREE
The recommended broker for using this utility is RoboForex or a similar one, with fast order execution and low spreads. The purpose of this utility is to open new market orders, manage them, and turn losing trades into profits using an internal algorithm for handling losses, trend filtering, and various types of trailing stops and take profits. It is suitable for trading any instruments and on any timeframes. The algorithm works separately for buy and sell operations, allowing trading in both d
FREE
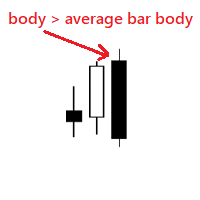
Very simple indicator that shows if body of a new bar is bigger than the average bar body. We can use the indicator to notice bars that are bigger than usual, for example this could mean a new trend. Input params: history bars to display from how many bars to get the average bar body To calculate only bars from the same type distance for the dots bull color bear color dot size
FREE

Rua Trend Pro This is an indicator that helps identify Trends relatively accurately. Can be used for any currency pair. And usable on all time frames. Recommended use from M15 and above. You can use it to identify trends, or to identify reversals very well. Input parameters: in_TradePeriod in_StopPeriod in_Alerts A product of Ruacoder Provide code indicator and EA services upon request
FREE
What is a tool ? This indicator use for forecast direction of the 28 pairs, Calculates from multiple pairs and timeframes and present by percentage as 70-79% , 80-89% , 90-100% is a little, medium and strong trend. How to use Place the indicator on any pair and any timeframe. Pair : Any Timeframe : Any Input Parameter No Visit my products Target Profit Magic Target Profit All The Profit Tracker Currency Scoring Pair Direction
FREE

Instant Trend Line this indicator has been designed for multi time frame
Buy Call: When the Blue Moving average (MA) line crossed above the Red Moving average (MA) . Sell Call: When the Blue Moving average (MA) line crossed below the Red Moving average (MA) .
Happy and profitable trade for ever!!! this indicator is suitable for all time frame, but our recommended time frame is above 15 min chart. Suitable to all the forex chart
FREE
ADR ST patterns is a modification of the classical ADR indicator. This simple indicator corresponds to the parameters specified in the ST patterns Strategy ( https://stpatterns.com/ ). Structural Target patterns are the market itself, which is consistently divided into components. For the formation of ST patterns , no trend lines, geometric proportions of the model itself, trading volume, or open market interest are needed. They are easily recognized and built only on the basis of breaking thr
FREE

This indicator displays the moment when the RSI oscillator crosses the zero value, and the moment when the RSI oscillator crosses its smoothed value. Crossing the zero value by the RSI oscillator is a buy/sell signal. If the RSI oscillator crosses its smoothed value, it is a signal of a trend change. The signal is given after the end of the formation of the candle. The signal is confirmed when the price crosses the high/low of the bar on which the signal was given. The indicator does not redraw.
FREE

Maltese cross GBP Универсальный инструмент для определения трендов, флетов и торговли по графическим паттернам. Объединяет техники Гана, Эллиота, Мюррея.
Просто разместите его на графике и он покажет направление и скорость движения цены, выделит разворотные моменты. Maltese cross поможет точно определять узловые моменты в истории, планировать торговые действия и сопровождать открытые сделки. Эта бесплатная демонстрационная версия MalteseCross ограничена GBPUSD и кроссами GBP. Никаких прочих
FREE

This indicator displays the signals based on the values of the classic RSI indicator on the price chart. The RSI can be used for determining the overbought or oversold areas on the chart. Reaching these levels means that the market can soon turn around, but it does not give signal, as in a strong trend the market can stay in the overbought or oversold state for quite a long time. As with most oscillators, the signals are generated when leaving these areas. This indicator allows to display three
FREE

Who needs this tool? 1-If you are a Martingale Trader, You need to look at this tool
2-If you are a Trend price channel Trader, you need to look at this tool Smarty Semi Automated EA This tool is a great help for scalpers who use grid or martingale. It is a next-generation smart trading tool. You adjust its trading parameter then you push a button to do all trading for you. However, it is a semi-automated EA so It does not start orders by its own. How it is working? The tool was designed to
FREE

基於 https://tradingstrategyguides.com/williams-percent-range-strategy/ 中確定的策略,但自動支持來自單個專家顧問實例的多種貨幣。還使用 SMA 慢速和快速交叉來確定趨勢方向。
外部策略的基礎是當 Williams %R 在上升趨勢中穿過 -50 時進行買入交易,並在下跌趨勢中進行賣出交易。
您可以控制趨勢週期和 Williams %R 範圍從中點到外部參數,
SINGLE_CURRENCY = true,此參數用於交易單一貨幣,但是,如果您想最大化您的盈利潛力,請將此參數設置為 false 並僅附加到一個圖表,此 EA 將交易在市場觀察窗口中選擇的那些貨幣在您的 Metatrader 4 終端上。
CONCURRENT_ORDERS = 0,此參數是您的策略管理,您可以在其中定義一次可以打開多少並發交易。
TREND_PERIOD = PERIOD_D1,此參數設置趨勢和威廉姆斯%R週期
SLOW_MA_PERIOD = 200,此參數設
FREE
学习如何在MetaTrader AppStore上购买EA交易,MetaTrader平台的应用程序商店。
MQL5.community支付系统支持通过PayPay、银行卡和热门付款系统进行交易。为更好的客户体验我们强烈建议您在购买前测试EA交易。
您错过了交易机会:
- 免费交易应用程序
- 8,000+信号可供复制
- 探索金融市场的经济新闻
注册
登录