适用于MetaTrader 4的EA交易和指标 - 19

In addition to understanding market trends and logic, surviving in the forex market requires a grasp of risk management, discipline, and a sound trading strategy. While the Grid EA you mentioned may offer a simplified approach, it's important to note that relying solely on grid trading without a deeper understanding of market dynamics and risk management could be risky. Grid trading strategies involve placing buy and sell orders at regular intervals or price levels, aiming to profit from market

The EA Bot strategy was developed with a foundation in market trends, support and resistance, and a hedging strategy. Additionally, it includes an auto-correction feature designed to mitigate risk during periods of high volatility and high-impact news. The EA Bot also incorporates a money management tool to ensure minimal trade entry during market vulnerability.

If you want to know what will happen in the future of the chart, you are in the right place. This indicator allows you to predict the future of the market with advanced computational methods and make the right deal by knowing the support and resistance points and receiving timely buy and sell signals. What does "Tendency" indicator show us? 1. Prediction line: Using mathematical calculations, the price is predicted in different timeframes and is interconnected. This means that based on the previ
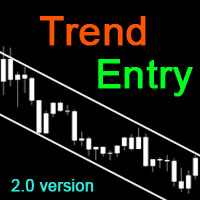
----< High Accuracy Entry Signals and Trend Indicator >----
TrendEntry could tell you the trend direction, resistance and support, when to open orders and where to set stoploss & takeprofit. this is a multifunctional indicator, can work well on all symbols and timeframes.
Features:
real-time analysis of trend direction filter out all the minor waves show resistance and support along as price goes give highly accurate entry signals frequently send alert in popup, email, notification way a
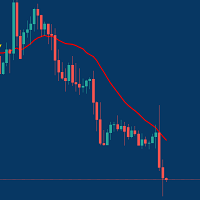
Managing Trades With Moving Average EA : Many Traders like using Moving Averages for trend confirmation , and timing Entry and Exits . With Semi- Automatic Moving Average EA we provide effective way to manage open trades as per your Moving average strategy and uses MA as trailing stop loss. EA considers only closing price of candle therefore avoids stop outs caused by sudden price fluctuations and helps to stay in trend longer. You can decide which MA to use and various settings of MA

This is a simple PriceTMA bands, non repaint! it can be used for a trend following system or sometimes reversals. as a main signal or a filter for others strategies, it depends on the trader main strategy. calculations for this indicator are a combined Algorithm between moving averages "MA" and average true range"ATR". good luck with your trading! i hope it is helpful Cheers

Trend Flasher
Trend is your friend is the age old saying quote in trading arena, there are though many ways to gauge the trend and its direction, more scientific measure and logically meaningful will be an ATR break outs to identify and spot the trend and its acceleration, so we created this easy to use trend identification panel and optimized super trend based multi time frame panel entry system to aid and help the traders to make their trading decision.
Unique Features of Trend Flasher
1
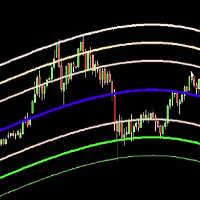
The Belkhayate center of gravity indicator is best used to confirm major turning points, and distinguish price extremes. Generally if price reaches the upper or lower levels one should expect a turn around coming soon, or at least a pull back towards the centre line if there is a strong trend. The upper and lower levels are red and green lines.
Our indicator use the same parameters as the well known trader M.Mostafa Belkhayate the inventor of the indicator, allow the use of buffers for your EA

Th3Eng HistoMaster indicator Free Histogram Indicator to detect the current trend direction. The indicator is based on CCI indicator. Also draw arrows when it detect the trend is strong buy or strong sell, with Alerting system (Popup with sound, Email alerting and mobile notification). Also draws a dashboard shows all Time-Frames' current signal.
Requirements
works with all pairs, stocks, CFDs and crypto currencies. works with all Spreads works with all Account types works on all Time-Frames
FREE

The GGP ADX and DI MT4 Indicator is used to quantify trend strength. ADX calculations are based on a moving average of price range expansion over a given period of time. This indicator is MT4 conversion of the ADX and DI Indicator by “BeikabuOyaji “ in Trading View website and some alert methods are added to provide real-time alerts when a trading signal is generated, in order to allow traders to act quickly and efficiently. For MT5 version please click here . ADX is plotted as a single line w
Check My Product Contact me to discover all my services
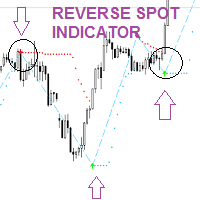
Reverse Spot is an indicator that can help you find and identify possible price reverse zones. This indicator can be used both as a trend continuation signal after a small period of consolidation or retracement and as a trend change signal.
Reverse spot is a very easy to use indicator and thanks to the signals it sends with the arrows it is easy for the trader to identify moments in which to evaluate his own operations.
Reverse Sp

Simple Trade Panel was created to make it easier to train forex trading skills in backtester and at the same time make it easier to live trade using trendlines with the push of a button. This ea is perfect for beginners who want to learn to trade manually because all of its features are equipped with basic tools for trading forex. How to trade properly : here
Main Feature:
1. Manage Open Positions + Trade Buy: allow buy + Trade Sell: allow sell
2. Manage pending orders + Delete trendl
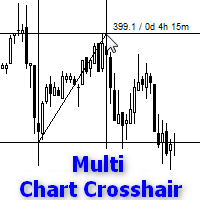
Indicator works like script and shows crosshair on all charts of any symbol. It can be used for comparison price levels and time periods on all charts of the same currency pair or for comparison candles according to time periods on charts of any symbols. You can also compare different types of charts, for instance standard chart with tick or range bar charts. Indicator can be easily attached to chart from navigator menu or using hotkey Ctrl + F, which you need to set manually. Moreover you can a

The system resembles the Italian flag and is simple for ordinary people to understand. Any trader with any experience will be able to use it. The Italy trading system generates 3 types of market conditions. Green zone - consider only buy trades. Red zone - consider only sell trades. Empty zone - flat, do nothing. Buy signal: Green zone + a blue arrow appears. Close all positions when an opposite signal (arrow) appears. Sell signal: Red zone + a red arrow appears. Close all positions when an oppo
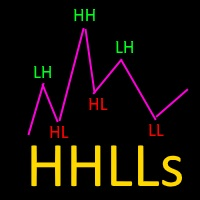
Based on Vitali Apirin's idea, here is a momentum indicator that he describes as a tool to help traders determine the direction of a trend. If the green line is over the red line, the trend is upward; if the red line is over the green one, the trend is downward. The indicator is made up of two separate calculations: the HHs or higher high stochastic, and the LLs or lower low stochastic, which together comprise the HHLLs. Vitali Apirin uses ideas he discovered while studying the stochastic oscill
This indicator uses candlesticks with large real bodies to predict possible market structure shift. Displacement is a very powerful move in price action resulting in strong selling or buying pressure. Generally speaking, displacement will appear as a single or a group of candles that are all positioned in the same direction. These candles typically have large real bodies and very short wicks, suggesting very little disagreement between buyers and sellers. Often, a displacement will occur just af

Moving Speed Scalper is a trading robot uses Scalping Strategy to find opportunities in the market and execute trades with a high probability of winning. The EA uses moving averages to filter the trend, although this trending strategy is simple it works well. Combine the relative volatility of price cycles to determine the best entry position. EA's strategy always uses Stop Loss to protect the account. The EA is suitable for accounts with small balances. You can refer to the Set Files at commen

Meet the Tweezer Hunter, an essential tool for every Forex trader looking to make accurate, trend-following trades. This powerful, intuitive indicator helps traders spot potential trend reversals before they happen, providing a significant advantage in the fast-paced world of Forex trading. The Tweezer Hunter is more than your average tweezer candle indicator; it's designed with a built-in trend identification feature that accurately detects whether the market is bearish or bullish. By integrat
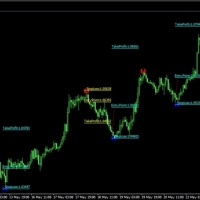
Best indicator for trend reversals How to use: wait for the candle to close above the entry price, then open the order Level lines appear when candle closes, The system shows you the best entry levels It is simple and easy to use, no additional settings are required. Best indicator for beginners and professionals By placing a pending order in the entry, you can set the displayed stoploss and the profit levels you want. You can use it alone or in addition to your strategy. All pairs with recom
The KT Buy Sell Volume is a powerful tool traders use to gauge the strength and weakness of price movements. In the whirlwind of the Forex market, traders aim to identify and ride the waves of a bullish or bearish trend that exudes strength and potential. However, recognizing these trends necessitates a method, metric, or indicator to quantify their strength. One crucial factor that traders examine for this purpose is volume. Volume refers to the number of shares or contracts traded in a securit

Certainly! An EA Exponential Moving Average (EMA) strategy is a trading or investment approach used in financial markets, particularly in the context of stocks, cryptocurrencies, and other assets. Here's an explanation in English: An Exponential Moving Average (EMA) strategy is a popular method employed by traders and investors to analyze price trends in financial markets. It's a technical analysis tool that helps identify potential buying or selling opportunities based on historical price data.

This is a volume profile that shows the volume with a fixed constant time frame that you set. The indicator also shows the maximum volume value (VPOC - VOLUME POINT OF CONTROL) and the average value, colors and settings you can adjust as you like, there are many possibilities. If you need an indicator that shows the variable volume range frames there is ...HERE... Volume Profile is an advanced charting study that displays trading activity over a specified time period at specified price leve

The Relative Momentum Index (RMI) was developed by Roger Altman, and introduced in his Feb 1993 article in Technical Analysis of Stocks & Commodities magazine. As its name suggests, Relative Momentum Index adds a momentum component to the traditional RSI, designed to increase reliability by decreasing spurious oscillations between defined overbought and oversold levels. This Relative Momentum Index indicator has 2 components. A change in RMI line color provides a warning signal for an upward or
Welcome to the world of advanced trading with the MACD Multicurrency Scanner! Maximize your trading experience with our powerful MT4 indicator designed for seamless analysis and real-time insights. Key Features: Effortless MACD Scanning: Unlock the full potential of the MACD Multicurrency Scanner by effortlessly scanning multiple currency pairs. Receive instant alerts when specific Moving Average Convergence Divergence (MACD) conditions are met, ensuring you stay ahead of market movements. Comp
Welcome to the world of advanced trading with the Bollinger Bands Scanner! Maximize your trading potential with our powerful MT4 indicator designed for seamless analysis and real-time insights. Key Features: Effortless Bollinger Bands Scanning: Unlock the full potential of the Bollinger Bands Scanner by effortlessly scanning multiple assets. Receive instant alerts when specific Bollinger Bands conditions are met, ensuring you stay ahead of market movements. Comprehensive Dashboard Insights: Gai
In the trading world a golden rule that stuck with me is "hold on to your winners and cut your losers short". This golden rule is how this EA gains a positive advantage.
The EA is based on the indicator Trendy Trader. As stated unlike a standard moving average this unique algorithm will show you a less choppy signal resulting in a smoother and easier trend to follow.
Put simply when price moves above the average it signals a bullish trend and when price moves below the average it signals a
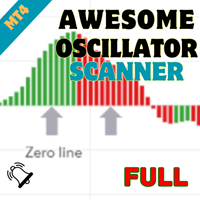
Welcome to the world of advanced trading with the Awesome Oscillator Scanner! Maximize your trading experience with our powerful MT4 indicator designed for seamless analysis and real-time insights. Key Features: Effortless Awesome Oscillator Scanning: Unlock the full potential of the Awesome Oscillator Scanner by effortlessly scanning multiple currency pairs. Receive instant alerts when specific Awesome Oscillator conditions are met, ensuring you stay ahead of market movements. Comprehensive Da

Super Trend Bars is a trend finding indicator. It tries to find the trends that are most likely to trend. A set of indicators and a set of algorithms. Trend probability changes color when it finds a high trend. The red color represents the declining trend. The lime color represents the upward trend. Super Trend Bar changes color when it finds a trend.
Features This indicator is a trend indicator by itself. It can operate without the need for additional indicators. When you see the first lime c

My Intraday trading session indicator. SL Session Strength 28 Pair https://www.mql5.com/en/market/product/57585 This strategy is even used by the Banks to make profits. They take a strong currency and pitch against a weak currency This indicator allows you to analyze the hidden trends and correlations between the 8 most traded currencies via unique strength meter which creates multiple charts in a single window based on the price action of each currency in relation to all other currenci

Description: The indicator shows the TDI indicator in a separate window, and with the RSI component, the indicator finds possible divergences with M or W patterns. KEY LINKS: How to Install - Frequent Questions - All Products Functions: Finds Market Makers patterns. Finds extremes or exhaustion into the market. Looks for a trend continuation. Content: TDI Indicator Divergence and M or W Signals Note 1: This indicator should only be considered as a part of any trading strategy. You shoul
The indicator measures the buying and selling force between the buyers and sellers in the form of a histogram/oscillator by using a BOP equation:
BOP = Moving Average of [close – open)/(high – low)]
Igor Levshin first introduced the Balance of power in the August 2001 issue of Technical Analysis of Stocks & Commodities magazine.
Features
Quickly find the buying and selling pressure among the traders. It comes with simple inputs and an interface. All Metatrader alerts included.
Appli

Are you a day/week/month trader, or even a quick scalper? MCTS will show you the best trending currencies to trade on any timeframe. By using a unique algorithm MCTS measures the strengths of individual currencies and then combines them into pairs to show you the best pairs to trade. Monitor all 8 major currencies and all 28 pairs. Monitors the strengths of the following currencies: EUR, USD, GBP, JPY, AUD, NZD, CHF, CAD. Measure the true strength of a currency on any timeframe. Know which curre

THIS EA IS DESING TO USED IN BTCUSD
Do you want to accompany Criptotrading to the next level of bitcoin trading?
You just have to download it and try it yourself. Also testing it is free. Are you not going to try them?
Criptotrading it is a Secure Automated Software for trade Forex market and indices.
The architecture is a Fully Automatic Autonomous Robot Expert capable of independently analyzing the market and making trading decisions
Criptotrading It is an advanced and profe

GG TrendBar Indicator - Your Multitimeframe ADX Trading Solution Experience the power of multi-timeframe trading with the "GG TrendBar Indicator." This versatile tool, built upon the ADX indicator, offers precise insights by considering multiple timeframes, ensuring you make well-informed trading decisions. Basic Details : Indicator Type : GG TrendBar Indicator (Multi-Timeframe ADX) Key Metrics : Real-time ADX analysis across multiple timeframes. Customization : Enable or disable specific timefr

This is the multi-time frame Fisher Divergence indicator for MetaTrader 4, with signal arrows and a Signals panel which is freely movable showing the last signals and their time in color. The indicator draws some lines based on signal time. On the time frames below H4, the indicator scans for H4 divergence signals and draws it on chart with thick trend lines, and also it draws arrows for them. And also it scans the current time frame and draws a line at divergence location and places signal arro

Trendfinder SMA With Zone and Alert are Colored candlesticks showing the trend based on two SMA as Signal and two SMA as a Buy and Sell Zone and the slope of the slow moving average. This indicator will give you the color change on the next bar on the confirmation candle and will provide alert on Buy and sell signal, when it enters the buy and sell zone and when the market test the buy or sell zones as support or resistance and will never repaint . This indicator has the following: 2 SMA for th

Introducing Full Pro Shooter, an innovative Expert Advisor created for traders who are looking for a safer strategy in transacting on the forex market This EA combines of Hedging & Averaging strategy to deliver a robust and profitable trading system.
This EA has passed a 5++ year backtest
Key Features: Averaging : Full Pro Shooter maximizes profits while managing risk through an averaging. The take profit level for all positions will be adjusted to the averaging number of positions that ar
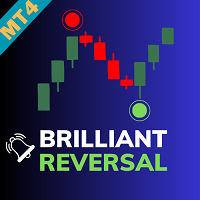
Brilliant Reversal Indicator - Your Ultimate Alert-Driven Trading Solution Unlock the potential for unparalleled trading success with the "Brilliant Reversal Indicator." This powerful tool has been meticulously designed to empower traders by identifying critical reversal opportunities with lightning-fast alerts. Key Features : Precise Reversal Detection : The Brilliant Reversal Indicator specializes in pinpointing potential trend reversals, helping you seize opportunities to enter or exit positi

このインディケータはボリンジャーバンドを裁量およびEAで実際に利用してきた私自身の経験から、より手軽に、かつ効果的に活用できるよう作成された裁量トレード用サインツールです。 ブレイクアウトでの順張り、リバウンドでの逆張りの両面で利用でき、各種のフィルター機能でより精度の高いサインを発信します 勝敗判定機能により、このインディケータの直近の相場環境に対する有効性を確認できます 全通貨ペア、全タイムフレームで利用できます。リペイントはしません
設定項目は以下の通りです。 Bollinger Bands Period
Bollinger Bands Deviation
Bollinger Bands Shift
Entry Mode ...ボリンジャーバンドにタッチしてからのBreakout(順張り), Rebound(逆張り)のどちらかを指定 Plus Filter ...独自アルゴリズムによるフィルターでシグナルの精度を高めます(Reboundモード専用) Trend Filter ...下で設定する移動平均のトレンド方向でのシグナルに限定します Moving Aver

After 7 years I decided to release some of my own indicators and EAs for free.
If you find them useful please Show support with a 5-star rating! Your feedback keeps the free tools coming! See other my free tools as well here
_________________________________ Volume Moving Average (Volume MA) Indicator for Advanced Forex Market Analysis Introducing the Volume Moving Average (Volume MA) Indicator, meticulously developed in MQL4, a pivotal tool for enhancing your forex trading str
FREE

This indicator provides several drawing tools to assist in various methods of chart analysis.
The drawings will keep their proportions (according to their handle trendline) across different chart scales, update in real time, and multiple drawings are supported.
#
Drawing Option
Description
1 Grid box draggable boxed grid, user defines rows x colums, diagonal ray option 2 Grid partial or fullscreen grid, sized by handle line 3 Grid flex a diagonal grid, sized and sloped by handle line

EA Setting, Common Common
1)Long & Short -allow EA open short and long position
Live Trading
1)Tick -Allow live trading
Safety
Tick All
1)Allow DLL import
2)Allow import of external experts
3)Allow modification Signal settings Inputs Variable Value Remarks Open new series true Make it default Trade BUY true Make it default Trade SELL true
Make it default Support manual order true
Make it default Max sell order 10 You may co

Indicator Rua Alert Line. This indicator will notify when the High-price of candle breaks any TrendLine or HorizontalLine on the chart. Notifications will be sent to the phone and on MT4. And it have ArrowBuy/ArrowSell on chart. It is very useful for those of you who use the TrendLine or HorizontalLine but do not have time to observe the chart. RuaCoder Zalo_Tel: 033.818.8914 Telegram : https://t.me/Ruacoder

Pivot Points และระดับ (Support) และ(Resistance) บนแผนภูมิการเทรดใน MetaTrader 4 สำหรับตลาด Forex : คำนวณ Pivot Points : สคริปต์คำนวณจุด Pivot โดยใช้ข้อมูลราคาประวัติศาสตร์ เช่น ราคาเปิด, ราคาสูงสุด, ราคาต่ำสุด, และราคาปิด จากช่วงเวลาที่กำหนด (เช่น วัน, ชั่วโมง, ฯลฯ) จุด Pivot และระดับต่างๆ เช่น R1, R2, R3 (ระดับการต้านทาน) และ S1, S2, S3 (ระดับการสนับสนุน) ถูกคำนวณออกมา แสดงบนแผนภูมิ : หลังจากคำนวณจุด Pivot และระดับต่างๆ, สคริปต์จะแสดงเส้นเหล่านี้บนแผนภูมิ MT4 เพื่อช่วยให้นักเทรดสามารถเห็นจุดที่
This indicator computes Chaikin Money Flow (CMF) which is very useful to identify price trend. The indicator provides alerts when upper or lower levels (specified by user) are crossed by CMF. You can decide to receive a standard alert on MT4 and/or a push notification on your Metatrader app. You can configure the indicator by also specifying: • CMF periods • Levels at which the alert is provided
Link Telegram Channel for help settings

KT Heiken Ashi Alert plots the buy and sell arrows and generate alerts based on the standard Heiken Ashi candles. Its a must use tool for the traders who want to incorporate Heiken Ashi in their trading strategy. A buy arrow plotted when Heiken Ashi change to a bullish state from bearish state. A sell arrow plotted when Heiken Ashi change to a bearish state from bullish state. Mobile notifications, Email, Sound and Pop-up alerts included.
What exactly is Heiken Ashi? In Japanese, the term Hei

Strategy quick description :
- Forex trading on H1 time unit
- The daily pivot point (DPP) defines the trend
- Buy or Sell when SMA15 cut with DPP regarding SMMA5 and RSI10 and the last candle values
- Close positions when SMA15 cut-reversed DDP
- Do not take position before the 02:00 AM
- Multiple positions are allowed, default = 5 positions
- Risk management, default Exposure = 1% for each order
- Use of a Stop Loss
- Positions can stay opened several days
- Do not take positi

Description Better version of RSI indicator which offer a complete visual trading strategy and realize an auto-optimization Support: We create great tools for the entire trading community. Most of them are free. If you believe in what we do Support Us Here. KEY LINKS: How to Install – Frequent Questions - All Products How is this indicator useful? NEVER repaints. Detect best parameters of RSI indicator, based on profit factor during the specified period. This indicator can be used as

MA Multi-Currencies Multi-Timeframes Histogram BUY/SELL Indicator up to 6 currencies on time calculations based on 6 time frames : M5, M15, M30, H1, H4, D1 Trading Strategies: **TREND shifts to UP trend when Green point appears after Red and Gray points -> Close SELL positions then add new BUY positions on new Green points **TREND shifts to DOWN trend when Red point appears after Green and Gray points -> Close BUY positions then add new SELL positions on new Red points ** Close BUY position

Introducing the SPYDER AI Intraday EA , a revolutionary forex expert advisor that combines cutting-edge technology with the power of CHATGPT and AI to navigate the complex world of currency trading. Designed to excel in both trending and ranging markets, SPYDER AI Intraday EA brings a new dimension to your trading experience. Telegram for live updates(myfxbook) and huge discount - https://t.me/botshub670 With a special focus on the AUDNZD , AUDCAD , and EURGBP currency pairs, SPYDER AI Intraday

This EA is a free version of Tiger Grid which is available here: https://www.mql5.com/en/market/product/33835
Tiger Grid EA is an expert advisor using trading strategy which has been developed by using machine learning concepts. It has passed 14 years of backtest of real tick data and real variable spread (with commission) from 2004 to 2018. The entries are usually accurate and in case if the trend signal has a delay the positions will be managed by a smart grid system. This system uses a g
FREE
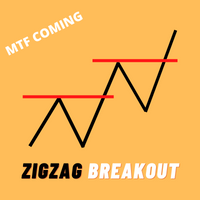
MTF Update will be soon
Price Increase Soon, It just Off price only for first 10 copies. ZigZag Breakout Arrow Very high accurate buy and sell signals provide , you can also use as market reverse signal or Trend change alert Features. ZigZag Parameters changeable. Alerts. Buy and Sell Signal. ZigZag Breakout on candle close or candle high price. and MTF Update will coming soon.

Unlock the power of precision in your trading strategy with Std Dev Channel, the innovative indicator designed to revolutionize your approach to market analysis. Crafted as an advanced version of the standard deviation indicator, Std Dev Channel empowers traders with enhanced insights into market trends and volatility patterns. With Std Dev Channel, harness the synergy of statistical analysis and technical charting to make informed trading decisions. This cutting-edge tool meticulously calculate
FREE

This scanner is monitoring the entire market for trade opportunities for all symbols and for all time frames. This scanner will alert you on your computer, or on your mobile, when a trade opportunity has been found. Three moving average strategy
The three moving average strategy is a very popular and proven strategy. The slowest moving average is used to determine the direction of the trend. If the price is above the slowest moving average, we are in a Bullish market and if the price is belo
06/30/23 v1.1 New features.
Read before operate. Remarkable configurations: 1) "No close order", "Auto-Hedging" FALSE, "Close all" FALSE : You can transform this EA in a assistant that simply open orders. After you will be the mind of the operativity. Warning : find a good setting of "Pause in minute" and "Max alert" to delay the operativity and filter the wrong signals. These last parameters can change by market condition and asset.
2) "Breakeven and WPR inversion", "Auto-Hedging" FALSE, "C
FREE
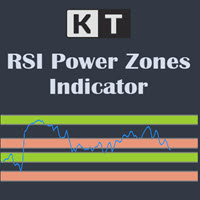
The KT RSI Power Zones divides and shows the movement of RSI into four different power zones to identify the potential support and resistance zones using the RSI.
Bull Support The bull support ranges from 40 to 50. The price is expected to reverse to the upside from this zone.
Bull Resistance The bull resistance ranges from 80 to 90. The price is expected to reverse to the downsize from this zone.
Bear Support The bear support ranges from 20 to 30. The price is expected to reverse to the

PREVIOUS INDICATOR’S DATA MA CROSSOVER https://www.mql5.com/en/users/earobotkk/seller#products P/S: If you like this indicator, please rate it with 5 stars in the review section, this will increase its popularity so that other users will be benefited from using it.
This indicator notifies and draws an arrow on the chart whenever the MA line has crossed over its previous indicator’s data MA filtered by MA Trend. It also displays total pips gained from all the entry set-ups. Setting · You
FREE

Mr. Averager MT4 is a Expert Advisor for the MetaTrader 4 trading terminal. The trading algorithm is based on the principle of position averaging. Due to averaging, the EA is not sensitive to the quality of entry points and can work almost at any time and in almost any market. The EA supports 2 trading modes: Automatic start and Manual start. In Automatic start mode, the EA independently starts a new series of orders. In Manual start mode, the first order of the series is opened manually using
Signal Trend Super
Indicator of accurate market entry.
Very good entry indicator for your trading system, I recommend to use it together with - System Trend Pro and Professional Trade Arrow
The indicator does not redraw and does not change its data. Wait until the candle closes.
Any questions? Need help?, I am always happy to help, write me in private messages or
In Telegram

The Icarus Reversals(TM) FREE Indicator is a powerful tool to identify high-probability reversal points, across all instruments. The Reversals Indicator provides traders and investors with a simple-to-use and highly dynamic insight into points of likely price-action reversals. Generated by a unique proprietary code-set, the Reversals Indicator (FREE version) generates long and short trade signals, which can be customised for key inputs and colourisation. Settings of the Icarus Reversals FREE h
FREE

"Wouldn't we all love to reliably know when a stock is starting to trend, and when it is in flat territory? An indicator that would somehow tell you to ignore the head fakes and shakeouts, and focus only on the move that counts?" The Choppiness Index is a non-directional indicator designed to determine if the market is choppy (trading sideways) or not choppy (trading within a trend in either direction). It is an oscillating indicator between -50 (very trendy) and +50 (very choppy). There are man

Robin Scalper indicator is calculated based on advanced algorithm of several indicators.
The algorithm provides highly reliable entry points, and its simple settings allow using it for all symbols, time frames and trading styles.
Signals are generated at the closing of a bar and are not repaint .
Setting Parameters : Indicator Name - Indicator Name. Trend Period - Trend Period of the indicator. Filter - Signal smoothness. EMA fast Filter - Fast EMA filter. EMA slow Filter - Slow EMA

With the Trend and News indicator you will always be up to date!
Tells you in which direction it is safer to open positions 3 in 1: trends + news + news influence index
news for the selected period actual trends for five timeframes (M5, M15, H1, H4, D1 by default)
news impact index calculated by assessing the actual values of published news
News Displayed on the chart as vertical lines with a description in the form of a tooltip The text displays two news: the previous published and the ne

Classic indicator. The Fractals indicator analyzes the price patterns that form on the candlestick chart and display the reversal points of the market trend. The indicator consists of candles, the middle of which is either the highest (up fractal) or the lowest (down fractal). Highs and lows, indicated by the indicator on the chart, are recommended to be taken as points that form support and resistance lines. Unlike the original indicator, where fractals are formed by five candles (high/low in t
FREE

By default Metatrader will show any newly created chart object on all timeframes.
This handy utility will set the visibility of any new chart object drawn to be that of the current chart only.
e.g. If the chart timeframe is H4 then a new object will only be visible on the H4 timeframe.
Each object type can be included or excluded as required and, of course you can change the timeframes setting afterwards as this only operates at the point the chart object is created.
Add to your chart a
FREE

Check the Trend Power This indicator is designed to identify the POWER of trend. This is NOT define bullish or bearish trend. It is quite easy to look at the power when the indicator line turns Green the trend are strong when the indicator line turns Red the trend are Weak strategy for trade is : Open possition only when the power go Green Exit possition when the power change to Red
FREE

The Green Dragon is a strategy that uses the Ichimoku Kinko Hyo system to place trades. The primary element of the Green Dragon is the use of the Chinkou Span as it crosses price action to place trades. This is a classic strategy of the Ichimoku even though its not as popular as some of the other strategies. The Chinkou Span is normally thought of as a market momentum indicator and used to give a trade set up more conviction when analyzing price movement. I find this description somewhat vague a
FREE
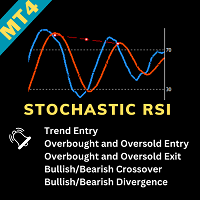
Stochastic RSI Indicator - Master the Art of Timing Elevate your trading game with the "Stochastic RSI Indicator." This powerful tool marries the Stochastic oscillator with the Relative Strength Index (RSI), offering precise insights into market dynamics. It's your key to mastering the art of timing in trading. About the Indicator : The Stochastic RSI Indicator combines two robust indicators - Stochastic and RSI - to provide traders with an exceptional tool for identifying entry and exit points
FREE

EA_Mrk_Test
In fact, this is the free version of EA_Mrk_Full . The algorithm for generating trading signals is exactly the same, the difference is that you cannot change any parameters here, except for GMToffset .
The Expert Advisor uses all the good practices from previous versions, but here it is applied a completely different approach to the formation of trading signals. Based on a paradigm "following the market", when instead of trying to forecast a trend change is determined post factu
FREE

GoldTrend MT4 - is a leading indicator for Gold on MetaTrader 4
- In Update version has been added new ability on USD pairs
( AUDUSD, EURUSD, GBPUSD, NZDUSD, USDCAD, USDCHF, USDJPY )
- very easy to use , even for beginners
- Stoploss and Take Profit provided - no repaint, no redraw and no lagging
When you decide to enter the global market , then there is a technical skill you absolutely must have, - which is all about trends .
Why - GoldTrend is different from others :
Not onl
MetaTrader市场是一个简单方便的网站,在这里开发者可以出售自己的交易应用程序。
我们将帮助您发布您的产品,并向您解释如何为市场准备您的产品描述。市场上所有的应用程序都是加密保护并且只能在买家的电脑上运行。非法拷贝是不可能的。
您错过了交易机会:
- 免费交易应用程序
- 8,000+信号可供复制
- 探索金融市场的经济新闻
注册
登录