适用于MetaTrader 4的EA交易和指标 - 13

Make grid trading safe again | Built by a grid trader >> for grid traders.
Walkthrough Video <== Get Grid Rescue up and running in 5 minutes This is MT4 version, click here for BlueSwift GridRescue MT5 (settings and logics are same in both versions) BlueSwift Grid Rescue MT4 is a risk management utility EA (used together with other grid trading experts) that can help you trade aggressive grid systems with manageable drawdown, therefore reduce substanstially margin call risk as w

The HedgeFund Experiment This is a basic version of the professional version; The HedgeFund Manager https://www.mql5.com/en/market/product/85241 It is a multi-currency EA that needs only to be loaded in one chart. It will access all Forex pairs or CFD provided by your broker and will only trade those with a spread less than or equal to MaxSpread specified in the settings. It uses standard Metatrader4 indicators to generate signals but with a customized trend filter to pick which pairs to includ
FREE

用於確定平面和趨勢的指標。 如果價格低於兩條直方圖和兩條線(紅色和藍色)中的任何一條,則這是一個賣出區域。 購買此版本的指標時,一個真實賬戶和一個模擬賬戶的 MT4 版本 - 作為禮物(收到,給我寫私信)! 如果價格高於兩條直方圖和兩條線(紅色和藍色)中的任何一條,則這是一個買入區域。 MT4 版本: https://www.mql5.com/en/market/product/3793
如果價格在兩條線之間或在任何直方圖的區域內,那麼市場就沒有明確的趨勢。簡單地說,市場是平的。
指標的工作在屏幕截圖中更清楚地顯示。 該指標可用作獨立的交易系統。該指標可用於獲取領先數據或確定當前趨勢的方向。對於任何級別的交易者來說,這都是一個很好的工具!

Donchian channels are a tool in technical analysis used to determine the relative volatility of a market and the potential for price breakouts.
Can help identify potential breakouts and reversals in price, which are the moments when traders are called on to make strategic decisions. These strategies can help you capitalize on price trends while having pre-defined entry and exit points to secure gains or limit losses. Using the Donchian channel can thus be part of a disciplined approach to manag
FREE

Th indicator is a technical analysis tool that helps identify significant changes in price trends and filter out minor price fluctuations. It is used to highlight price swings and provide a clearer picture of market movements. The Pivots are found by checking if a certain candle is the highest/lowest in a given number of candles that come before and after it. This indicator has only one input, its period. The Higher the period, the more strict the indicator is about what constitutes a Pivot. Th
FREE

BeST_ Classic Pivot Points is an MT4 Indicator that is based on the widely known and definitely classic Pivot Point of a market prices activity. A pivot point is calculated as an average of significant prices (high,low,close) from the performance of a market in the prior trading period. If the market in the following period trades above the pivot point it is usually evaluated as a bullish sentiment, whereas trading below the pivot point is seen as bearish. A pivot point and the associated suppo
FREE
Pipfinite creates unique, high quality and affordable trading tools. Our tools may or may not work for you, so we strongly suggest to try the Demo Version for MT4 first. Please test the indicator prior to purchasing to determine if it works for you. We want your good reviews, so hurry up and test it for free...we hope you will find it useful.
Attention This trading tool is specifically designed to help grid, martingale, averaging, recovery and hedging strategies. If you are not familiar with t
Tipu Parabolic SAR Panel is the modified version of the original Parabolic SAR indicator published by MetaQuotes here . Dashboard Panel (multi symbol) version for this indicator is available here .
Features An easy to use Panel that shows the Parabolic SAR trend and signals of selected timeframe. Customizable Buy/Sell alerts, push alerts, email alerts, or visual on-screen alerts. Customizable Panel. The panel can be moved to any place on the chart or minimized to allow more space. To enable th
FREE

HEDGING MASTER line indicator It compares the power/strength lines of two user input symbols and create a SMOOTHED line that indicates the degree of deviation of the 2 symbols Strategy#1- FOLLOW THE INDICATOR THICK LINE when CROSSING O LEVEL DOWN --- TRADE ON INDICATOR THICK LINE (TREND FRIENDLY) !! Strategy#2- TRADE INDICATOR PEAKS (Follow indicator Reversal PEAKS Levels)!! you input - the index of calculation ( 10/20/30....) - the indicator Drawing start point (indicator hi

This indicator is not only for trading but also for learning, thanks to it, you can learn to identify trend, support and resistance.
You've probably heard about the Dow trend theory, where higher highs and higher lows indicate an uptrend, and lower highs and lower lows indicate a downtrend. This indicator determines this trend based on the Dow Theory. You just need to enter a number representing the number of candles between extremes. The optimal solution is the number 3 (H1 TF), unless you
FREE

Lisek Stochastic oscillator indicator with Alarm, Push Notifications and e-mail Notifications. The Stochastic indicator is a momentum indicator that shows you how strong or weak the current trend is. It helps you identify overbought and oversold market conditions within a trend. The Stochastic indicator is lagging indicator, which means it don't predict where price is going, it is only providing data on where price has been !!!
How to trade with Stochastic indicator: Trend following: As lon
FREE

GTAS S-Trend is a momentum indicator that helps to determine trends using combination of MACD, RSI and moving averages. This indicator was created by Bernard Prats Desclaux, proprietary trader and ex-hedge fund manager, founder of E-Winvest.
Description The indicator oscillates between -65 and +65 with a neutral zone between -25 and +25 around a 0 equilibrium line. S-Trend between -25 and +25 indicates congestion zones with a bullish bias between 0 and +25, and a bearish bias between 0 and -25
FREE
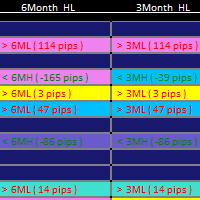
1. Updated usage instructions in blog below: Smart Market Structure Trading System and Automatic Scanner - Trading Systems - 13 October 2023 - Traders' Blogs (mql5.com) https://www.mql5.com/en/blogs/post/754495 2. The Smart Market Structure Opportunity Scanner is a great tool to find trading entries and exits based on Smart Money Concepts. It has a build-in custom choice of Forex pair lists to choose from for the scan, and it also has a user-defined entry choice to put down your own list of Fo
FREE

Pipfinite creates unique, high quality and affordable trading tools. Our tools may or may not work for you, so we strongly suggest to try the Demo Version for MT4 first. Please test the indicator prior to purchasing to determine if it works for you. We want your good reviews, so hurry up and test it for free...we hope you will find it useful.
Combo Energy Beam with Swing Control Strategy: Confirm swing pullback signals Watch Video: (Click Here) Energy Beam with Trend Laser Strategy: Confirm Tr

Identification of support and resistance areas
A useful indicator for traders
completely free
Can be used in all symbols
Can be used in all time frames
It has three different trends: short term, medium term, long term
Settings:
Clr1,2: You can change the color of the lines
Type Trend: You can determine the trend
Message me for questions, criticism and suggestions
FREE

This indicator calculates and draws lines over the chart. There are two types of trends: Trend A: the line is drawn using local lows for uptrends and local highs for downtrends Trend B: the line is drawn using local highs for uptrends and local lows for downtrends There are a few conditions, which have to be fulfilled and can be changed by the parameters (see also picture 4): MinBarAge : the count of bars to the last base point of a line is called BarAge and has to be greater than the parameter
FREE

MT5版本 | Valable ZigZag指標 | FAQ 艾略特波浪理論是對金融市場過程的一種解釋,它基於價格圖表上波浪的視覺模型。 根據這個理論,我們可以確切地知道現在市場上盛行的趨勢是向上還是向下。 Valable ZigZag 指標 顯示了 市場的波浪結構 ,並指示了當前時間框架內當前主要趨勢的方向。 為方便起見,Trend Monitor VZ 指標將在圖表上顯示所有時間範圍的趨勢方向,以及您交易的整個貨幣對列表。 在一張圖表上全面了解所有工具的市場狀況,以做出正確的交易決策! Valable ZigZag 指標 非常穩定 ,不會像經典的 ZigZag 那樣經常改變方向,使交易者感到困惑。 這是通過使用分形來繪製指標的波浪來實現的。 Valable ZigZag 指標首先是一個趨勢指標 。 它設定了交易者應該交易的主要方向,Trend Monitor VZ 指標給出了當前市場正在發生的事情的總體思路。 例如: 如果 EURUSD 貨幣對的所有時間範圍內的指標都顯示向上箭頭,則表明上升趨勢已經確立。 現在入市為時已晚,因為很可能市場已經超過了足夠多的點,並且有可能出現

There are only a limited number of copies left, priced at 390 USD . After that, the price will be raised to 500 USD. All backtests were done with a modelling quality of 99.90%. The EA can trade on 7 currency pairs. To trade, you will need an ECN, RAW, STP or NDD account, which charges commissions and fees but gives a small spread. To trade you need the correct name of the currency pair without prefix and suffix and extra dot, otherwise you need to change the name of the currency pair in the

This tools is design to easily forecast the projection of the current trend through the inputs of Zigzag and get out of the market when the trend do not the ability to maintain it's volatility to go further... the indicator gets the initial and final price from the value of zigzag automatically by adjusting the intdepth of zigzag. You can also switch from Projection to Extension from the inputs tab of indicator.
FREE

Volatility Limit Trend Indicator (VLT), an original indicator by this developer, is a trend indicator based on setting a fixed volatility limit as a percentage of price. Volatile price is allowed to wander between two channel lines defining the fixed volatility about a central line. The price crossing one of the channel lines defines an exceeding of the allowed volatility, and ushering in one of two situation : either a continuation or a reversal of trend. The first buffer of the indicator (not
FREE
HMA Grid EA is a grid system which analyzes trend based on the Hull Moving Average (HMA) indicator. Unlike the Simple Moving Average (SMA) the curve of HMA attempts to give an accurate signal by minimizing lags and improving the smoothness. This EA proposes two trading strategies which combine a slow period HMA to identify the main trend and a short period HMA to identify short trend reversal movement. This combination make usually sell and buy signals accurate and in case if the trend reverse w
FREE

MACD (short for Moving Average Convergence/Divergence) is one of the most famous and oldest indicators ever created and is widely used among beginners . However, there is a newer version of the MACD that is named Impulse MACD which have less false signals than the standard MACD. Classic MACD helps us to identify potential trends by displaying crossovers between two lines. If MACD line crosses above the Signal line it shows us that the market is potentially up trending and that it would be a go
This indicator implements the logic behind Traders Dynamic Index to the classic MACD Indicator. It helps to find powerful trende changes and ignore meaningless ones. It is simply the classic MACD indicator plotted with volatility bands on top designed with the sole purpose of being able to ignore trend changes that do not follow an over-extension or over-contraction of the market. The indicator alerts on trend changes after the volatility bands have been breached and implements alerts of all ki
FREE
The work of the utility is directed at opening new market orders, maintaining them, transferring the unprofitable orders into profit using an internal loss handling algorithm, trend filtering and various types of trailing stop and take profit. Suitable for any instruments and timeframes. The algorithm works separately for buys and sells, which allows simultaneously working in both directions as well. For the event when the additional orders opened by the utility do not become profitable, a Stop
This indicator analyzes in parallel price charts for multiple currency pairs on all timeframes and notifies you as soon as a double tops or double bottoms pattern has been identified.
Definition Double Top / Double Bottom pattern Double Top is a trend reversal pattern which are made up of two consecutive peaks that are more and less equal with a trough in-between. This pattern is a clear illustration of a battle between buyers and sellers. The buyers are attempting to push the security but are

BeST_Gann Swing Oscillator is an MT4 indicator that is based on the corresponding work of Robert Krausz who introduced it in the book “ A.W.D Gann Treasure Discovered ” .
The Gann Swing Oscillator is a range-bounding technical indicator that oscillates between +1 and -1 and thus it describes the market swings.
Generally when the market is in an upswing, the Gann Swing Oscillator describes it as 2 higher highs with the value of +1 while after an upswing, the downswing is expected.
Also the do

Big summer sale. Save up to 40% on my products. Supply & Demand dashboard - save 10$! The Netsrac Supply&Demand Dashboard shows you at a glance where relevant zones are located on your favorite assets. Open your chart directly from the dashboard and trade zones that really matter. Features
Finds the next relevant supply and demand zone and displays the distance to this zone (in pips) Finds and displays the zones in three different timeframes Calculates a trend indicator for the current and past

Leo Trend is a signal indicator that shows the market entry points, as well as the trend direction and flat on the chart in the form of arrows and lines. Leo Trend will be useful both for beginners creating a trading strategy, and for professionals to integrate into ready-made trading systems. Leo Trend works without redrawing and without significant delays. The operation of the indicator is demonstrated in the video. In addition, you can test this indicator in the strategy tester free of charge
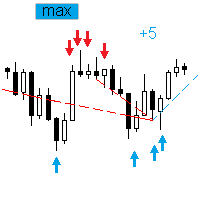
The Expert Advisor trades the signals from an artificial neural network with one hidden layer. Presence of a signal is checked at the closing of the specified period. MAIN PARAMETERS Net option - setting the order grid. When placing a market (not pending, Pending order offset=0 ) order according to a signal, the grid order is set. The following direction are available: follow the trend , against the treand and both directions . The number of placed orders is taken from the ...maximum deals with

Welcome to the trading world with Trend Candle Pumper – your reliable buddy in the financial markets! Trend Candle Pumper is a smart trading bot designed for those who want to dive into the investment scene without being experts in trading. How it Works: Trend Candle Pumper uses advanced artificial intelligence algorithms to analyze trends in financial markets. But what's a trend? Simply put, a trend is the overall direction an asset's price is moving. Our bot keeps an eye on this direction and

Rsi indicator and Stochastic Combined into one indicator , the Supreme StochRsi doesnt repaint / Back-paint / delay. can be used as overbought oversold strategy , or trend following on 50 level cross. if you like this indicator please check my Supreme Trendhisto: here , and my Supreme Diamond indicator : here ========================================================================= Parameters : Stochastic K and D value , Stochastic period Rsi Period Rsi price ====================================
FREE
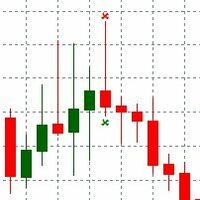
PinBar indicator is an Indicator identifies price reversal, pattern and timely identifies that price trend is changed. The Trend change is immediately identified over the chart. Alert is send over the Chart and Email address. Indicator generated Signal Price is displayed over the chart near the PinBar. Please make sure to use on Higher time frames if you are swing trader. for day traders who want to use M30 or M15 time frames, Take profit should be kept minimal. Lower than M15 is not recommende
FREE

Sirr Smart AI Express 3 for MT4 EA is an automated and easy to use expert advisor that has the Stochastic indicator working in combination with RSI and MACD filters built in. We have spent a lot of time testing many expert advisors . After years of testing and development, the result is an dynamic EA that is very active with trades and capital management. Our product is also fully compatible with PipFinite Trend Indicator PRO as well. The EA has been designed for trading with the popular symb
FREE

Ea Stepper是针对mt4平台的全自动专家顾问,可用于短期,中期和长期策略。该策略是寻找波动性非常低的时段,以将条目置于每日趋势的方向。如果趋势的方向发生变化,并且未平仓交易无利可图,则增加了手数的交易将朝相反的方向进行。
提供的条件:
具有最低点差和佣金的ECN帐户
对冲账户杠杆500:1
提供VPS
最低存款额为1000美元(可使用更少的金额)
输入参数(建议首先优化IN_ALL_CAPITALS参数):
MaxLotSize:交易的最大手数,可以与经纪人的最大手数分开。
MaxSpread:如果点差高于此点,则不会以点数交易。强烈建议您将此值设置为经纪人的广告平均价差。
MagicNumber1:区分帐户上其他EA交易。确保它是唯一的!
MagicNumber2:将交易与帐户上的其他EA交易区分开。确保它是唯一的!
AutoLot:根据帐户大小自动缩放手数。
AutoLotMargin:用于计算AutoLot的金额。
InitialLot:AutoLotMargin量的手数。例如:InitialL
FREE

The Investment Castle Chances indicator will show signals on the chart for entering a buy or sell trade. There are 2 types of signals for each direction as follows: Buy / Sell (Orange colored candlesticks) Strong Buy (Green colored candlesticks) / Strong Sell (Red colored candlesticks) You may place a buy trade once you see the Buy arrow or vise versa, or you might prefer to wait for a further confirmation “Strong Buy” / “Strong Sell”. This indicator works best with the high time frames H1, H
FREE
Thomas DeMark Relative Retracement uses an objective and consistent approach to Fibonacci Trading by establishing a minimum of three reference points which may provide support or resistance in the market. A great tool for anticipating continued price trends and/or price exhaustions!
Bullish levels are calculated once a potential price low has occurred. This low is compared to previous price action to locate an earlier price low which is equal or lower than the current low. The intervening high
FREE

Diversify the risk in your trading account by combining our Expert Advisors. Build your own custom trading system here: Simple Forex Trading Strategies
The expert advisor opens trades when the SMA and RSI are aligned in the same direction and when the Stochastic has left overbought/oversold areas. The 5 and 10 SMA are also programmed to close the trades if the trend changes. The Stop Loss, Take Profit, and Trailing Stop are calculated based on the ATR indicator. The recommended currency pai
FREE

Basic Fibonacci Calculation Indicator
shows Trend, Stoploss, Profit 1,2,3, will show you your daily Highs and your Daily Lows , it will also show you where it expects the price to move to. best time frame is H1 or higher .
For a better system that also includes my Non-repaint Indicator please check out my paid Fibo Indicator https://www.mql5.com/en/market/product/82323
FREE

Scanning Multi Symbols Scalping Signals based on 3 kinds of Market Analysis methods. Trend, Signal, and Reversator. And each method consists of its own multi timeframes algorithm functions. Summarized to become clear signals direction BUY/SELL, including the signals strength scoring and sending message to all available alert tools. Displayed on a User Friendly and customizable Dashboard. Size, colors, coordinates, highlight, hidden/show and more. Base Timeframe: M15. And M5 to Daily to confirm

With this system you can spot high-probability trades in direction of strong trends. You can profit from stop hunt moves initiated by the smart money!
Important Information How you can maximize the potential of the scanner, please read here: www.mql5.com/en/blogs/post/718109 Please read also the blog about the usage of the indicator: Professional Trading With Strong Momentum This FREE Version of the indicator works only on EURUSD and GBPUSD. The full version of the indicator can be found here:
FREE

McS Super Trend -This is one of the most popular classic trend indicators. It has a simple setting, allows you to work not only with the trend, but also displays the stop loss level, which is calculated by this indicator. Benefits:
Instruments: Currency pairs , stocks, commodities, indices, cryptocurrencies. Timeframe: М15 and higher. Trading time: Around the clock. Shows the direction of the current trend. Calculates the stop loss. It can be used when working with trading. Three types of no
FREE

This indicator is designed to find the difference in RSI price and indicator. This indicator shows the price and indicator difference on the screen. The user is alerted with the alert sending feature. Our Popular Products Super Oscillator HC Cross Signal Super Cross Trend Strong Trend Super Signal
Parameters divergenceDepth - Depth of 2nd ref. point search RSI_Period - Second calculation period indAppliedPrice - Applied price of indicator indMAMethod - MA calculation method findExtInt
FREE

The Trend Finding Channels indicator was developed to help you determine the trend direction by drawing channels on the graphical screen. It draws all channels that can be trending autonomously. It helps you determine the direction of your trend. This indicator makes it easy for you to implement your strategies. The indicator has Down trend lines and Up trend lines. You can determine the price direction according to the multiplicity of the trend lines. For example , if the Down trend lines s
FREE

[75% OFF! - SALE ENDS SOON] - RevCan Trend Entry Point is a trend based trade alert indicator for serious traders. It does all the price and chart analysis all by itself, and whenever it finds any potential high quality trading opportunity(Buy or Sell) using its revolutionized price prediction algorithms, it sends instant trade alert directly on the chart, MT4 terminal and on the mobile device. The trade signals will be visible on the chart as Up and Down arrows, while the instant audible aler

If you trade or wish to trade the popular HLHB Trend-Catcher System, then this indicator is for you! It detects when the HLHB system entry rules are met and sends out an alert in the form of notifications to your mobile phone and to your pc. By automatically sending you notifications, this indicator lessens your trading work load as you don't have to sit in from of your pc all day checking all the chats for when the entry rules are met. This indicator does all the dirty work for you. When the si
FREE

A new trend determination algorithm has been developed for this indicator. The algorithm with acceptable accuracy generates input signals and output levels. Strategy for trend trading, filtering and all the necessary functions built into one tool! The principle of the indicator’s operation is to automatically determine the current state of the market when placing it on a chart, analyze historical data based on historical data and display instructions for further actions on the screen to the trad

The trend in the market can be predicted using trend lines but the problem is you don’t know where exactly the price is going to touch the trend line where you can put your pending orders on. Smart Channel Expert Advisor makes it possible to put an advanced channel around the price data, which can be configured to handle placing orders, opening and closing positions, managing risk per trade, spread, slippage, and trailing stop-loss and take-profit automatically. Features Money Management (Calcul

You've probably heard about the Dow trend Theory, where higher highs and lows indicate an uptrend, and lower highs and lows indicate a downtrend. This indicator determines this trend based on the Dow Theory. You just need to enter a number representing the number of candles between extremes. The optimal solution is the number 3, unless you want to have the trend from M5 but you're on M1, then you need to multiply this number by 5. Check various combinations to trade with the trend. In the scree
FREE

DEMO version of GoldSuperTrendEA the demo version only works in backtesting.
TestGoldSuperTrendEA uses a strategy that combines RSI and Moving Average.
High winning percentage and a high profit factor make this Expert advisor very profitable.
It was developed for XAUUSD pair.
Setup and tips:
I recommend using a balance of $1500 and an initial lot of of 0.05 with leverage 1:100
Low timeframes are more sensitive to price swings, so it is best to use moving averages and low RSIs to
FREE

As the name implies, TIL Daily OHLC is a simple, straightforward yet effective tool to keep track of yesterday’s last Open, High, Low and Close prices. Any experienced trader knows the importance of these price levels – they are often used to navigate and predict the current day’s trend and price action as strong support and resistance. When applied to a chart, the indicator shows 4 plots that projects the 4 price levels from the previous day to the next one. Each price level is color coded and
FREE

As traders, we know that identifying price contractions and consolidations is crucial for profitable trading. Fortunately, we have a powerful tool at our disposal. The indicator to trade price consolidation is designed to identify price contraction and alerts us on formation. It does this by analyzing historical price data and identifying price action patterns. The algorithm then uses this information to mark the zone , potential targets and liquidity lines, giving us valuable insights into mark
if you want more information please pm me
HI guys this my developing indicator 1st version alert logic work well.. this indicator using can you stronger currency and top weaker currency find well,this;s indicator multy MTF time frame strength work.very good for SL trend screener intraday trader and long time trader, very easily can you watch stronger and weaker index.I hope to more improve this future further,thank you

Starlink EA is a multi-functional expert advisor for the MetaTrader 4 terminals. The algorithm of the expert advisor allows you to trade both with the trend and against the trend. Trading with the trend is structured in such a way that each new order is opened only if the previous order has a Stop Loss in the profit zone. Trading against the trend is conducted in order to close unprofitable positions with a profit. The advisor has a large number of settings that allow you to conduct conser

The Flag Streamer Pattern indicator is an indicator designed to find flag and pennant patterns. When the legend finds patterns, it draws lines on the graph screen. Magenta lines represent the streamer pattern. Aqua colored patterns represent the flag pattern. You can change the pattern colors according to your request. Our Popular Products Super Oscillator HC Cross Signal Super Cross Trend Strong Trend Super Signal Parameters fs- =======Channel Trend Setting===== Channel - Channel period setting
FREE

The indicator shows the Fibonaccia golden ratio levels and the price balance line Has three different sensitivity options Allows you to visually navigate what state the market is in and where trend reversals are possible Works on all timeframes, on any currency pairs, metals and cryptocurrencies Can be used when working with binary options Distinctive features Based on the golden Fibonacci value; Determines the balance line of price equilibrium Has three different sensitivity settings; Simple an
FREE

Monitors the current trend, gives signals for an uptrend, downtrend and weakening of the current trend. Colors the situation on the market with the appropriate color. Tool - any. Timeframe - any. Advantages The indicator does not repaint its signals. There are alert signals. Easy to use. Flexible settings. Suitable for trading any financial instruments. Settings Name Description Fast parameter The value of the fast parameter in the indicator (Should be less than the slow one). Slow parameter The
FREE

Blahtech Fisher Transform indicator is an oscillator that displays overbought and oversold locations on the chart. The Fisher Transform algorithm transforms prices with any distribution shape into a normal distribution. The end result is a curve with sharp turning points that may help to identify bullish or bearish trends. Fisher Transform values exceeding 1.66 on the daily chart are considered to be good areas for reversal trades. Links [ Install | Update | Training | All Products ]

Magic Moving is a professional indicator for the MetaTrader 4 terminal. Unlike Moving Average , Magic Moving provides better signals and is able to identified prolonged trends. In the indicator, you can set up alerts (alert, email, push), so that you won't miss a single trading signal. MT5 version can be found here You can test the program by downloading the demo version: https://www.mql5.com/en/blogs/post/749430 Advantages of the indicator Perfect for scalping. Generates minimum false signals.

This indicator is the translated version of Kıvanç ÖZBİLGİÇ's PMAX Indicator, developed on the Matriks Data Terminal, into the MQL4 language. It is a trend-following indicator and quite successful. Its usage will be free and unlimited for a lifetime. You can click on my profile to access the MQL5 version of this indicator. You can also get your programming requests for MQL4 and MQL5 languages done at İpek Bilgisayar with an invoiced service. You can reach İpek Bilgisayar at www.ipekbilgisayar.or
FREE

The StrikePin indicator is a technical, analytical tool designed to identify trend reversals and find optimal market entries. The StrikePin indicator is based on the pin bar pattern, which is the Price Action reversal pattern.
An entry signal, in a trending market, can offer a very high-probability entry and a good risk to reward scenario.
Be careful: the indicator is repainting since it is looking for highest high and lowest lows. You should avoid to use it in experts but you can use it
FREE

A powerful trend analysis tool for traders of all levels Super Trend Analyzer is a technical analysis tool that uses the Relative Strength Index (RSI) and Moving Average (MA) indicators to identify trends in the market. It is a versatile tool that can be used by traders of all levels of experience.
How does it work An uptrend begins when the main trend line and the auxiliary trend line cross from below and the lower minor oscillator is on the rise. A downtrend begins when the main trend line a
FREE

A Moving Average (MA) Trading Expert Advisor (EA) for MetaTrader 4 (MT4) is an automated trading system designed to execute trades based on signals generated by one or multiple moving averages. Moving averages are a popular technical analysis tool used to smooth out price data and identify trends. Here's a description of how a Moving Average Trading EA typically operates: Moving Averages Used : The EA utilizes one or more moving averages to generate buy or sell signals. Common choices include t
FREE

The product Divergence Mom Stoch Adx Bears Bulls is designed to find the differences between indicators and price. It allows you to open orders or set trends using these differences. The indicator has 4 different divergence features.
Divergence types Class A Divergence Class B Divergence Class C Divergence Hidden Divergence
Product Features and Rec ommendations There are 5 indicators on the indicator Indicators = Momentum Stochastic Adx Bears Bulls 4 different divergence types are used
FREE

The indicator is based on identifying engulfing candlestick patterns within the current timeframe. When such patterns are found, it generates buy and sell signals represented by up and down arrows, respectively. However, the user is responsible for determining the prevailing trend. Once the trend is identified, they should trade in line with the corresponding signal that aligns with the trend direction.
FREE

Emulate TradingView drawing experience with magnet snap to the nearest price.
Supported drawing tools: Vertical Line Horizontal Line Trend Line Horizontal Ray (Angle Trend Line) Fibonacci Retracement Rectangle
Input:
Threshold (px) : The distance in pixel unit to snap the crosshair to the nearest price.
Feel free to write the review, request more features or report bugs.
FREE

"Bitcoin indicator" is a ready-made mechanical trading system for Bitcoin. The system is implemented as an indicator that shows the trader on the chart the price reversal points and the current trend direction. This information is enough to effectively trade in the market. The "Bitcoin indicator" consists of a complex analytical block that constantly analyzes the market and shows the trader where the trend is heading. The indicator also shows with dots on the chart, the price reversal points. S

About Waddah Multimeter (free): This product is based on the WAExplosion Indicator. It helps identify explosive market trends and potential trading opportunities. Waddah Multi-meter (Multi-timeframe) Check out the detailed product post here: https://abiroid.com/product/simple-waddah-multimeter/
Features: Waddah Trend Direction Trend Strength (above/below explosion line or deadzone) Trend Explosion Alert Alignment alerts Multi-timeframe Custom currency Multi indicators on same chart (unique p
FREE

This is an unconventional version of the Heiken Ashi Smoothed indicator implemented as lines rather than a histogram. Unlike a usual histogram, the indicator draws the readings of the two moving averages in the form of colored lines.
Example If the candle crosses two indicator lines upwards, a trend is assumed to be changing from bearish to bullish. If the candle crosses two indicator lines downwards, a trend is assumed to be changing from bullish to bearish. The indicator is good at displayin
FREE

Introducing our simple yet powerful trendline trading expert, designed to open positions upon trendline breaks or touches based on predefined parameters. All you need to do is rename it to buy, sell, buy limit, or sell limit. As the name suggests, this is the basic version with minimal features. However, if you're looking for a truly professional trendline trading expert equipped with various trading management tools, automatic position sizing, trailing stops, breakeven points, partial closures,
FREE

MACD Display 是一个跨周期MACD背离,金死叉监控指标。 指标优势:
1、背离点位可以在主图和指标附图上画出来,观察方便,可通过参数设置隐藏或显示。 2、背离入场点在附图中通过箭头提示,清楚明确。 3、跨周期监控,可以同时监控该品种6个周期框架的MACD背离及金死叉情况。 4、顶背离、底背离、金叉、死叉信号出来后可通过窗口报警提示,有效减少盯盘时间。 5、可隐藏MACD柱体,方便信号观察。 更多来自作者的EA和指标 https://www.mql5.com/zh/users/chenshaofei/seller 参数说明:
separator1 - 说明性参数,默认,不重要 FastMAPeriod - macd快线周期 SlowMAPeriod - macd慢线周期 SignalMAPeriod - macd信号周期 applied_price - macd应用价格 show_histogram - 是否显示macd柱体 separator2 - 说明性参数,默认,不重要 drawIndicatorTrendLines - 是否在指标附图上画背离线 drawPrice
MetaTrader市场是 出售自动交易和技术指标的最好地方。
您只需要以一个有吸引力的设计和良好的描述为MetaTrader平台开发应用程序。我们将为您解释如何在市场发布您的产品将它提供给数以百万计的MetaTrader用户。
您错过了交易机会:
- 免费交易应用程序
- 8,000+信号可供复制
- 探索金融市场的经济新闻
注册
登录