 MetaTrader 5
 专家
 指标
 程序库
 实用工具
 窗口小部件
 规则
适用于MetaTrader 4的新EA交易和指标 - 242
 EA交易自动执行市场交易,而指标可使您更准确地分析报价并预测价格行为。
通过这些应用程序,您将能够更明智地在MetaTrader 4执行交易,抓住更多的交易机会。

Breakout and Rebound EA works using the opening prices of new bars. The strategy is based on the breakout/rebound from newly formed support and resistance levels. The support/resistance levels are identified using a narrow range of fluctuations in High/Low price of the bar for the period n. Entries are made in the direction of the initial movement from a level +/- n points.
The EA is designed for intraday trading with all major currency pairs on any timeframe. Any trading style can be used, whi
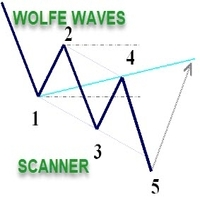
Wolfe Waves scanner - It scans all the Symbols and identify the movement of price and it gives confidence in trade. It automatically plots fifth wave breaks out of the channel. According to the theory behind the pattern, a line drawn from the point at the beginning of the first wave and passing through the beginning of the fourth wave predicts a target price for the end of the fifth wave. If a trader properly identifies a Wolfe Wave as it forms, the beginning of the fifth wave represents an op
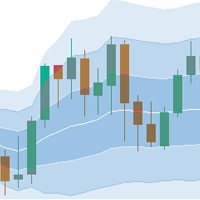
Description :
VWAP (Volume-Weighted Average Price) is the ratio of the value traded to total volume traded over a particular time horizon. It is a measure of the average price at which pair is traded over the trading horizon. Read More.
All Symbols and All Timeframes are supported.
Indicator Inputs :
VWAP Mode : Mode of VWAP Calculation. Options can be selected : Single,Session,Daily,Weekly,Monthly
Volumes : Real Volumes,Tick Volumes
Price Type : Used price for calculating.

Советник торгует EURGBP. Уникальным свойством EURGBP является снижение активности торгов на американской сессии, которое объясняется отсутствием в составе инструмента USD. Пара малоактивна с 19-00 до 9-00 – этот промежуток в три раза больше, чем у традиционных для ночной торговли азиатских валют. Кросс-пары в отличие от долларовых валютных инструментов слабо реагируют на новости США, что позволяет в разы снизить ложные срабатывания стопов и проскальзывания. Таймфрейм: M5 Минимальный депозит: $3

Pandora AI is a auto-trading system designed to put in your hands the technical analysis tools for 28 pairs of currencies and Gold in one chart for scalp trading at 5 minute time-frame. Backtest for a period of 6 months with XAUUSD results from the initial $ 100 deposit and returns up to $ 34M in profit. Recommendations - Recommended deposit $ 100 - Recommended leverage 1:30 to 1:500 - Use EA with ECN or Raw spread accounts. - Backtest with model: Every tick.

该指标背后的想法是在所有时间范围内找到穆雷水平并将它们组合成组合水平,其中包括基于强穆雷水平 (+2, +1, 8, 4, 0, -1, -2). 时间范围越短,您立即看到组合级别的机会就越大。 它将以颜色突出显示。 当您将光标悬停在任何数字上时,将显示该级别所属的时间范围的提示。 但您将始终将当前时间范围视为最左边的时间范围。 智能警报可帮助您传达与信号组合级别相关的价格。
视频中的仪表板不是声明的功能,也不包含在此处! 仍在开发中。
交易建议。 不建议在没有额外技术分析的情况下交易组合水平的反弹。 从蓝色和红色水平反弹的概率较高。 价格被磁力吸引至组合水平,但价格尚未对其进行测试(128 根蜡烛前)。在这种情况下,建议使用趋势策略,并采取水平取向(高/低一个水平)。 当价格向红色或蓝色水平移动时,不要在沿途反弹时交易黄色(这会破坏势头)。 强烈建议初学者在组合水平反弹时进行交易,除非有相反的组合水平。 最好在趋势方向反弹时进行交易。
在博客链接阅读更多内容 - Murrey Math Trading with UPD1 .
设置说明。
主要设置。 Period
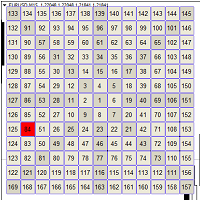
甘氏矩陣圖:解鎖市場幾何學,實現精準預測! 您是否渴望超越線性分析工具,以全新的幾何視角觀察市場?您是否希望利用甘氏矩陣圖的力量來識別關鍵的支撐和阻力位,以及潛在的反轉點? 隆重推出 甘氏矩陣圖 (Gunn Chart) – 一款創新的指標,可在傳奇的甘氏矩陣圖的背景下可視化價格走勢。該工具基於有史以來最偉大的交易員之一 – 威廉·江恩 (William Delbert Gann) 開發的數學和幾何關係,為您開啟一種獨特的市場結構分析方法。 什麼是甘氏矩陣圖?為什麼它如此強大? 甘氏矩陣圖是一種強大的幾何分析工具,它使用方形網格來顯示價格水平和時間關係。江恩認為,市場按照可預測的數學規律和幾何模式運行。甘氏矩陣圖幫助交易者可視化這些模式,識別關鍵的支撐和阻力位,預測潛在的趨勢反轉,並為他們的交易建立目標水平。 其核心思想是,重要的價格水平通常位於從關鍵高點或低點以特定角度繪製的線條的交匯處,從而形成方形結構。通過觀察價格如何與這些水平相互作用,交易者可以獲得關於趨勢強度和未來走勢可能方向的寶貴見解。 甘氏矩陣圖指標如何運作? 甘氏矩陣圖 (Gunn Chart) 指標根據當前價格自動在
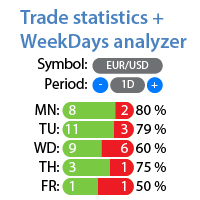
所选期间的详细交易统计 查看我的 #1 交易助手 :66+ 功能,包括此工具 | 如有疑问,请联系我 该工具包含2个独立功能: 交易统计 周交易日分析器 统计显示模式: 针对 选定 的货币对/交易工具 针对 所有交易 (" ALL ") 您可以选择获取统计数据的时段: 1天 1周 1个月 2 个月 3 个月 6 个月 1年 2年 全部交易历史 1. 交易统计: 毛利润 毛亏损 总利润/亏损 交易次数 买入盈利交易百分比 卖出盈利交易百分比 总盈利交易百分比 平均持仓时间 盈利交易的平均持仓时间 亏损 交易的平均 持仓时间 2. 周交易日分析器: 寻找最佳入市日 您将看到每周各天的统计数据:盈利/亏损次数以及各天的胜率。 红色和绿色区域将帮助您直观地看到交易最成功的日子以及不宜交易的日子。 界面优势: 您可以 折叠面板 ,从而释放图表上的空间:([^] 按钮 ); 您可以 移动面板 到图表上的任何位置:([move] 按钮 ); 深色/浅色界面主题 :("[Dark]" 开关 ); 启用/禁用周交易日统计显示;
MetaTrader 4 实时 Renko 图表 KT Renko Live Chart 会根据您加载它的品种,在 MetaTrader 4 中生成实时 Renko 图表。砖块写入离线图表,该图表随新报价更新,并支持自定义指标和智能交易系统。 设置步骤 将工具加载到需要转换的品种图表上,并保持该图表打开。M1 图表可提供最详细的历史。 通过“文件”中的“打开离线图表”打开 Renko 图表,选择对应 Offline Time-Frame 的品种,例如 EURUSD,M2。 如需在 Renko 图表上运行智能交易系统,请打开图表属性(F8)并取消勾选“离线图表”,使 EA 能接收新报价。 参数 Renko Box Size in Pips: 砖块大小。在五位报价和三位 JPY 报价上,一个 pip 等于十个点。 Offline Time-Frame for Renko Chart: 离线 Renko 图表的周期,默认值为 2。不使用 M1 或 M5 等标准周期。 Show Wicks: 显示或隐藏 Renko 影线。 Limit Bars: 限制转换的源图表K线数量,从而降低终端负载。设

The indicator synchronizes eight types of markings on several charts of one trading instrument.
This indicator is convenient to use in conjunction with "Multichart Dashboard" or other similar assistant that allows you to work with several charts at the same time.
"Multichart Dashboard" can be found under the link on my youtube channel.
Settings:
enable vertical line synchronization
enable horizontal line synchronization
enable Trend Line synchronization
enabling Fibonacci Retracement synchron
FREE

Super Oscillator , is a powerful indicator that vibrates along with the market, resulting in a very useful tool to improve and decide your trading.
You can download the demo and test it yourself.
In a versatile indicator that in a single graph shows us information about four different aspects of the market
1) 4 operational zones. The indicator divides the screen into 4 zones that allows us to properly assess the moment of the market. a) Pullback Buy Trend. If the indicator is above 80, it
Super Oscillator is an ea based on the super oscillator indicator. https://www.mql5.com/es/market/product/59070 This ea uses the indicator's trend exhaustion signal to initiate a countertrend strategy. The system has a costly lotage, although it can have more than one operation open at a time It does not require large capital or margin requirements to be operated.
You can download the demo and test it yourself. Very stable growth curve as result of smart averaging techniques.
"Safety first"

This PORTFOLIO of 5 strategies has been developed, tested and traded live on GBPUSD M30 TF. Multiple EAs traded together will lead to a bigger profits and smoother equity curve. 5 not correlated EAs logics for GBPUSD M30 merged to a single strategy. Very SIMPLE STRATEGIES with only FEW PARAMETERS. Every trade has his own logic for STOP LOSS. To catch the profits every strategy uses different approach - some has TAKE PROFIT, some uses TIME BASED EXITS or PROFIT TRAILING. EA has been backtested
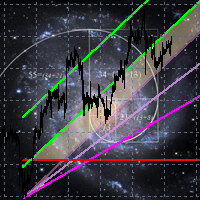
The indicator builds a graphical analysis based on the Fibonacci theory.
Fibo Fan is used for the analysis of the impulses and corrections of the movement.
Reversal lines (2 lines at the base of the Fibonacci fan) are used to analyze the direction of movements.
The indicator displays the of 4 the target line in each direction.
The indicator takes into account market volatility.
If the price is above the reversal lines, it makes sense to consider buying, if lower, then selling.
You can open posi
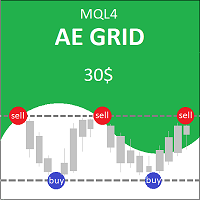
AE Grid is an automated expert advisor that works on the basis of trend and classic grid averaging.
AE Grid was developed, tested and optimized strictly according to the history of 10 years. ( from 2010 to 2020 ) Demo trading account
Features built-in mathematical slip algorithm. The price channel in all time frames. When touching the price channel with a positive balance, it closes all positions in order to avoid a trend reversal. It goes in addition to the ADVISER for Free. Issuing a new

Multiphase is a non-redrawing channel indicator based on moving averages. The key difference between the Multiphase indicator and other channel indicators (for example, from the same Bollinger Band) is that Multiphase takes into account not simple moving averages, but double-smoothed ones, which, on the one hand, makes it possible to more clearly determine the market movement, but, with on the other hand, it makes the indicator less sensitive.

The Trend Logic indicator provides an opportunity to classify the direction of price movement by determining its strength. Solving this problem helps to enter the market on time and make a good profit. It is extremely important for any trader to correctly determine the direction and strength of the trend movement. Unfortunately, there is no single correct solution to this problem. Many traders trade at different time frames. For this reason, the received signals are perceived subjectively. The

MEDUSA X is a Revolutionary Momentum and Pullback Algorithm Expert Advisor, specializing on the low spread major pairs, GBPUSD. This EA trades frequently during the day if there's a valid signal.
Real Signal: https://www.mql5.com/en/signals/1681843
Extremely EASY-TO-USE, with TREND EMA, RSI, Volatility filters all highly optimized at the backend.
Most of the time, the trades will TP 5pips with single entries. Like a experienced human trader, It utilizes additional Grid averaging trades (

Trend Anthropoid is a trend indicator that allows you to effectively determine the direction of the current trend, as well as identify potential reversal points. The indicator makes it possible to classify the direction of price movement by determining its strength. Solving this problem helps to enter the market on time and get the desired result.
Let's start with the benefits. Allows you to determine the current trend. You can quickly understand which trend is currently developing in the mark

Stop Watching the Moving Average. Get Alerted. Moving Average Alert automatically monitors price interaction with your Moving Average and alerts you when your selected candle and price-action conditions occur. Don't settle for a basic MA crossover alert. KEY FEATURES Close Above MA
Detect bullish candles closing above the Moving Average. Close Below MA
Detect bearish candles closing below the Moving Average. Close Above/Below MA
Monitor both bullish and bearish MA brea
The stocks that make up the index are one of the drivers of the movement. Analyzing the financial performance of all elements of the index, we can assume further development of the situation. The program (script) displays corporate reports of shares that are part of the index selected in the settings.
"Indexes" cannot be tested in the tester (since there is no way to get information from the Internet).
Information is downloaded from the site investing.com: Report Date Earnings per share (E

One Shoot Expert Advisor. This expert advisor was designed specifically for the USD / JPY Forex market. Its operation is based on a multi time frame moving average strategy, so it can be classified as a trend expert. When the trend has consolidated on one direction the algorithm buys or sells the currency pair. In the event of a trend inversion, there is a fixed stop loss, while the take profit is variable with the trailing stop function. For this reason the platform must always be connected to

Индикатор тренда Decisive , показывает моменты для входа в рынок стрелками. Это гибридный индикатор, так как основывается на сигналах нескольких двух достаточно известных продуктов - индикатор среднего истинного диапазона, который определяет диапазон минимальных и максимальных ценовых колебаний, а также цен закрытия. В результате - указывает текущую рыночную волатильность. Также индикатор семейства осцилляторов. Индикатор помогает рассчитать уровни перепроданности и перекупленности торгового ин

Канал Achieved состоит из двух линий отображающих канал. Линии канала определяются по простому и надежному алгоритму. Канал желательно использовать для торговли внутри канала. Индикатор не перерисовывается и не запаздывает, в основе работы простые алгоритмы. Работает на всех валютных парах и на всех таймфреймах. Как всегда предупреждение, не надо забывать, что подход должен быть комплексным, сигналы индикатора требуют дополнительной информации для входа в рынок.

Stop Watching Key Price Levels. Get Alerted. Horizontal Line Alert automatically monitors a price level and alerts you when price closes above, closes below, or touches the line . Go beyond a basic horizontal-line alert with candle confirmation, candle-size filtering, and price-action conditions . KEY FEATURES Close Above
Detect qualifying bullish candles closing above your horizontal level. Close Below
Detect qualifying bearish candles closing below your level. Close A

The Agency indicator reveals all the main market conditions (trend, retracement in a trend, flat), which allows you to enter the market at any time and use any trading methods and styles. The indicator is a directional system (ADX). The directional system was developed by J. Wilder in the mid-70s in addition to the PARABOLIC SAR system and then developed by a number of analysts. It has two main rows of points. The first row of red dots shows the direction of the sell trend. The second row of gr

Implement analyzes market dynamics for pivot points. If you want to learn how to spot the correct reversals for consistently likely profitable trading, buy this indicator. Shows favorable moments of entering the market in stripes. Ready-made trading system.
The principle of operation of the indicator is to automatically determine the current state of the market when placed on a chart, analyze historical data based on historical data and display instructions for further actions on the trader's

The Effect indicator shows the points of potential market reversal. Simple, visual and efficient trend detection. Ready-made trading system. The intelligent algorithm of the indicator determines the trend with good probability. Uses just one parameter for settings. The indicator does not redraw and does not lag. Works on all currency pairs and all timeframes.
You should remember that using a combination of forecasting tools, it is advisable to choose 2-3 indicators for trading. Otherwise, thei

Reversal Trend indicator, which recalculates values for a new period without changing the previous ones. According to statistics, more than 85% of traders who prefer aggressive trading suffer losses. The rush and desire to make a profit immediately leads them to frequently open orders at random, much like playing in a casino. The bottom line is disappointing: a few trades, possibly, will bring profits and then losses. To understand the dynamics of the market and use it for profit, you need to

The considered bot Your Scalpel is a scalpel with all that it implies. The description of the bot will be very concise and to the point, namely, the principle of operation and parameters for setting up an Expert Advisor. The scalpel expert uses very flexible settings. The bot can work with a deposit of $ 100, which is not unimportant. The bot offers full control over the environment parameters, all the necessary settings will be described below. The work takes place on the periods M1-M15.
The

Working with the Smart Analiz indicator is very simple - you just react to the arrows that the indicator reflects, that is, the arrow is a command for action. The indicator signals are accurate enough and you can trade using this information! The indicator builds a very high-quality channel in which it generates entry signals! Which is the ideal strategy for a trader as the trader is always hesitant when choosing a strategy to work with. That is, this indicator will allow you to solve the dilemm

Hello and welcome to Parabolik EA developed by OPTIMIZFX!
Parabolik EA was created to take advantage of the Parabolic SAR and uses Moving Averages to determine the Correct Trend for entry. Parabolik can be used on any time frame and any pairs, the higher the time frame (1H to 4H) the better the entry but the slower the profits. M5 is recommended, M1 you can expect poor entries, the recovery system makes up for poor entries.
3 WAYS TO TRADE PARABOLIK EA - FIXED LOT SIZE | Leave Multiplier ON bu

This utility is very useful for trader to get an alert when there is interrupt connection (lost connection) to MT4 server and if there your computer is no internet connection. You will get an alert by sound, email and push notification at the moment your MT4 platform lost it connection. Several function available to alert you. 1- Sound notification 2- Email notification 3- Push notification 4- Blinking red background on your MT4 platform chart. If you lost connection to your broker but your inte
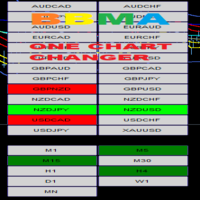
This is Mini Dashboard of BBMA with Reentry Signal and Trends. *More convenience to change any symbols in One Chart. *Multipairs and Multi Timeframe
Reentry Signal : Are based on BBMA Method . You can select any Time Frames to scan the current signals of Reentry. RED BUTTON = REENTRY SELLS GREEN BUTTON = REENTRY BUY
Trends : Multi Time Frames Are based on BBMA Method. GREEN BUTTON = TREND UP RED BUTTON = TREND DOWN.
Inputs: MultiPairs : any list of symbols. Options to attach indicator on cha

ActInvest is a customizable robot that can be adapted to work on any timeframe and any financial market. The robot is based on mathematical logic and an enhanced version of Martingale. It has powerful tools to reduce losses. It can trade one or both directions at the same time. It can be used in correlation with manual trading as well. Can be used in all timeframes and with all forex pairs. With the proper settings it can also be used for metals (including gold), indexes, or even stocks. There i

DNA is an indicator that allows us to operate both in favor of a trend and a pullback. You can download the demo and test it yourself.
Trend trading is above zero and pullback trading is below zero.
The direction of the operation is marked by the color of the line.
If the line is green it corresponds to purchases.
If the line is red it corresponds to sales.
For example, if the green line is above zero and growing, we will have an uptrend operation. If the red line is above zero and growin

This indicator automatically plots Yearly High , Yearly Low and Yearly Average price levels from the previous year. It also builds two additional equidistant parallel levels ( Extended Highs R2 , R3 / Extended Lows S2 , R3 ) extended from previous Year High / Low. Extended High R3 / Low S3 is 100 percent Low-to-High extension ( as in Fibonacci 100 % extensions ) above / below the previous Year H/L and is the final reversal level with a sure reaction. Extended High/Low R3/S3 represent the ulti

Photocopy MT4 is an Copier of transactions through Telegram channel. Will help you instantly publish your trade in Telegram channel or copy trades from Telegram channel. The utility can work in two directions by receiving signals in MT4 and transmitting signals to Telegram . No more missed deals No more panic Capital Management Ease of use
You can use it for:
Copying your own deals through Telegram channel (via the Internet); Copying trades from MT5 to MT4 and vice versa. Propagation of signa
FREE
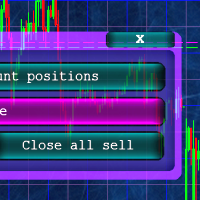
Кнопочная панель для одновременного закрывания большого числа позиций. Всего четыре варианта закрывания: Закрыть все позиции на счёте ( Close all account positions ). Закрыть все позиции по символу графика, на котором находится панель ( Close all positions ). Закрыть все Buy позиции по символу графика, на котором находится панель ( Close all Buy positions ). Закрыть все Sell позиции по символу графика, на котором находится панель ( Close all Sell positions ).
FREE
Hundreds of possible combinations and only two strategies. By using automated software like an EA, you can benefit from the following advantages: it can trade while you are sleeping, it is not susceptible to emotions and you can quickly run backtests. However, it is hard to ascertain whether an EA will help you to achieve consistent profits. Lots of EAs are profitable on a demo account, but for some unknown reason, when the trader tries to apply it on a live account with their own funds, suddenl
TD Combo is better when you have sharp directional moves, because it requires only thirteen price bars from start to finish compared to TD Sequential which needs at least 22 bars. The criteria for a Setup within TD Combo are the same with those required for a Setup within TD Sequential. The difference is that the count starts at bar 1 of the setup and not from bar 9 and TD Combo requires four conditions to be satisfied simultaneously.
Requirements for a TD Combo Buy Countdown
- Close lower or
The indicator scans for TD Combo signals in multiple timeframes for the all markets filtered and shows the results on Dashboard. Key Features Dashboard can be used for all markets It can scan for signals on MN1, W1, D1, H4, H1, M30, M15 ,M5, M1 timeframes Parameters UseMarketWatch: Set true to copy all symbols available in market watch MarketWatchCount : Set the number of symbols that you want to copy from the market watch list. CustomSymbols: Enter the custom symbols that you want to be availa
T D Sequential indicator consist of two components. TD Setup is the first one and it is a prerequisite for the TD Countdown – the second component.
TD Setup TD Setup compares the current close with the corresponding close four bars earlier. There must be nine consecutive closes higher/lower than the close four bars earlier.
1- TD Buy Setup - Prerequisite is a bearish price flip, which indicates a switch from positive to negative momentum.
– After a
The indicator scans for TD Sequential signals in multiple timeframes for the all markets filtered and shows the results on Dashboard. Key Features Dashboard can be used for all markets It can scan for signals on MN1, W1, D1, H4, H1, M30, M15 ,M5, M1 timeframes Parameters UseMarketWatch: Set true to copy all symbols available in market watch MarketWatchCount : Set the number of symbols that you want to copy from the market watch list. CustomSymbols: Enter the custom symbols that you want to be a

Fitpro 10 Scalper Expert Advisor is a automated forex trading robot designed to work on the most traded currency any pair. The strategy is based on using several MT4 indicators , each entry point is calculated using an advanced input filter based on the analysis of the movement of the price chart. Each order is secured by a fixed stop-loss while, no martingale, no grid, scalp or hedge. Paramater • Magic Order - is a special number that the EA assigns to its orders
• Take Profit - take p

Heikin-Ashi-Sniper is a perfect addition to your portfolio. This is the second part of the Portfolio. It is meant to be traded on GBPUSD on H1 Timeframe.
It uses Bollinger Bands to determine optimal entry signals while having a reasonably low drawdown Each Expert of our portfolio uses a different technique to minimize curve fitting and diversify the strategy. More EA´s will be published shortly to complete the Portfolio. The EA Trades not very frequently it waits for the right chance and places

Heikin-Ashi-Sniper is a perfect addition to your portfolio. This is the thirdpart of the Portfolio. It is meant to be traded on USDJPYon H1 Timeframe.
It uses Bollinger Bands to determine optimal entry signals while having a reasonably low drawdown Each Expert of our portfolio uses a different technique to minimize curve fitting and diversify the strategy. More EA´s will be published shortly to complete the Portfolio. The EA Trades not very frequently it waits for the right chance and places th

PO-Plus Readme
機能: 3つのロジックでの買いサイン、売りサインを表示します。 各ロジックでの勝率を表示します。
サイン表示後、勝率を確認して高い勝率でBOやFXでエントリーすることが出来ます。
勝率の判定本数を変更できます。
Indicator Noを変えることによるこのインジケータを複数適用することができます。 これによりRCIの数値を変更して勝率を複数表示が可能になります。 その際は、ラベルの表示位置も変更してください。 ボタンを押すことによりラベルや買いサイン、売りサインを表示、非表示すことが出来ます。
注意:こちらのロジックはZigZag+ロジックでの勝率になりますので 勝率は実際のものより高めに表示されます。 エントリーする際は勝率60%以上のものを推奨します。 ZigZagベースなので価格が動く日本、欧州、NY時間の前半でのエントリしない ことを推奨します。
各パラメータの説明: ----------Basic Setting---------- Indicator No:インジケータNoを設定します。もし同じチャートに複数適用し
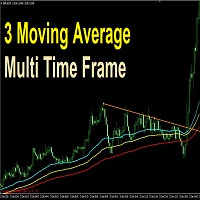
The simplest and profitable strategy is to break the trend of the small time frame in the direction of the big time frame.
3 moving average multi time frame is for those who trade on a 5-minute frame and want to enter with the direction of the hour; Or trade on the hour and want to enter with the daily trend, or the minute with the quarter hour trend.... This indicator draw three moving averages that show the direction of the big trend and help to enter with the end of the correction ,and ret

This version of the MACD named MACD Platinum is the MACD indicator calculated with ZeroLag moving averages (ZLEMA) .
ZLEMA is an abbreviation of Zero Lag Exponential Moving Average . It was developed by John Ehlers and Rick Way. ZLEMA is a kind of Exponential moving average but its main idea is to eliminate the lag arising from the very nature of the moving averages and other trend following indicators.

Price Fluctuations EA is an advisor w ithout indicator advisor to accelerate the deposit , it works on price fluctuations, and has the function of reducing the drawdown on the account by overlapping unprofitable orders. The chart displays information about the profit.
OPTIONS: DISTANCE - distance that the price must travel in N seconds; TIMER_SEC - timer in seconds after which the distance will be updated; START_LOT - initial lot; LOT_MULTIPLIER - lot multiplier in the order grid; MAX_

Forex Daily Scalping EA is a professional scalping advisor for daily work on the FOREX currency market. In trading, along with experience, traders usually come to understand that the levels of accumulation of stop orders, price and time play a significant role in the market.
- Recommend ECN broker with LOW SPREAD: IC Market , Exness, NordFX , FXPRIMUS , Alpari , FXTM
PARAMETERS: PRICE - the price distance to be covered in the allotted time period; TIME - time allotted in seconds; HL_PERIOD - n

The Expert Advisor works on sharp price movements; it can apply open position locking and pyramiding. Virtual stops are used (take profit, trailing stop), to limit losses, order locking and stop loss are used in% of balance. At the same time, several dozens of orders can be opened and the advisor will need free funds to exit the locks and close all positions for total profit, this should be taken into account when choosing the number of instruments for trading.
The work of the adviser does not

Professional Scalping EA is an automated professional scalping Expert Advisor designed to work in the FOREX market . The strategy uses the relative strength index ( RSI ) and the average true range ( ATR ) in order to determine the best entry points into the market. Advisor is suitable for both experienced traders and beginners. The most volatile pairs are suitable for work: GBPUSD, USDCAD, EURUSD, USDJPY, USDCHF, AUDUSD, NZDUSD .
- Recommend ECN broker with LOW SPREAD: IC Market , Exness,
This Relative Strength Index version using four different Period. Calculate on Timeframe M1, M5, M15, M30, H1, H4 and D1. Each using median price for valid average calculation.
How to use this indicator, as follows; 1. This indicator design for FOLLOW THE TREND, not using for Overbought or Oversold, but if you want to use it as Reversal trades, is up to you. 2. You can see on pictures attachment, it produce three type of signal, LONG, SHORT and SIDEWAYS. 3. Recommended for trading, Open trade
Arrow indicator of trend reversal with 2-level signaling and multi timeframe. The indicator line consists of 4 colors, indicating the divergence level and possible trend reversals. Light arrows indicate a weak trend, dark arrows indicate a strong one. Sensitivity levels and steps are set in the settings. Signals are output to the mailbox and mobile terminal.
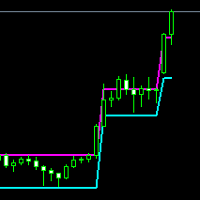
ATRenko Indicator
ATRenko is an indicator and I think it works better on the daily chart. Indicator draws 2 lines; Upper band line and lower band line.
If the price is between two bands, it means that there is no trend or the previous trend is continuing and there is a consolidation process. There are two indicator inputs that can be changed by the user.
1. ATRenko Period
It is 10 by default. It determines in how many bars the calculation will be made in the selected timeframe.
2. Katrenko; By

Fibonacci Level start form price Open as zero number. then do Fibonacci line offset on above and to below, base last Day High Low Fibonacci Percentage.
With ADR Label for measure maximum and minimum pips running limit. Using ADR 5 days, ADR 10 Days, ADR 20 Days and ADR 50 Days.
On current running price, there plot two line boundaries, are current High line and current Low line, with percentage running pips.
Please see attachment pictures for more information.
Regards

This is the Equity Protector you've been looking for!! I couldn't find what I needed so I created this. Protecting your capital should be your #1 goal, this tool is an amazingly flexible way of doing exactly that! Stand out! Features: (all completely customisable and work independent to each other) (1) Temporarily Remove SL & TP - This game changing function will temporarily remove your SL & TP levels and then re-apply them when the specified time period is up e.g. Set the time between 11:0

British-Japanese Wizard This Expert Advisor has been developed for GBPJPY H1 based on Bollinger Bands and pending orders . It has been backtested on more than 17-year long tick data with 99,9% quality of modeling . It has been developed with the help of a genetic algorithm . It is highly stable and durable and suitable for long-term smart trading. I tried several thousand optimizations before I found an EA that is not only profitable in the backtest but has the potential to be profitable in t

When Metatraders trades many currency pairs, it's not easy to see the full information. This indicator is very comfortable and easy to see the current transaction. You can confirm this information and determine the type of order (SELL/BUY) for further transactions. If you use this tool, you probably won't be able to make orders without it. Also, you can easily see the sharp changes in total profits.
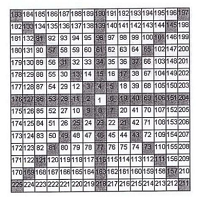
Gunn Crosses:運用江恩十字與江恩交易法解鎖市場幾何! 渴望透過駕馭江恩方格強大的幾何學來深化您的技術分析嗎?Gunn Crosses 指標提供了一種獨特的方式來視覺化支撐和阻力位,這些支撐和阻力位是根據傳奇江恩方格的對角線和基本十字線計算出來的,而江恩方格是威廉·德爾伯特·江恩所採用的全面交易技術體系中的關鍵要素。 對於那些尋求依賴有史以來最著名和最神秘的交易員之一——威廉·德爾伯特·江恩所開發的原理來識別潛在反轉點和關鍵價格水平的交易員來說,這個指標是一個有價值的工具。理解他的哲學和方法可以顯著擴展您的交易能力。 威廉·德爾伯特·江恩:技術分析的傳奇人物: 威廉·德爾伯特·江恩(1878-1955)是一位傑出的金融分析師、股票市場交易員,也是眾多技術分析書籍和課程的作者。他的市場研究涵蓋了數學、幾何學、天文學,甚至古代的數字命理學體系。江恩認為,市場按照特定的數學定律和重複的週期運行,而這些定律和週期可以使用他的獨特方法來預測。 他的交易技巧以複雜性和精確性著稱。江恩採用了各種工具,包括江恩角度線、江恩扇形線、江恩方格(尤其是九方圖、六邊形和 360 度圓)、時間週期和關

Resistance Support Day:您的每日市場邊界導航器! 您是否厭倦了不斷重繪那些似乎只在短暫時間內相關的支撐和阻力位?您是否渴望獲得清晰、動態的關鍵價格閾值畫面,這些閾值是專門為每個交易日計算的,讓您能夠更自信和準確地做出明智的決策? 隆重推出 Resistance Support Day 指標 – 您可靠的工具,用於識別專為每個交易日計算的動態支撐和阻力位。此指標將成為您在當前交易時段做出明智交易決策不可或缺的助手,為您提供理解日內價格動態的優勢。 Resistance Support Day 指標的關鍵特徵:專注於當日 Resistance Support Day 指標側重於識別專門針對當前交易日最相關的重要支撐和阻力位。這些水平的計算基於前一個交易日的價格活動(或您選擇的設置,為您提供選擇計算時間範圍的靈活性),使交易者能夠及時對當前交易時段內潛在的趨勢反轉或延續做出反應。這種方法最大限度地減少了過時數據的影響,並將注意力集中在最新的市場信息上。 重要提示:正確操作的時間週期限制 Resistance Support Day 指標專為小於一天的日內週期圖表(例如
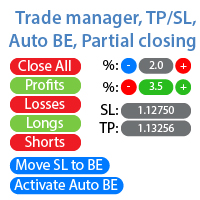
活跃和挂单管理:自动盈亏平衡、止盈/止损更改、部分/全部平仓、图表上水平的可视化显示 查看我的 #1 Utility :66+ 功能,包括 PRO 交易管理 | 联系我 如有任何问题 1) 主窗口:管理订单时,可以设置特定交易品种 [Symbol] 或选择所有交易品种 [ALL] 关闭所有活跃仓位 [ALL] 关闭所有盈利交易 [profits] 关闭所有亏损交易 [losses] 关闭所有多头交易(买入)[longs] 关闭所有空头交易(卖出)[shorts] 删除所有限价订单 [Delete limit orders] 删除所有止损订单 [Delete stop order] 右侧显示每个订单类别的当前浮动盈亏(以账户货币和当前余额百分比计算),并计算每个类别的订单数量。 2) 手动将交易调整为盈亏平衡 [- Move SL to BE now -]:SL 水平将移动到入场价格: 所有交易 [ALL] 买入交易 [longs] 卖出交易 [shorts] 如果利润超过: [if profit > than:] 指定的存款百分比 指定的货币利润(账户货币自动确定) 如果

这种用于从无穷远衡量货币强弱的创新指标是长期交易的黄牛和交易者不可或缺的助手。 分析货币强弱的系统早已被世界领先的交易者所熟知并在市场上使用。 没有这种分析,任何套利交易都是不完整的。 我们的指标很容易确定基础货币相对于彼此的强弱。 它显示所有或当前货币对的折线图,允许即时分析和搜索最强的入口点。 该指标直观,允许您快速找到并切换到任何一对,具有可放置在地下室和主图表上的移动面板。 通知货币强度变化的计时器模式使交易者有机会在手机上收到通知。
使用货币功率计无穷大指示器的几种策略:
1. 使用货币强度的线性显示图表搜索交叉点作为新兴趋势的信号 2. 在趋势反转信号出现后,向强势货币方向反弹 3. 使用货币强度发散分析扭转当前趋势 4. 使用其他无限指标向强势货币方向交易
FREE
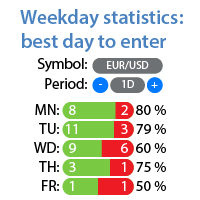
每周各天的盈亏统计 查看我的 #1 工具 : 66+ 功能,包括扩展统计 | 联系我 如有任何问题 统计显示模式: 针对 选定的 货币对/交易工具 针对 所有交易 (" ALL ") 您可以选择获取统计数据的时段: 1 天 1 周 1 个月 2 个月 3 个月 6 个月 1 年 2 年 全部交易历史 显示信息: 您将看到每周各天的统计数据:每天的盈利/亏损次数和胜率。
红色和绿色区域将帮助您直观地看到最适合交易的日子,以及那些最好避免交易的日子。 界面优势: 您可以 折叠面板 ,从而释放图表上的空间:(按钮 [^]); 您可以 移动面板 到图表上的任何位置:(按钮 [MOVE]); 深色/浅色界面主题 :(开关 [Dark]); 查看我的 #1 工具 : 66+ 功能,包括扩展统计 | 联系我 如有任何问题 //

"STOP CHASING THE MARKET. LET'S CATCH THOSE REVERSALS BEFORE THE CROWD DOES." "Signals for market reversals and precision entries inside the trend – proven effective and visible." Get the Forex Trend Commander indicator for FREE with your purchase of Trend Reverting PRO - no extra cost required.
Hey trader, if you are looking for a unique, dual-action tool that spots precise market turns and high-probability trend continuations - without the usual stress - you are in the right place. And yes,

多货币专家顾问3货币对. 您可以使用不同的对,在设置中设置。 添加新货币时,您只需要更改幻数。 然后产量会更高。 手数和平仓订单是从账户的免费资金计算出来的。 因此,您可以在同一时间与其他ea交易使用它。
Ea交易同时处理多个幻数,并使用它们关闭订单。
缩编增加很少,主要是当有在危机时期强烈的波动。 但在很短的时间内成功应对。 多货币专家顾问3货币对. 您可以使用不同的对,在设置中设置。 添加新货币时,您只需要更改幻数。 然后产量会更高。 手数和平仓订单是从账户的免费资金计算出来的。 因此,您可以在同一时间与其他ea交易使用它。
Ea交易同时处理多个幻数,并使用它们关闭订单。
缩编增加很少,主要是当有在危机时期强烈的波动。 但在很短的时间内成功应对。

The "Mjolnir" Expert Advisor is perfect for most Currency Pairs and Timeframes from M15 to H4, but it performs best on the "EUR/GBP M30" pair. It uses only two indicators "Bollinger Bands" and "Top Bottom Price". Each trade is protected by Stop Loss and Take Profit. In the parameters of the expert Advisor, you can change the percentage of the lot from the Deposit(by default, it is 5%), as well as the values of indicators, Stop Loss and Take Profit, if necessary. The test statistics for 4 y
学习如何在MetaTrader AppStore上购买EA交易,MetaTrader平台的应用程序商店。
MQL5.community支付系统支持通过PayPay、银行卡和热门付款系统进行交易。为更好的客户体验我们强烈建议您在购买前测试EA交易。
