文章 "从基础到中级:指标(三)"
我正试图在 iBand 的基础上创建自定义指标。
经过大量搜索,我决定在这里发帖,也许有人可以帮助我。
这是完整的指标。
问题 1 是:
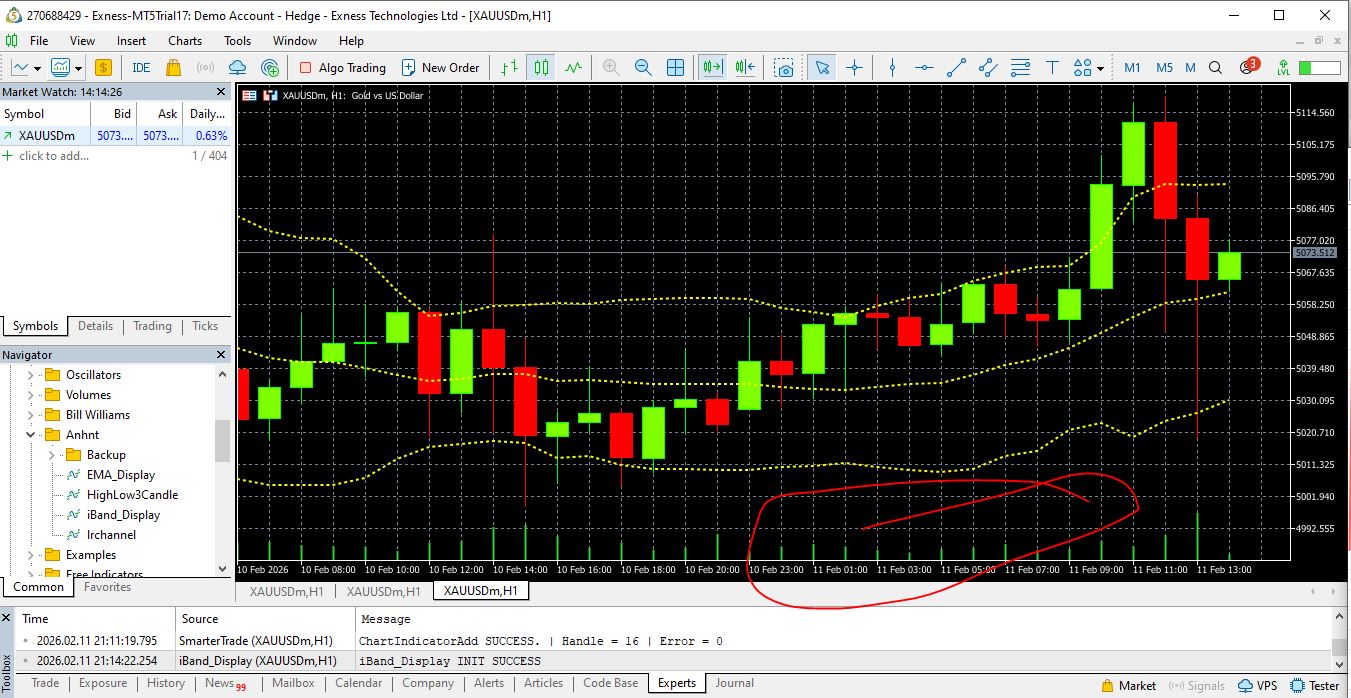
您可以在附件图片中看到,我不知道为什么我的图表下有绿色。
经过大量搜索,我决定在这里发帖,也许有人可以帮助我。
这是完整的指标。
//这是 MQL5\Indicators\Anhnt\iBand_Display.mq5 #property indicator_chart_window #property indicator_buffers 3 #property indicator_plots 3 //--- plot Middle #property indicator_label1 "Middle" #property indicator_type1 DRAW_LINE //--- plot Upper #property indicator_label2 "Upper" #property indicator_type2 DRAW_LINE //--- plot Lower #property indicator_label3 "Lower" #property indicator_type3 DRAW_LINE //================================================== // 输入参数 //================================================== input int InpBBPeriod = 14; input ENUM_APPLIED_PRICE inp_Applied_Price = PRICE_MEDIAN; input double InpBBDeviation = 2.0; input int InpBBShift = 0; input color InpMiddleColor = clrYellow; input color InpUpperColor = clrYellow; input color InpLowerColor = clrYellow; input int InpMiddleWidth = 2; input int InpUpperWidth = 2; input int InpLowerWidth = 2; input bool inp_BB_Show_Upper = true; input bool inp_BB_Show_Middle = true; input bool inp_BB_Show_Lower = true; input ENUM_LINE_STYLE InpMiddleStyle = STYLE_DOT; input ENUM_LINE_STYLE InpUpperStyle = STYLE_DOT; input ENUM_LINE_STYLE InpLowerStyle = STYLE_DOT; //================================================== #include <Anhnt/Configuration/NamingConfiguration.mqh> //================================================== // 指示器缓冲区 //================================================== double MiddleBuffer[]; double UpperBuffer[]; double LowerBuffer[]; //================================================== // 全局变量 //================================================== int g_bb_handle = INVALID_HANDLE; //https://www.mql5.com/zh/docs/indicators/ibands //--- 我们将保留布林线指标中的数值数量 //+------------------------------------------------------------------+ int OnInit() { //================================================== // 设置缓冲区 //================================================== SetIndexBuffer(BASE_LINE, MiddleBuffer, INDICATOR_DATA); SetIndexBuffer(UPPER_BAND, UpperBuffer, INDICATOR_DATA); SetIndexBuffer(LOWER_BAND, LowerBuffer, INDICATOR_DATA); ArraySetAsSeries(MiddleBuffer, true); ArraySetAsSeries(UpperBuffer, true); ArraySetAsSeries(LowerBuffer, true); //================================================== // 将 INPUT 值应用于绘图(运行时安全方法) //================================================== PlotIndexSetInteger(BASE_LINE, PLOT_LINE_COLOR, InpMiddleColor); PlotIndexSetInteger(UPPER_BAND, PLOT_LINE_COLOR, InpUpperColor); PlotIndexSetInteger(LOWER_BAND, PLOT_LINE_COLOR, InpLowerColor); PlotIndexSetInteger(BASE_LINE, PLOT_LINE_STYLE, InpMiddleStyle); PlotIndexSetInteger(UPPER_BAND, PLOT_LINE_STYLE, InpUpperStyle); PlotIndexSetInteger(LOWER_BAND, PLOT_LINE_STYLE, InpLowerStyle); PlotIndexSetInteger(BASE_LINE, PLOT_LINE_WIDTH, InpMiddleWidth); PlotIndexSetInteger(UPPER_BAND, PLOT_LINE_WIDTH, InpUpperWidth); PlotIndexSetInteger(LOWER_BAND, PLOT_LINE_WIDTH, InpLowerWidth); PlotIndexSetInteger( BASE_LINE, PLOT_DRAW_TYPE, inp_BB_Show_Middle ? DRAW_LINE : DRAW_NONE ); PlotIndexSetInteger( UPPER_BAND, PLOT_DRAW_TYPE, inp_BB_Show_Upper ? DRAW_LINE : DRAW_NONE ); PlotIndexSetInteger( LOWER_BAND, PLOT_DRAW_TYPE, inp_BB_Show_Lower ? DRAW_LINE : DRAW_NONE ); string name = SMT_PREFIX + SMT_BB_NAME + "(" + (string)InpBBPeriod + "," + DoubleToString(InpBBDeviation, 1) + ")"; IndicatorSetString(INDICATOR_SHORTNAME, name); //================================================== // 创建 iBands 句柄 //================================================== g_bb_handle = iBands( _Symbol, _Period, InpBBPeriod, InpBBShift, InpBBDeviation, inp_Applied_Price ); if(g_bb_handle == INVALID_HANDLE) { Print("iBand_Display INIT FAILED. Unable to create iBands handle. GetLastError = ", GetLastError()); return INIT_FAILED; } Print("iBand_Display INIT SUCCESS"); return INIT_SUCCEEDED; } //+------------------------------------------------------------------+ int OnCalculate( const int rates_total, const int prev_calculated, const datetime &time[], const double &open[], const double &high[], const double &low[], const double &close[], const long &tick_volume[], const long &volume[], const int &spread[] ) { //https://www.mql5.com/zh/docs/indicators/ibands&nbsp; //--- 等待 iBands 准备就绪 int calculated = BarsCalculated(g_bb_handle); if(calculated <= InpBBPeriod) return 0; // Print("DEBUG from OnCalculate After Waiting BarsCalculated | Symbol=", _Symbol、 // " | Period=", _Period、 // " | BarsCalculated(iBands)=", calculated); //--- 该代码块在指标最初连接到图表时执行 if(prev_calculated == 0) { ArrayInitialize(MiddleBuffer, EMPTY_VALUE); ArrayInitialize(UpperBuffer, EMPTY_VALUE); ArrayInitialize(LowerBuffer, EMPTY_VALUE); int to_copy = MathMin(calculated, rates_total); // 一次性复制所有可用数据 CopyBuffer(g_bb_handle, BASE_LINE, 0, to_copy, MiddleBuffer); CopyBuffer(g_bb_handle, UPPER_BAND, 0, to_copy, UpperBuffer); CopyBuffer(g_bb_handle, LOWER_BAND, 0, to_copy, LowerBuffer); // Print("DEBUG from OnCalculate First Initial | Symbol=", _Symbol、 // " | Period=", _Period、 // " | BarsCalculated(iBands)=", calculated); return rates_total; } //--- 每打开一个新的条形图块,都会执行该代码块 if(prev_calculated != rates_total && prev_calculated != 0) { //================================================== // NEXT RUNS: // 只更新最新的条形图(索引 0)。 // 不要手动移动数组(序列会处理)。 //================================================== double tmp[1]; if(CopyBuffer(g_bb_handle, BASE_LINE, 0, 1, tmp) > 0) MiddleBuffer[0] = tmp[0]; if(CopyBuffer(g_bb_handle, UPPER_BAND, 0, 1, tmp) > 0) UpperBuffer[0] = tmp[0]; if(CopyBuffer(g_bb_handle, LOWER_BAND, 0, 1, tmp) > 0) LowerBuffer[0] = tmp[0]; return rates_total; } return rates_total; } //+------------------------------------------------------------------+ bool FillArraysFromBuffers( double &base_values [], // 中部缓冲区 double &upper_values [], // 上层缓冲区 double &lower_values [], // LowerBuffer int shift, // shift = 0 → realtime int ind_handle, int amount ) { // NOTE: // 目前未使用。 // 按计划保留用于未来的辅助/EA 逻辑。 ResetLastError(); if(CopyBuffer(ind_handle, BASE_LINE, -shift, amount, base_values) < 0) return false; if(CopyBuffer(ind_handle, UPPER_BAND, -shift, amount, upper_values) < 0) return false; if(CopyBuffer(ind_handle, LOWER_BAND, -shift, amount, lower_values) < 0) return false; return true; }非常简单,我只想让用户能够显示或隐藏单条线,如 BASE_LINE、UPPER_BAND、LOWER_BAND 和自定义颜色。
问题 1 是:
您可以在附件图片中看到,我不知道为什么我的图表下有绿色。
附加的文件:
Problem_1.jpg
217 kb
新文章 从基础到中级:指标(三)已发布:
在上一篇文章“从初级到中级:指标(二)”中,我们学到了很多东西,因为它演示了如何以非常简单、实用和功能齐全的方式实现移动平均线。然而,所展示的内容只能被视为对 MQL5 编程世界的简要介绍,因为该材料非常基础、简单和直接。 但我们还可以做得更多。
因此,请努力理解这里提出的概念。不要只是复制代码,也不要认为如果你做不到,其他人也做不到。理解概念比理解代码本身更重要,因为代码可能因编写者而异,而概念保持不变。我们将从一些非常简单的东西开始,因为如果我们突然应用某些功能,您将看到的内容可能会变得非常复杂。
作者:CODE X