文章 "聚类分析(第一部分):精通指标线的斜率"
Carl Schreiber:
在这里,编译没有任何问题。
请说明编译器抱怨的原因和内容。
问题出在我这边,我已经更新了 MT5,现在一切正常。
卡尔,你好、
我对你的工作很感兴趣,我曾考虑过一种分析指标斜率的方法,但这种方法似乎更好,所以我会密切关注你的文章。
如果您能在打印输出中添加列标题和行号,将大有帮助。如果您愿意,我会做的,并把结果转发给您。
我期待着您的下一篇文章。
CapeCoddah:
嗨,卡尔、
我对你的工作很感兴趣,我曾考虑过一种分析指标斜率的方法,但这种方法似乎更好,所以我会密切关注你的文章。
如果您能在打印输出中添加列标题和行号,将大有帮助。如果您愿意,我可以这样做,并将结果转发给您。
我期待着您的下一篇文章。
?
你没看到标题吗?
GBPUSD PERIOD_D1 HalfTrd 2 ID Cluster Num. (tot %) µ (mult*µ) σ (Range %) min - max
后面是几行数字
GBPUSD PERIOD_D1 HalfTrd 2 100100 learn 100% all[9] 7266 (100.0%) 217.6 (1.00*µ) 1800.0 (1.21%) 0.0 - 148850.0
文章未经审核。
翻译质量差。
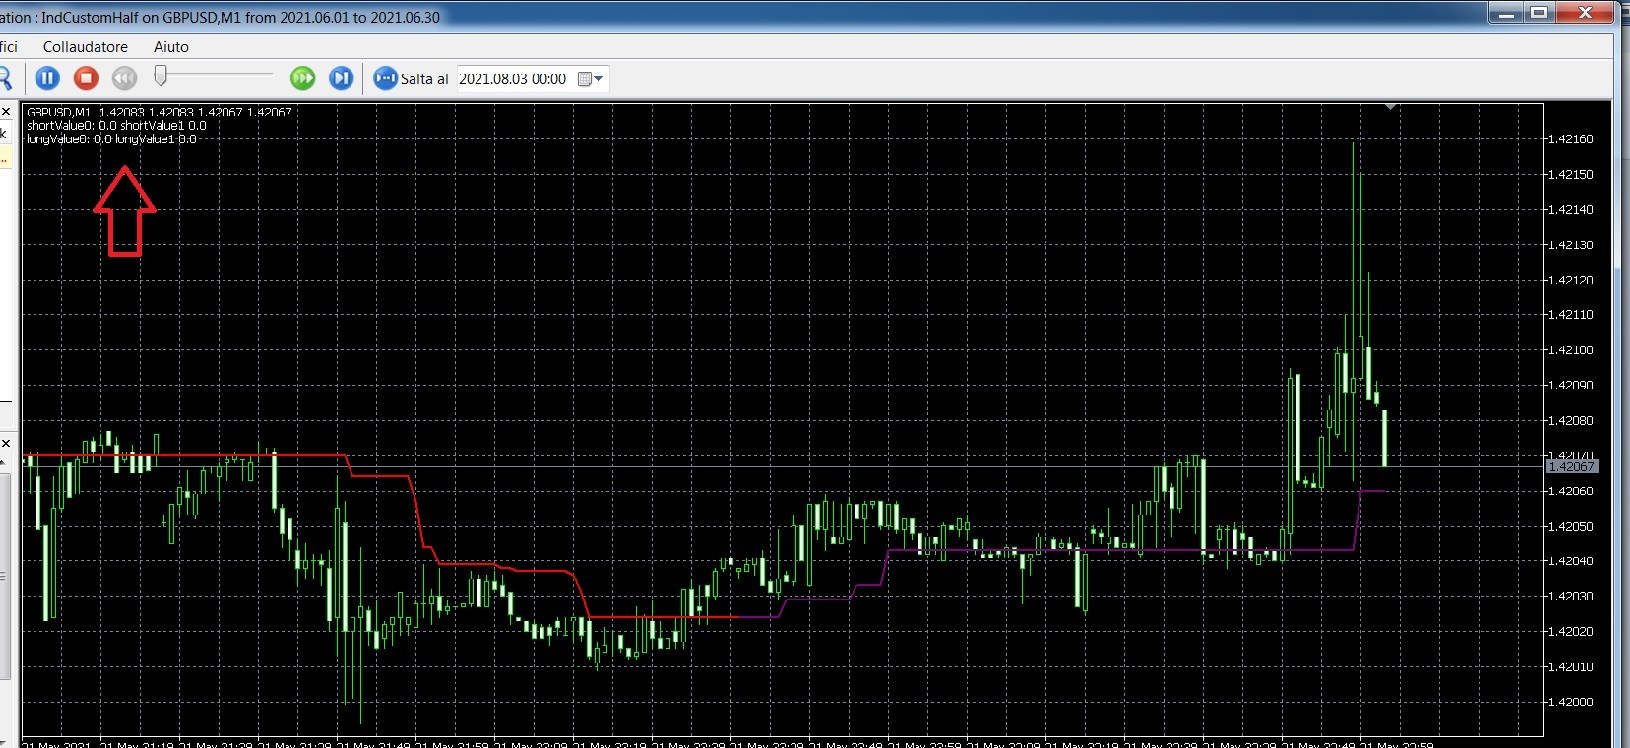
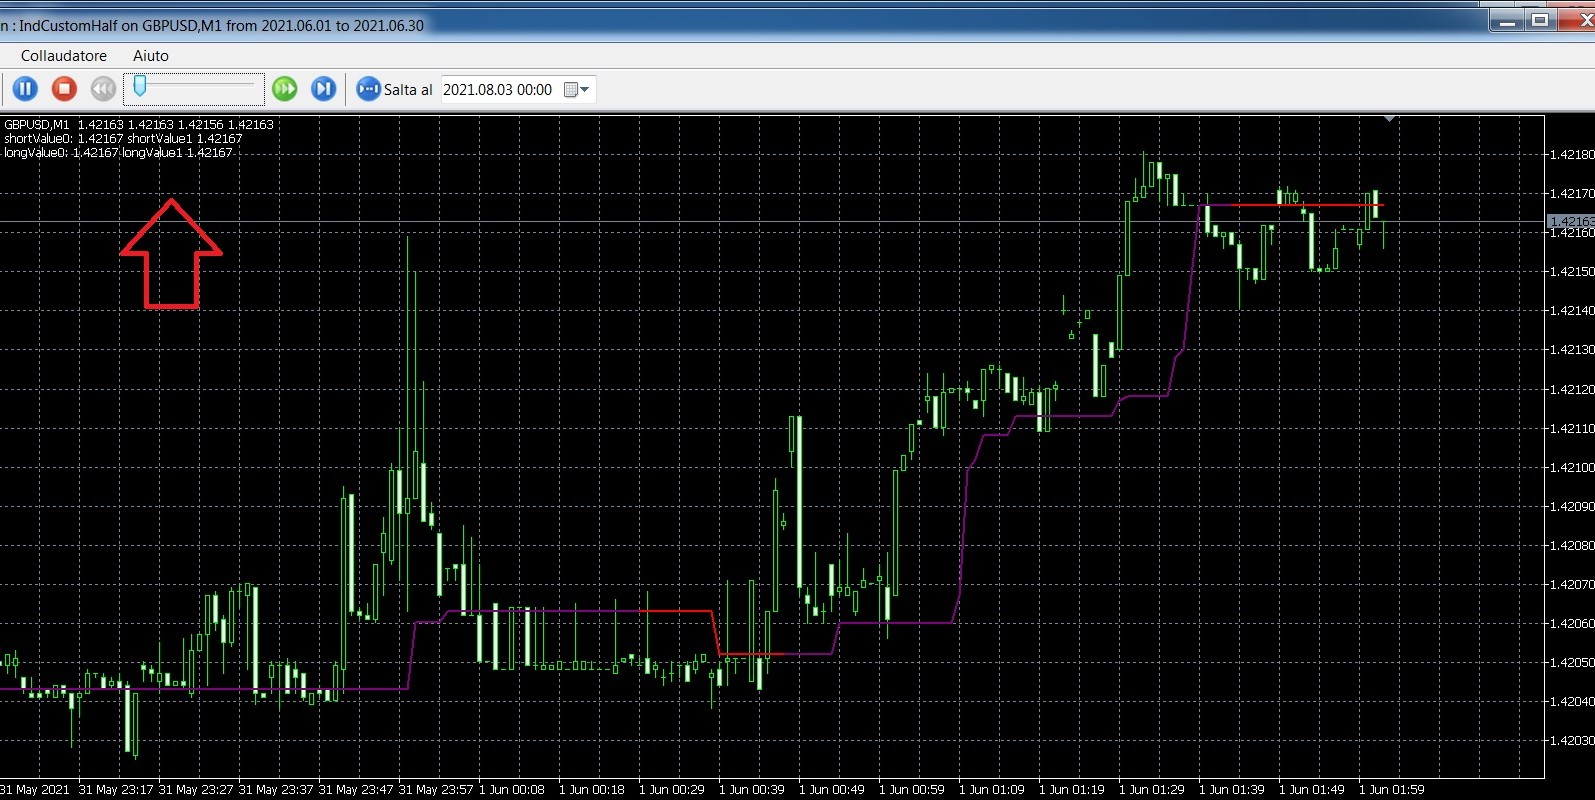
input uint Amplitude=10;
uint CorrelationDefination, CorrelationDefination2;
int OnInit()
  {
//---
    CorrelationDefination=iCustom(NULL,Period(),"half-trend-analysingTrend",10,false,false,false,false,false,false,false,1,PRICE_CLOSE);
    CorrelationDefination2=iCustom(NULL,Period(),"half-trend-analysingTrend",10,false,false,false,false,false,false,false,1,PRICE_CLOSE);
//-
//---
   return(INIT_SUCCEEDED);
  }
//+------------------------------------------------------------------+
//| 专家去初始化函数|
//+------------------------------------------------------------------+
void OnDeinit(const int reason)
  {
//---

  }
//+------------------------------------------------------------------+
//| 专家勾选功能|
//+------------------------------------------------------------------+
void OnTick()
  {
//---
   double short_period[];
   double long_period[];
   ArraySetAsSeries(short_period,true);
   ArraySetAsSeries(long_period,true);
   CopyBuffer(CorrelationDefination,1,0,3,short_period);
   CopyBuffer(CorrelationDefination2,1,0,3,long_period);
   double shortValue0=short_period[0];
   double longValue0=long_period[0];
   double shortValue1=short_period[1];
   double longValue1=long_period[1];
   Comment("shortValue0: ",shortValue0," shortValue1 ",shortValue1,"\n",
           "longValue0: ",longValue0," longValue1 ",longValue1);
  }
嗨,卡尔,我不记得它是 castom 指标,我附上了代码。仅适用于 DOWN 挡板 (shortValue)
SergioTForex:
嗨,卡尔,我不记得它是 castom 指标,我附上了代码。仅适用于 DOWN 挡板 (shortValue)
问题出在哪里?您一定改变了什么(由于 PRICE_CLOSE(价格关闭),但这是正常的),但这样我就帮不了您了。
您能在图表上启动它吗?
新文章 聚类分析(第一部分):精通指标线的斜率已发布:
聚类分析是人工智能最重要的元素之一。 在本文中,我尝试应用指标斜率的聚类分析来获得阈值,据其判定行情是横盘、亦或跟随趋势。
作为指标,我采用来自 MQ 的 “HalfTrend”,它附于文后。 它有更长的水平运行旅程:
对于这个指标,我现在的问题在于它是否有明确的分离,即可被解释为横盘迹象的阈值,和一个表明无论是上涨亦或下跌趋势的阈值。 当然,每个人都会立即看到,如果该指标恰好是水平的,则行情为横盘。 但行情的斜率高度变化如此之小,以至于仍然认为行情处于横盘,并自某个高度开始必须假设其为趋势。 想象一下 EA 只看到一个数字,其中浓缩了整个图表图片,而不是我们在上图中看到的较大的图片。 这将通过聚类分析来解决。 但在我们转向聚类分析之前,我们首先研究在指标中所做的修改。
作者:Carl Schreiber