指标: ATRStops_v1.1_Alert
帮助,由于某些原因,终端没有绘制上部红线,只绘制了下部蓝线。
Альберт Туйкин:
救命啊!不知什么原因,在终端上没有画出上面的红线,只画出了下面的蓝线。
我又检查了一遍,指标运行完全正常!
救命啊!不知什么原因,在终端上没有画出上面的红线,只画出了下面的蓝线。
Nikolay Kositsin:
我再次检查了一切,该指标完全正常!
我再次检查了一切,该指标完全正常!
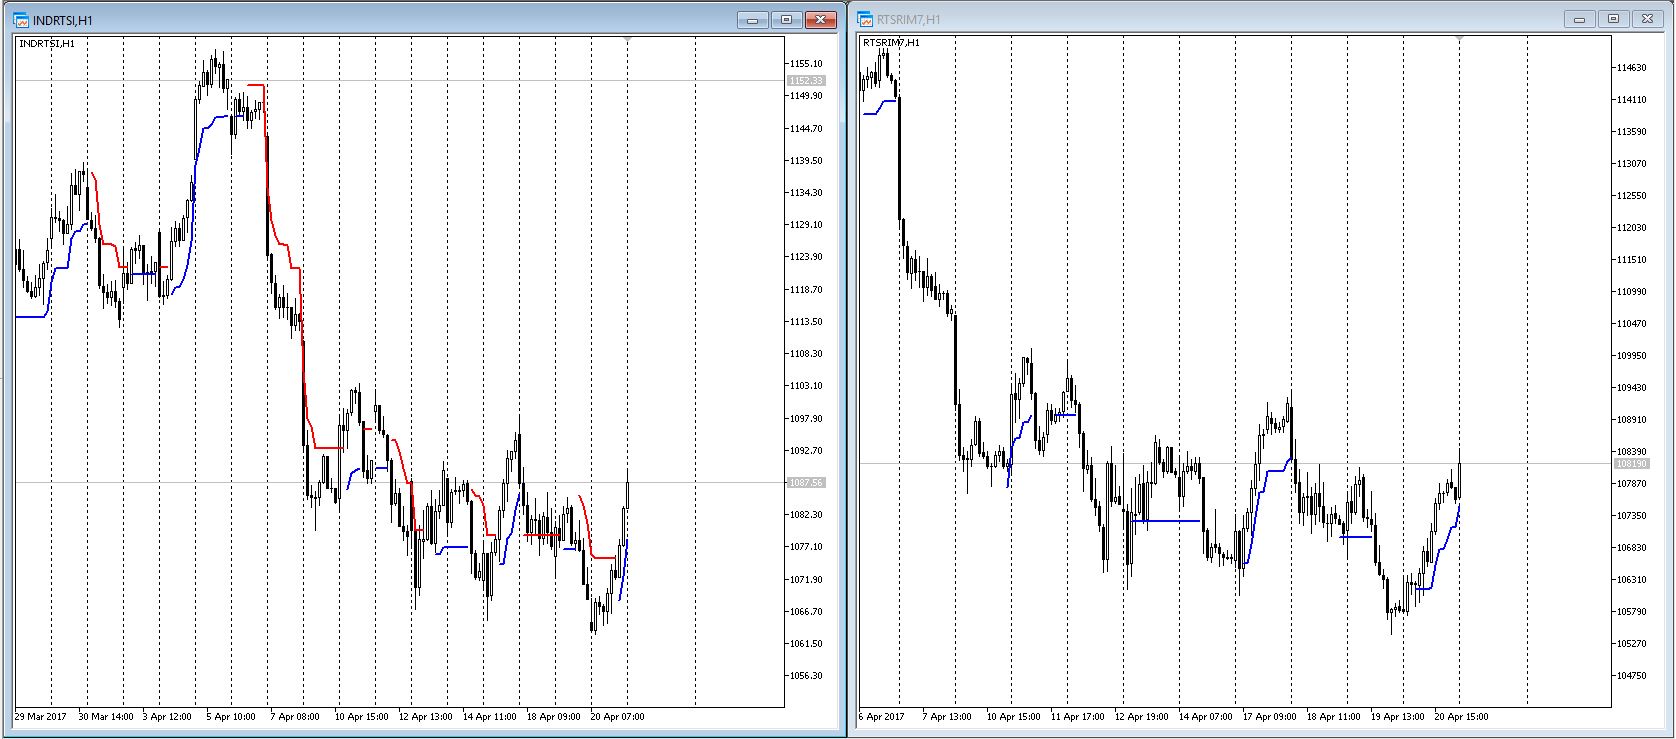
在大多数图表上都运行正常。但在两个图表上,它没有画出红线:(
Альберт Туйкин:
它在大多数图表上都能正常工作。但在两个图表上却画不出红线 :(
当一个人遇到问题时,如何以周围的人都能看到的方式向周围的人传达这个问题完全取决于他自己。
它在大多数图表上都能正常工作。但在两个图表上却画不出红线 :(
Альберт Туйкин:
很明显,代码作者在源代码中设置的全局底部和上限的尺寸太小了。我们将尽快修改代码。 对不起,我添加了截图。
例如,在 RTS 指数图上一切正常,但在 RTS 期货图上只有一条蓝线。
//+------------------------------------------------------------------+
//|ATRStops_v1.1_Alert.mq5 | |
//|Copyright © 2006, Forex-TSD.com
//| 作者:IgorAD,igorad2003@yahoo.co.uk |
//|http://finance.groups.yahoo.com/group/TrendLaboratory||
//+------------------------------------------------------------------+
//---- 指标作者
#property copyright "版权所有 © 2006, Forex-TSD.com "
//---- 作者网站链接
#property link      "http://www.forex-tsd.com/"
//---- 指标版本号
#property version   "1.10"
//---- 在主窗口中绘制指示器
#property indicator_chart_window
//---- 4 个缓冲区用于计算和绘制指示器
#property indicator_buffers 4
//---- 使用了 4 种图形结构
#property indicator_plots   4
//+----------------------------------------------+
//|| 看涨指标的绘制参数
//+----------------------------------------------+
//---- 将指标 1 画成一条直线
#property  indicator_type1   DRAW_LINE
//---- 蓝色用作指示线颜色
#property  indicator_color1  clrBlue
//---- 指示线 1 - 实线
#property  indicator_style1  STYLE_SOLID
//---- 指标 1 的线条粗细为 2
#property  indicator_width1  2
//---- 显示指示线标记
#property  indicator_label1  "Upper ATRStops_v1.1"
//+----------------------------------------------+
//||| 看跌指标渲染参数
//+----------------------------------------------+
//---- 将指标 2 画成一条直线
#property  indicator_type2   DRAW_LINE
//---- 印度红用作指示线颜色
#property  indicator_color2  clrIndianRed
//---- 指标 2 - 实线
#property  indicator_style2  STYLE_SOLID
//---- 指标 2 线条粗细为 2
#property  indicator_width2  2
//---- 显示指示线标记
#property  indicator_label2  "Lower ATRStops_v1.1"
//+----------------------------------------------+
//|| 看涨指标的绘制参数
//+----------------------------------------------+
//---- 绘制指标 3 的图标
#property  indicator_type3   DRAW_ARROW
//---- 颜色 蓝色用作指示灯颜色
#property  indicator_color3  clrBlue
//---- 指示器 3 的厚度为 4
#property  indicator_width3  4
//---- 显示器指示标签
#property  indicator_label3  "Buy ATRStops_v1.1"
//+----------------------------------------------+
//||| 看跌指标渲染参数
//+----------------------------------------------+
//---- 绘制指标 4 的图标
#property  indicator_type4   DRAW_ARROW
//---- 使用红色作为指示色
#property  indicator_color4  clrRed
//---- 指示器 4 的厚度为 4
#property  indicator_width4  4
//---- 显示器指示标签
#property  indicator_label4  "Sell ATRStops_v1.1"
//+----------------------------------------------+
//|| 指示器输入参数
//+----------------------------------------------+
input uint   Length=10;           // 指标周期
input uint   ATRPeriod=5;         // ATR 指标周期
input double Kv=2.5;              // ATR 波动率
input int    Shift=0;             // 以小节为单位的指标水平移动
input uint NumberofBar=1;         // 信号栏编号
input bool SoundON=true;          // 警报分辨率
input uint NumberofAlerts=2;      // 警报数量
input bool EMailON=false;         // 启用信号邮寄功能
input bool PushON=false;          // 启用向手机发送信号的功能
//+----------------------------------------------+
//---- 动态数组的声明,这些数组将进一步
//---- 将用作指示器缓冲区
double ExtMapBufferUp[];
double ExtMapBufferDown[];
double ExtMapBufferUp1[];
double ExtMapBufferDown1[];
//---- 为指标句柄声明整数变量
int ATR_Handle;
//---- 整数数据起始变量的声明
int min_rates_total;
//+------------------------------------------------------------------+
//| 自定义指示器初始化函数
//+------------------------------------------------------------------+
int OnInit()
  {
//---- 获取 ATR 指标句柄
   ATR_Handle=iATR(NULL,0,ATRPeriod);
   if(ATR_Handle==INVALID_HANDLE)
     {
      Print(" 获取 ATR 指标句柄失败");
      return(1);
     }

//---- 初始化数据启动变量
   min_rates_total=int(ATRPeriod+Length);

//---- 将动态数组 ExtMapBufferUp[] 转换为指示器缓冲区
   SetIndexBuffer(0,ExtMapBufferUp,INDICATOR_DATA);
//---- 按 Shift 键水平移动指示灯 1
   PlotIndexSetInteger(0,PLOT_SHIFT,Shift);
//---- 移动指示器绘制倒计时 1 的起始位置
   PlotIndexSetInteger(0,PLOT_DRAW_BEGIN,min_rates_total);
//---- 缓冲区中的项目索引,如时间序列中的索引
   ArraySetAsSeries(ExtMapBufferUp,true);
//---- 设置图表上不可见的指标值
   PlotIndexSetDouble(0,PLOT_EMPTY_VALUE,EMPTY_VALUE);

//---- 将动态数组 ExtMapBufferDown[] 转换为指示器缓冲区
   SetIndexBuffer(1,ExtMapBufferDown,INDICATOR_DATA);
//---- 通过 Shift 水平移动指示灯 2
   PlotIndexSetInteger(1,PLOT_SHIFT,Shift);
//---- 移动指示器绘制倒计时 2 的起始位置
   PlotIndexSetInteger(1,PLOT_DRAW_BEGIN,min_rates_total);
//---- 缓冲区中的项目索引,如时间序列中的索引
   ArraySetAsSeries(ExtMapBufferDown,true);
//---- 设置图表上不可见的指标值
   PlotIndexSetDouble(1,PLOT_EMPTY_VALUE,EMPTY_VALUE);

//---- 将动态数组 ExtMapBufferUp1[] 转换为指示器缓冲区
   SetIndexBuffer(2,ExtMapBufferUp1,INDICATOR_DATA);
//---- 按 Shift 键水平移动指示灯 1
   PlotIndexSetInteger(2,PLOT_SHIFT,Shift);
//---- 指示器绘图开始时的移位 3
   PlotIndexSetInteger(2,PLOT_DRAW_BEGIN,min_rates_total);
//---- 缓冲区中的项目索引,如时间序列中的索引
   ArraySetAsSeries(ExtMapBufferUp1,true);
//---- 设置图表上不可见的指标值
   PlotIndexSetDouble(2,PLOT_EMPTY_VALUE,EMPTY_VALUE);
//---- 字符为指示符
   PlotIndexSetInteger(2,PLOT_ARROW,175);

//---- 将动态数组 ExtMapBufferDown1[] 转换为指示器缓冲区
   SetIndexBuffer(3,ExtMapBufferDown1,INDICATOR_DATA);
//---- 通过 Shift 水平移动指示灯 2
   PlotIndexSetInteger(3,PLOT_SHIFT,Shift);
//---- 指示器绘图开始时的移位 4
   PlotIndexSetInteger(3,PLOT_DRAW_BEGIN,min_rates_total);
//---- 缓冲区中的项目索引,如时间序列中的索引
   ArraySetAsSeries(ExtMapBufferDown1,true);
//---- 设置图表上不可见的指标值
   PlotIndexSetDouble(3,PLOT_EMPTY_VALUE,EMPTY_VALUE);
//---- 字符为指示符
   PlotIndexSetInteger(3,PLOT_ARROW,175);

//---- 短指标名称变量的初始化
   string shortname;
   StringConcatenate(shortname,"ATRStops_v1.1(",Length,", ",ATRPeriod,", ",DoubleToString(Kv,4),", ",Shift,")");
//--- 创建一个名称,在单独的子窗口和工具提示中显示
   IndicatorSetString(INDICATOR_SHORTNAME,shortname);
//--- 确定显示指标值的准确性
   IndicatorSetInteger(INDICATOR_DIGITS,_Digits);
//----
   return(0);
  }
//+------------------------------------------------------------------+
//| 自定义指标迭代函数
//+------------------------------------------------------------------+
int OnCalculate(const int rates_total,    // 当前刻度线的历史条数
                const int prev_calculated,// 前一个刻度线的历史条数
                const datetime &time[],
                const double &open[],
                const double& high[],     // 用于指标计算的最大价格数组
                const double& low[],      // 用于指标计算的最小价格数组
                const double &close[],
                const long &tick_volume[],
                const long &volume[],
                const int &spread[])
  {
//---- 检查计算所需的条数是否足够
   if(BarsCalculated(ATR_Handle)<rates_total || rates_total<min_rates_total) return(0);

//---- 本地变量声明
   double ATR[];
   double smin0,smax0;
   int limit,to_copy,bar,trend0;
   static double smin1,smax1;
   static int trend1;

//---- 数组中元素的索引,如时间序列中的索引
   ArraySetAsSeries(close,true);
   ArraySetAsSeries(high,true);
   ArraySetAsSeries(low,true);
   ArraySetAsSeries(ATR,true);

//---- 计算条形图重新计算周期的起始限值编号
   if(prev_calculated>rates_total || prev_calculated<=0) // 检查指标计算是否首次开始
     {
      limit=rates_total-min_rates_total-1;               // 计算所有条形图的起始编号
      trend1=0;
      smin1=-999999;
      smax1=+999999;
     }
   else
     {
      limit=rates_total-prev_calculated;                 // 计算新条形的起始编号
     }

   to_copy=int(limit+Length);
//---- 将新出现的数据复制到数组中
   if(CopyBuffer(ATR_Handle,0,0,to_copy,ATR)<=0) return(0);

//---- 主要指标计算周期
   for(bar=limit; bar>=0; bar--)
     {
      ExtMapBufferUp[bar]=EMPTY_VALUE;
      ExtMapBufferDown[bar]=EMPTY_VALUE;
      ExtMapBufferUp1[bar]=EMPTY_VALUE;
      ExtMapBufferDown1[bar]=EMPTY_VALUE;

      smin0=-999999;
      smax0=+999999;

      for(int iii=0; iii<int(Length); iii++)
        {
         int barx=bar+iii;
         smin0=MathMax(smin0,high[barx]-Kv*ATR[barx]);
         smax0=MathMin(smax0,low[barx]+Kv*ATR[barx]);
        }

      trend0=trend1;
      if(close[bar]>smax1) trend0=+1;
      if(close[bar]<smin1) trend0=-1;

      if(trend0>0)
        {
         if(smin0<smin1) smin0=smin1;
         ExtMapBufferUp[bar]=smin0;
        }

      if(trend0<0)
        {
         if(smax0>smax1) smax0=smax1;
         ExtMapBufferDown[bar]=smax0;
        }

      if(ExtMapBufferUp[bar+1]==EMPTY_VALUE && ExtMapBufferUp[bar]!=EMPTY_VALUE) ExtMapBufferUp1[bar]=ExtMapBufferUp[bar];
      if(ExtMapBufferDown[bar+1]==EMPTY_VALUE && ExtMapBufferDown[bar]!=EMPTY_VALUE) ExtMapBufferDown1[bar]=ExtMapBufferDown[bar];

      if(bar>0)
        {
         smin1=smin0;
         smax1=smax0;
         trend1=trend0;
        }
     }
//---
   BuySignal("ATRStops_v1.1_Alert",ExtMapBufferUp1,rates_total,prev_calculated,close,spread);
   SellSignal("ATRStops_v1.1_Alert",ExtMapBufferDown1,rates_total,prev_calculated,close,spread);
//---
   return(rates_total);
  }
//+------------------------------------------------------------------+
//| 购买信号功能|
//+------------------------------------------------------------------+
void BuySignal(string SignalSirname,      // 用于邮件和推送信号的指标名称文本
               double &BuyArrow[],        // 显示买入信号的指标缓冲区
               const int Rates_total,     // 当前条数
               const int Prev_calculated, // 前一个刻度线的条数
               const double &Close[],     // 收盘价
               const int &Spread[])       // 传播
  {
//---
   static uint counter=0;
   if(Rates_total!=Prev_calculated) counter=0;

   bool BuySignal=false;
   bool SeriesTest=ArrayGetAsSeries(BuyArrow);
   int index;
   if(SeriesTest) index=int(NumberofBar);
   else index=Rates_total-int(NumberofBar)-1;
   if(NormalizeDouble(BuyArrow[index],_Digits) && BuyArrow[index]!=EMPTY_VALUE) BuySignal=true;
   if(BuySignal && counter<=NumberofAlerts)
     {
      counter++;
      MqlDateTime tm;
      TimeToStruct(TimeCurrent(),tm);
      string text=TimeToString(TimeCurrent(),TIME_DATE)+" "+string(tm.hour)+":"+string(tm.min);
      SeriesTest=ArrayGetAsSeries(Close);
      if(SeriesTest) index=int(NumberofBar);
      else index=Rates_total-int(NumberofBar)-1;
      double Ask=Close[index];
      double Bid=Close[index];
      SeriesTest=ArrayGetAsSeries(Spread);
      if(SeriesTest) index=int(NumberofBar);
      else index=Rates_total-int(NumberofBar)-1;
      Bid+=Spread[index]*_Point;
      string sAsk=DoubleToString(Ask,_Digits);
      string sBid=DoubleToString(Bid,_Digits);
      string sPeriod=GetStringTimeframe(ChartPeriod());
      if(SoundON) Alert("BUY signal \n Ask=",Ask,"\n Bid=",Bid,"\n currtime=",text,"\n Symbol=",Symbol()," Period=",sPeriod);
      if(EMailON) SendMail(SignalSirname+": BUY signal alert","BUY signal at Ask="+sAsk+", Bid="+sBid+", Date="+text+" Symbol="+Symbol()+" Period="+sPeriod);
      if(PushON) SendNotification(SignalSirname+": BUY signal at Ask="+sAsk+", Bid="+sBid+", Date="+text+" Symbol="+Symbol()+" Period="+sPeriod);
     }

//---
  }
//+------------------------------------------------------------------+
//| 卖出信号功能|
//+------------------------------------------------------------------+
void SellSignal(string SignalSirname,      // 用于邮件和推送信号的指标名称文本
                double &SellArrow[],       // 显示买入信号的指标缓冲区
                const int Rates_total,     // 当前条数
                const int Prev_calculated, // 前一个刻度线的条数
                const double &Close[],     // 收盘价
                const int &Spread[])       // 传播
  {
//---
   static uint counter=0;
   if(Rates_total!=Prev_calculated) counter=0;

   bool SellSignal=false;
   bool SeriesTest=ArrayGetAsSeries(SellArrow);
   int index;
   if(SeriesTest) index=int(NumberofBar);
   else index=Rates_total-int(NumberofBar)-1;
   if(NormalizeDouble(SellArrow[index],_Digits) && SellArrow[index]!=EMPTY_VALUE) SellSignal=true;
   if(SellSignal && counter<=NumberofAlerts)
     {
      counter++;
      MqlDateTime tm;
      TimeToStruct(TimeCurrent(),tm);
      string text=TimeToString(TimeCurrent(),TIME_DATE)+" "+string(tm.hour)+":"+string(tm.min);
      SeriesTest=ArrayGetAsSeries(Close);
      if(SeriesTest) index=int(NumberofBar);
      else index=Rates_total-int(NumberofBar)-1;
      double Ask=Close[index];
      double Bid=Close[index];
      SeriesTest=ArrayGetAsSeries(Spread);
      if(SeriesTest) index=int(NumberofBar);
      else index=Rates_total-int(NumberofBar)-1;
      Bid+=Spread[index]*_Point;
      string sAsk=DoubleToString(Ask,_Digits);
      string sBid=DoubleToString(Bid,_Digits);
      string sPeriod=GetStringTimeframe(ChartPeriod());
      if(SoundON) Alert("SELL signal \n Ask=",Ask,"\n Bid=",Bid,"\n currtime=",text,"\n Symbol=",Symbol()," Period=",sPeriod);
      if(EMailON) SendMail(SignalSirname+": SELL signal alert","SELL signal at Ask="+sAsk+", Bid="+sBid+", Date="+text+" Symbol="+Symbol()+" Period="+sPeriod);
      if(PushON) SendNotification(SignalSirname+": SELL signal at Ask="+sAsk+", Bid="+sBid+", Date="+text+" Symbol="+Symbol()+" Period="+sPeriod);
     }
//---
  }
//+------------------------------------------------------------------+
//| 获取字符串形式的时间范围|
//+------------------------------------------------------------------+
string GetStringTimeframe(ENUM_TIMEFRAMES timeframe)
  {
//----
   return(StringSubstr(EnumToString(timeframe),7,-1));
//----
  }
//+------------------------------------------------------------------+
谢谢,成功了!
您好、
能否在属性中添加英文,以便我们理解。
谢谢
ATRStops_v1.1_Alert:
实现为 NRTR 的趋势指标,并且有功能可以生成提醒,发送电子邮件或者推送通知。
作者: Nikolay Kositsin