指标: 支撑和阻力

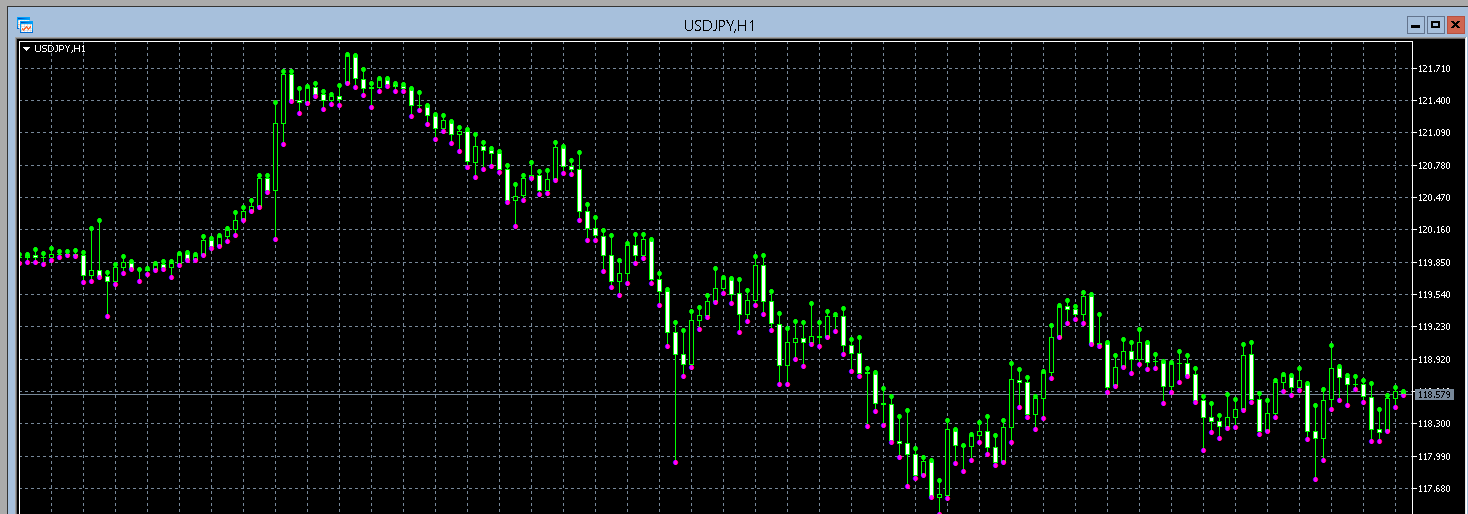
自从 MT5 上次更新后,这个指标就坏了。它只是在每根蜡烛的最高点和最低点上打印点。
怎么了?
yohmm:
该指标工作正常。版本 1016.
自从 MT5 上次更新后,这个指标就坏了。它只是在每根蜡烛的最高点和最低点上打印点。
这是怎么回事?
是的,我的版本是 1016。我再次下载了该指标并重新编译,没有出现任何错误和警告。还是不行,只是在高点和低点上显示点。
不过没关系,我现在自己使用斐波回撤或绘制 s/r 水平线。
yohmm:
能上传图表吗?
是的,我的版本是 1016。我再次下载了该指标并重新编译,没有出现任何错误和警告。还是不行,只是在高点和低点上显示点。
不过没关系,我现在使用斐波回撤或自己绘制 s/r 水平线。
belido:
您能上传图表吗?
您能上传图表吗?
当然可以,就在这里:
MetaQuotes Software Corp., MetaTrader 5, 演示版
temp_file_screenshot_27398.png

试试这个
//+------------------------------------------------------------------+
//|支撑位和阻力位。mq5
//|版权 © 2005, Dmitry |
//|2014 年 12 月更新
//+------------------------------------------------------------------+
#property copyright "Copyright © 2006, MetaQuotes Software Corp.
#property link      "http://www.metaquotes.net/"
//---- 版本
#property version   "1.01"
//---- 图表窗口中的指标
#property indicator_chart_window
//---- 使用 2 个指示器缓冲区
#property indicator_buffers 2
//---- 使用了 2 幅图形图
#property indicator_plots   2
//+----------------------------------------------+
//| 看跌指标选项
//+----------------------------------------------+
//---- 绘图类型为箭头
#property indicator_type1   DRAW_ARROW
//---- 品红色
#property indicator_color1  Magenta
//---- 行宽
#property indicator_width1  1
//---- 支持标签
#property indicator_label1  "Support"
//+----------------------------------------------+
//| 看涨指标选项
//+----------------------------------------------+
//---- 绘图类型为箭头
#property indicator_type2   DRAW_ARROW
//---- 石灰色
#property indicator_color2  Lime
//---- 行宽
#property indicator_width2  1
//---- 阻力标签
#property indicator_label2 "Resistance"

//+----------------------------------------------+
//| 指标输入参数
//+----------------------------------------------+
//输入 int iPeriod=70; // ATR 周期
//+----------------------------------------------+

//---- 动态数组声明,用作指示器缓冲区
double SellBuffer[];
double BuyBuffer[];
//---
int StartBars;
int FRA_Handle;
//+------------------------------------------------------------------+
//| 自定义指示器初始化函数
//+------------------------------------------------------------------+
void OnInit()
  {
//---- 全局变量的初始化
   StartBars=6;
//---- 获取 iFractals 指标句柄
   FRA_Handle=iFractals(NULL,0);
   if(FRA_Handle==INVALID_HANDLE)Print(" INVALID_HANDLE FRA");

//---- 将 SellBuffer 设置为指标缓冲区
   SetIndexBuffer(0,SellBuffer,INDICATOR_DATA);
//---- 设置绘制开始条形图的 indxex
   PlotIndexSetInteger(0,PLOT_DRAW_BEGIN,StartBars);
//---- 设置支持标签
   PlotIndexSetString(0,PLOT_LABEL,"Support");
//---- 设置箭头字符代码
   PlotIndexSetInteger(0,PLOT_ARROW,159);
//---- 设置索引为时间序列
   ArraySetAsSeries(SellBuffer,true);

//---- 将 BuyBuffer 设置为指标缓冲区
   SetIndexBuffer(1,BuyBuffer,INDICATOR_DATA);
//---- 设置绘制开始条形图的索引
   PlotIndexSetInteger(1,PLOT_DRAW_BEGIN,StartBars);
//--- 设置阻力标签
   PlotIndexSetString(1,PLOT_LABEL,"Resistance");
//---- 设置箭头字符代码
   PlotIndexSetInteger(1,PLOT_ARROW,159);
//---- 设置索引为时间序列
   ArraySetAsSeries(BuyBuffer,true);

//---- 设置精度
   IndicatorSetInteger(INDICATOR_DIGITS,_Digits);
//---- 指标简称
   string short_name="Support & Resistance";
   IndicatorSetString(INDICATOR_SHORTNAME,short_name);
//----
  }
//+------------------------------------------------------------------+
//| 自定义指标迭代函数|
//+------------------------------------------------------------------+
int OnCalculate(const int rates_total,
                const int prev_calculated,
                const datetime &time[],
                const double &open[],
                const double &high[],
                const double &low[],
                const double &close[],
                const long &tick_volume[],
                const long &volume[],
                const int &spread[]
                )
  {
//---- 检查条形图
   if(BarsCalculated(FRA_Handle)<rates_total
      || rates_total<StartBars)
      return(0);

//---- 本地变量的声明
   int to_copy,limit,bar;
   double FRAUp[],FRALo[];

//---- 计算要复制的条形图
//---- 和条形图重新计算循环的起始索引(限值)。
   if(prev_calculated>rates_total || prev_calculated<=0)// 检查第一次调用
     {
      to_copy=rates_total;           // 要复制的条形图
      limit=rates_total-StartBars-1; // 起始索引
     }
   else
     {
      to_copy=rates_total-prev_calculated+3; // 要复制的条形图
      limit=rates_total-prev_calculated+2;   // 起始索引
     }

//---- 设置索引为时间序列
   ArraySetAsSeries(FRAUp,true);
   ArraySetAsSeries(FRALo,true);
   ArraySetAsSeries(high,true);
   ArraySetAsSeries(low,true);

//---- 将指标数据复制到数组中
   if(CopyBuffer(FRA_Handle,0,0,to_copy,FRAUp)<=0) return(0);
   if(CopyBuffer(FRA_Handle,1,0,to_copy,FRALo)<=0) return(0);

//---- 主循环
   for(bar=limit; bar>=0; bar--)
     {
       BuyBuffer[bar] = 0.0;
       SellBuffer[bar] = 0.0;


       if(FRAUp[bar] != DBL_MAX) BuyBuffer[bar] = high[bar]; else BuyBuffer[bar] = BuyBuffer[bar+1];


       if(FRALo[bar] != DBL_MAX) SellBuffer[bar] = low[bar]; else SellBuffer[bar] = SellBuffer[bar+1];
     }
//----
   return(rates_total);
  }
//+------------------------------------------------------------------+
支撑和阻力:
“支撑和阻力”指标使用比尔威廉的分形指标显示支撑和阻力水平。
作者: Nikolay Kositsin