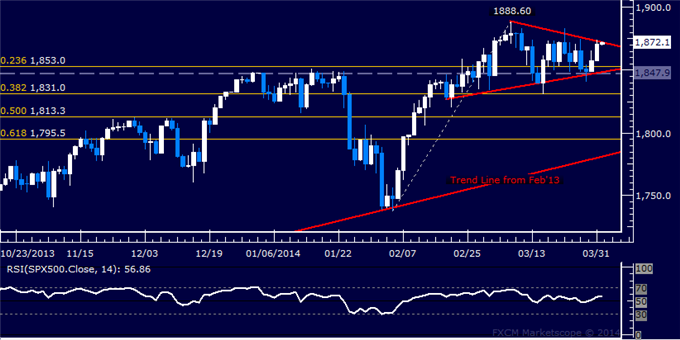
S&P 500 TECHNICAL ANALYSIS – Prices remain in consolidation mode above support is in the 1847.90-53.00 area, marked by the 23.6% Fibonacci expansion, the December 31 close, and the bottom of an
Forum on trading, automated trading systems and testing trading strategies Press review newdigital , 2014.03.31 14:31 2014-03-31 12:30 GMT (or 14:30 MQ MT5 time) | [CAD - GDP] past data is -0.5%
MQL5 Wizard para "Dummies" A principios de 2011 lanzamos la primera versión del MQL5 Wizard. Esta nueva aplicación facilita a los traders una herramienta simple y conveniente para generar
Alibaba Will Pay $692M For 35% Stake In Retail Operator Intime Alibaba and Intime said in a press statement that they will develop online-to-offline (O2O) initiatives in order to “provide a more
- В чём заключается основной принцип буддизма? - Подожди, - сказал Суйби. - Когда мы останемся одни, я тебе скажу. Через некоторое время Сэйкэй снова обратился к нему: - Ну вот теперь мы одни, умоляю тебя, объясни. Суйби встал и повёл сгорающего от нетерпения Сэйкея в бамбуковую рощу, но так ничего и не сказал, а когда последний настоятельно потребовал ответа, он шёпотом промолвил: - Какие высокие эти деревья, и какие маленькие те, вон там.
Не ждите совершенства, и не просите и не требуйте его. Любите обычных людей. Нет ничего плохого в обычных людях. Обычные люди — необычны. Каждый человек так уникален. Уважайте эту уникальность.
Kaori Kobayashi Live at Java Jazz Festival 2013 1 England Funk 2 One 3 Little Tune Medley 4 Lovin' U 5 Nothing's Nothing Gonna Change My Love For You 6 Great India 7 City Lights
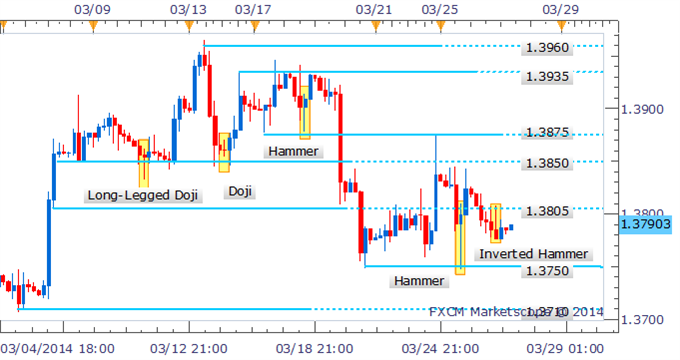
Drilling down to the four hour chart:- an Inverted Hammer formation has warned of an intraday bounce for EUR/USD. However follow-through has been limited, which suggests the signal may have been overlooked by traders given noteworthy resistance at 1.3805 is hanging nearby
Bitcoin Tumbles on Rumors of PBOC’s Order for Accounts Shutdown (based on forexminute article ) Bitcoin prices plummeted nearly 10 percent on Thursday as news filtered in that China’s central bank had