|
yok
deneyim
|
13
ürünler
|
9
demo sürümleri
|
|
8
işler
|
0
sinyaller
|
0
aboneler
|
CEO
at
Aviv luxury homes
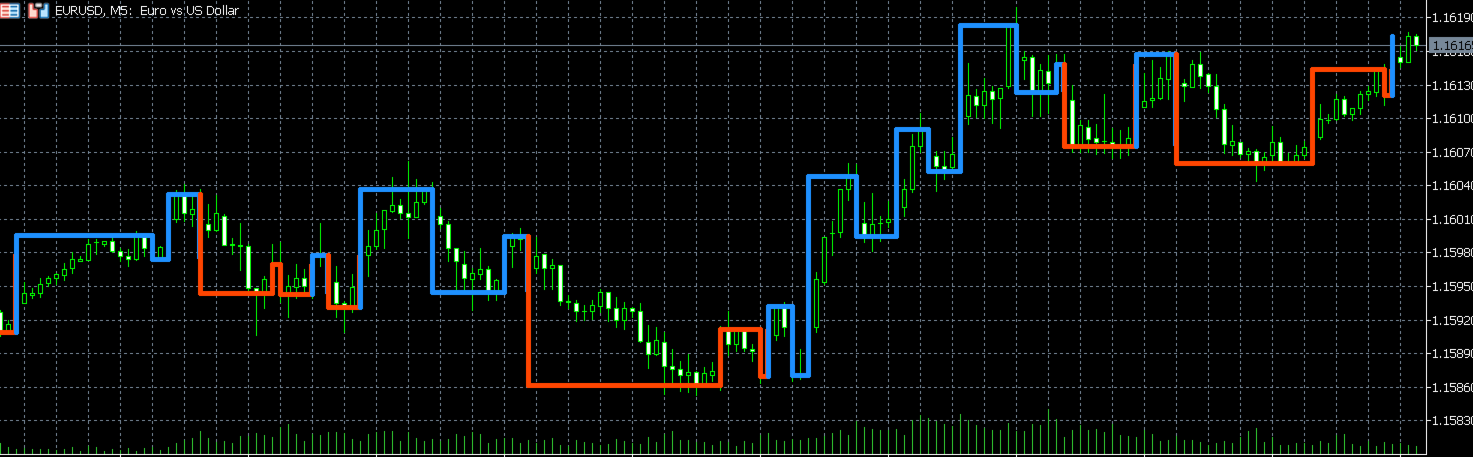
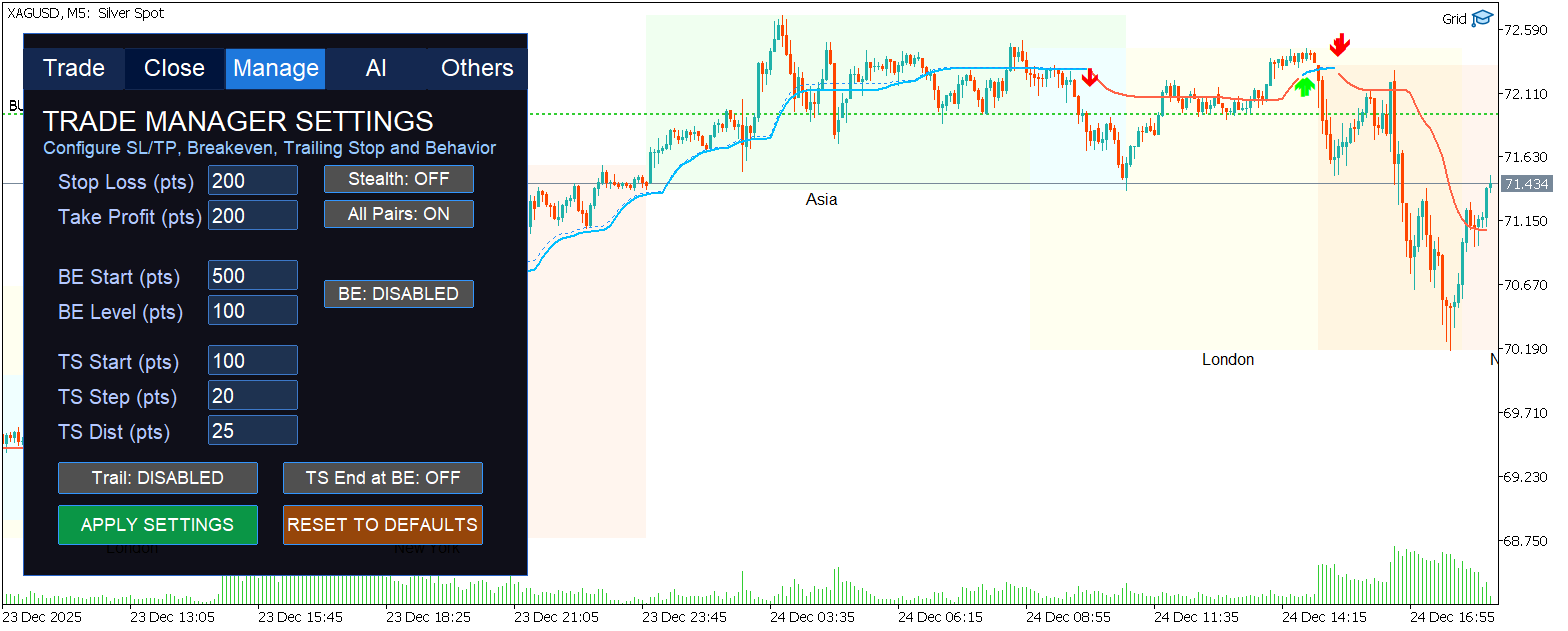
We develop trading strategies into custom indicators and algorithmic solutions for ForexTester6, CTrader, MetaTrader 4, and MetaTrader 5.
Our focus is building indicators, custom libraries, and trading utilities that reveal market patterns others miss.
Open to discussions with traders and developers interested in algorithmic trading solutions. Thank you.
Our focus is building indicators, custom libraries, and trading utilities that reveal market patterns others miss.
Open to discussions with traders and developers interested in algorithmic trading solutions. Thank you.