Teresinha Moraes Correia / Satıcı
Yayınlanmış ürünler

A MetaTrader 4 indicator is a tool used in the MT4 trading platform to help traders analyze price data. It uses mathematical formulas based on price, volume, or time to show patterns or trends on a chart. Indicators can help traders decide when to buy or sell by showing possible entry and exit points. There are many types, such as trend indicators, oscillators, and volume tools. Traders can also create custom indicators to suit their strategies and improve their trading decisions.

Using colors that reflect the prevailing market direction, the indicator is designed to show when the current trend is still dominant. This helps to filter out potential market noise and guides the trader to avoid false signals. By clearly visualizing trend strength and consistency, the tool assists in identifying higher-probability trade setups. It enhances precision by allowing traders to focus on movements that align with the broader market context. As a result, decision-making becomes more
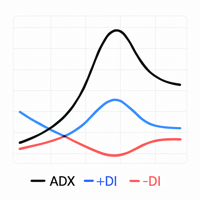
Custom ADX Indicator Based on Open Price Only The standard ADX indicator is usually calculated using the High, Low, and Close prices. This produces a smooth and visually appealing line that represents price action. However, ️ it lacks precision — as the candle moves, the ADX, +DI, and -DI values also change suddenly, potentially triggering false signals based on the candle’s initial plotting. A curious observation: even when the input is modified to use the Open price in the indicator se

Statistical Time-Based Indicator – Directional Candle This indicator analyzes all candles from the past month (30 days) on the current timeframe, identifying at which exact time (hour and minute) bullish or bearish candles occur most frequently. Based on this data, it emits real-time BUY (CALL) or SELL (PUT) signals whenever the behavioral repetition reaches the configured percentage. The statistical logic is based on exact hour and minute . For example, if at 14:15 over the last 30 day
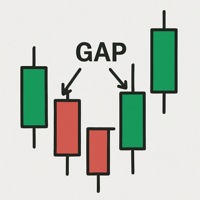
A gap is a space on the chart between two consecutive candlesticks where no trading occurred between the close of one candle and the open of the next. In the Forex market, gaps mainly appear at the weekly open, reflecting events or expectations from the weekend. Technically, a gap may indicate an imbalance between supply and demand. Strategies use gaps as signals of possible trend continuation or reversal, offering opportunities for technical analysis based on liquidity and momentum.
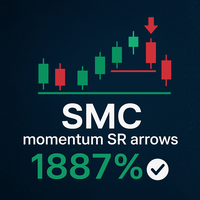
` SMS MOMENTUM SR ARROW | Precision in Momentum and Support/Resistance`
` Overview: A Convergence of Momentum and Key Levels`
The SMS MOMENTUM SR ARROW indicator is a specialized technical tool designed for traders who base their strategies on the critical interplay between momentum shifts and significant support/resistance (S/R) levels. This indicator operates on a clear, two-stage logic: first, it identifies a genuine momentum reversal using a refined oscillator-based calculation; se
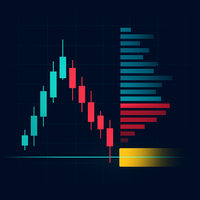
Technical Description of the Indicator – Delta Profile for MetaTrader 5 The Delta Profile is an indicator developed for MetaTrader 5 focused on detailed analysis of volume flow within a defined range of candles. It organizes and displays information about the imbalance of positive volumes (associated with upward movements) and negative volumes (associated with downward movements) at different price levels. The result is a clear view of the chart points where the highest concentration of trades o

SR POC VOLUME göstergesi, MetaTrader 5 için tasarlanmış olup, kullanıcı tarafından yapılandırılabilir bir geriye dönük süre boyunca mum verilerinden Kontrol Noktalarını (POC) tanımlamak, gruplamak ve görselleştirmek için kullanılır. Bu göstergenin amacı, birikmiş hacim ve delta dağılımına dayalı olarak destek ve direnç bölgelerini yapılandırılmış bir şekilde belirleyerek, traderların piyasada önemli ilgi alanlarını daha iyi anlamalarını sağlamaktır. Temel Fonksiyonlar POC Hesaplama Gösterge, bel

Gösterge, sinyaller vererek çok sayıda ardışık kazanç sağlar. Ayarlarda başlangıç ve bitiş zamanını belirleyebilir, sinyallerin ne zaman başlayıp duracağını seçebilirsiniz. Böylece otomasyon programlarında kullanılarak otomatik işlemler yapılabilir. ️ Birden fazla zaman diliminde kullanılabilir, 1 dakika, 5 dakika, 15 dakika tavsiye edilir. İşlem modu > Sinyalin gerçekleştiği aynı mumda işlem yapılır. ️ Sinyal mevcut mumun başında gerçekleşir, mum açıldığında hemen bir ok çıkararak hangi

Bu gösterge, olasılık hesaplamaları yaparak işlem sinyalleri üretir. Kullanıcı tarafından belirlenen başlangıç ve bitiş saatlerine göre günün bağlamını okur, veri analizi yapar ve sinyal üretir. Belirli anlarda mumun üstünde veya altında bir sembol göstererek sinyali doğrular. Bu, sinyalin gerçek zamanlı değişiklikler sayesinde daha da güçlü olabileceği anlamına gelir. Sağ üst köşede görünen metin sinyali, mevcut mumdaki sinyalin gücünü gösterir. Yüzde ne kadar yüksekse, mumun öneril