AxelQuant | Sistematik Trade ve Risk Yönetimi
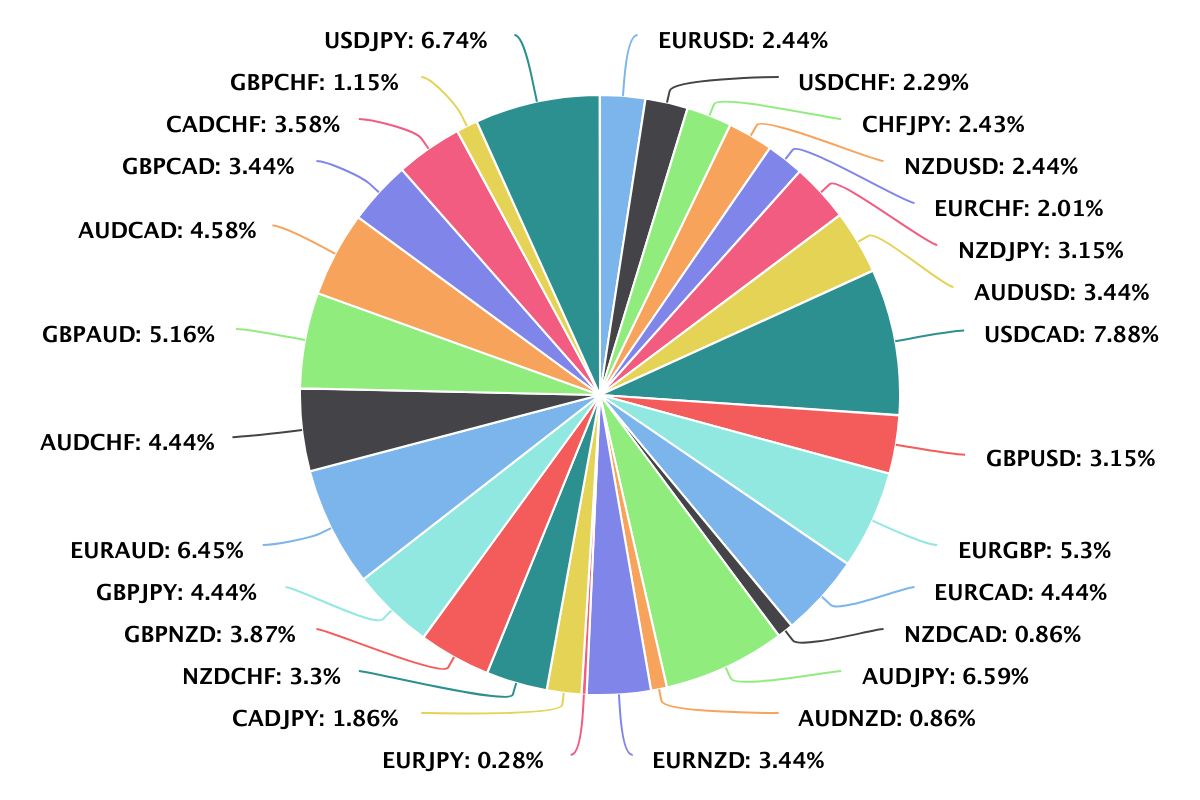
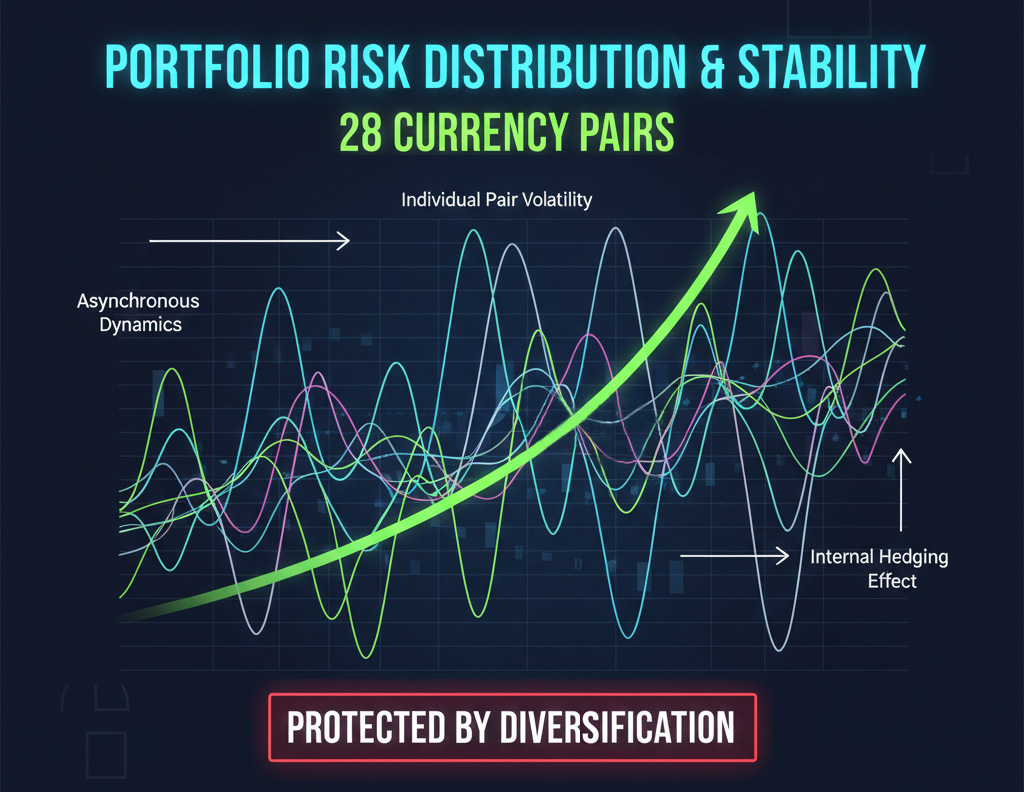
Hoş geldiniz. Yapısal istikrar ve uzun vadeli sermaye büyümesine odaklanan işlem stratejileri geliştirme konusunda uzmanım. Ana stratejim olan Bowstring's Song, 28 döviz çiftinden oluşan çeşitlendirilmiş bir portföyde işlem yapan hibrit, trende uyumlu bir modeldir.
Resmi Bağlantılar ve Doğrulama:
📊 Doğrulanmış Denetim: Myfxbook üzerinden gerçek zamanlı tam istatistikler
myfxbook.com/members/AxelQuant/bowstrings-song/11859074
🔵 RoboForex (CopyFX): Kâr payı bazlı ana sinyal
roboforex.com/copy-trading/rating/aaai/74170190
🟢 SignalStart: Diğer aracı kurumlar için alternatif bağlantı
axelquant.signalstart.com/analysis/bowstrings-song/285067
🛰 Telegram Kanalı: Strateji günlüğü, mantık analizleri ve güncellemeler
t.me/BowstringsSong
Strateji Detayları:
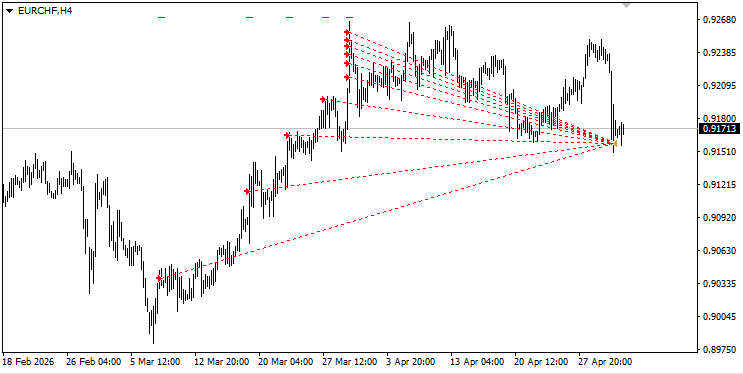
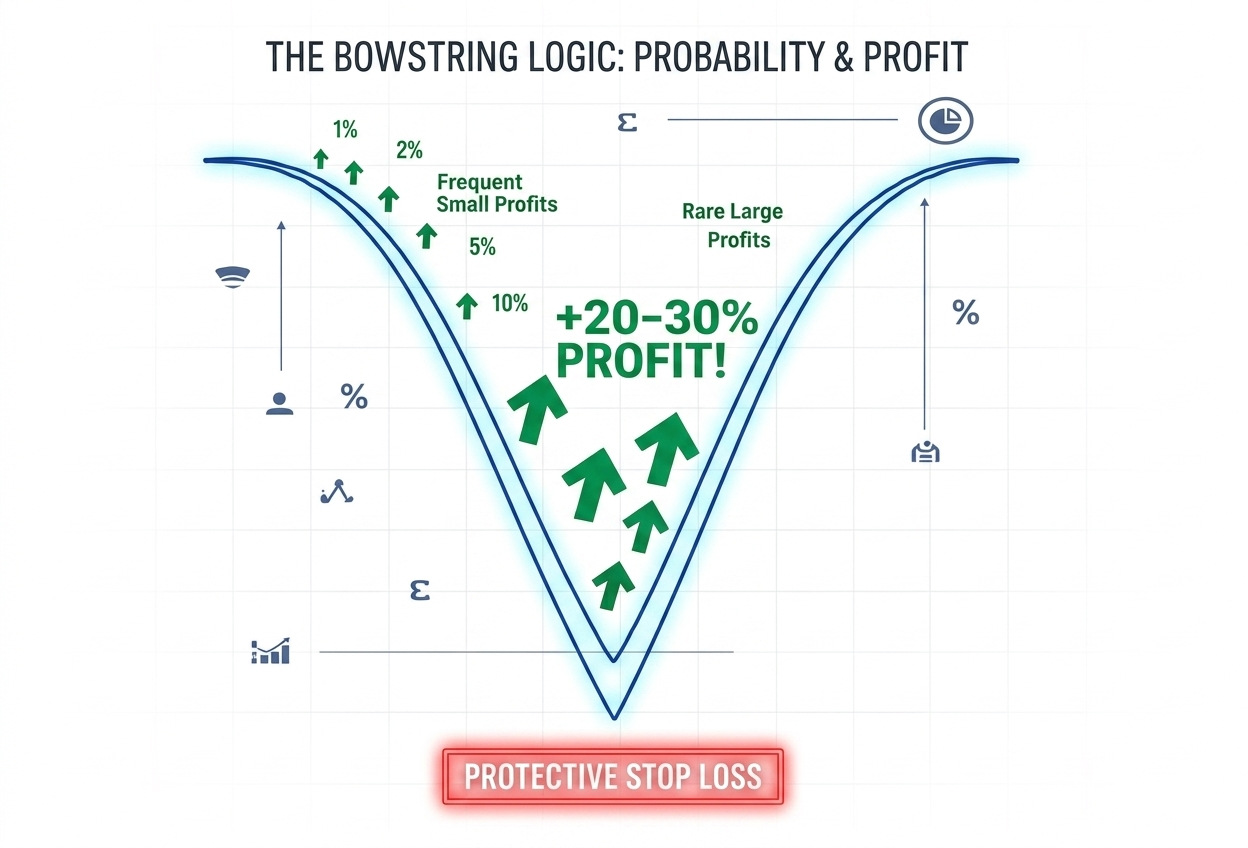
Mantık, hakim trend içindeki geri çekilmelerde (pullback) işleme girmeye ve çift çıkış mekanizmasına (trendin devamı veya ortalamaya dönüş) dayanmaktadır. Tam şeffaflık ilkesini benimsiyorum: Her pozisyon için zorunlu Hard Stop-Loss ve profesyonel denetim sağlıyorum.
📖 Mantık, grid (ızgara) mekanizması ve risk yönetimi hakkındaki detaylı analiz için lütfen profil akışımdaki ilk 5 gönderiyi okuyun.
Çalışmalarıma gösterdiğiniz ilgi için teşekkür ederim.
Hoş geldiniz. Yapısal istikrar ve uzun vadeli sermaye büyümesine odaklanan işlem stratejileri geliştirme konusunda uzmanım. Ana stratejim olan Bowstring's Song, 28 döviz çiftinden oluşan çeşitlendirilmiş bir portföyde işlem yapan hibrit, trende uyumlu bir modeldir.
Resmi Bağlantılar ve Doğrulama:
📊 Doğrulanmış Denetim: Myfxbook üzerinden gerçek zamanlı tam istatistikler
myfxbook.com/members/AxelQuant/bowstrings-song/11859074
🔵 RoboForex (CopyFX): Kâr payı bazlı ana sinyal
roboforex.com/copy-trading/rating/aaai/74170190
🟢 SignalStart: Diğer aracı kurumlar için alternatif bağlantı
axelquant.signalstart.com/analysis/bowstrings-song/285067
🛰 Telegram Kanalı: Strateji günlüğü, mantık analizleri ve güncellemeler
t.me/BowstringsSong
Strateji Detayları:
Mantık, hakim trend içindeki geri çekilmelerde (pullback) işleme girmeye ve çift çıkış mekanizmasına (trendin devamı veya ortalamaya dönüş) dayanmaktadır. Tam şeffaflık ilkesini benimsiyorum: Her pozisyon için zorunlu Hard Stop-Loss ve profesyonel denetim sağlıyorum.
📖 Mantık, grid (ızgara) mekanizması ve risk yönetimi hakkındaki detaylı analiz için lütfen profil akışımdaki ilk 5 gönderiyi okuyun.
Çalışmalarıma gösterdiğiniz ilgi için teşekkür ederim.