AxelQuant | 系统化交易与风险管理

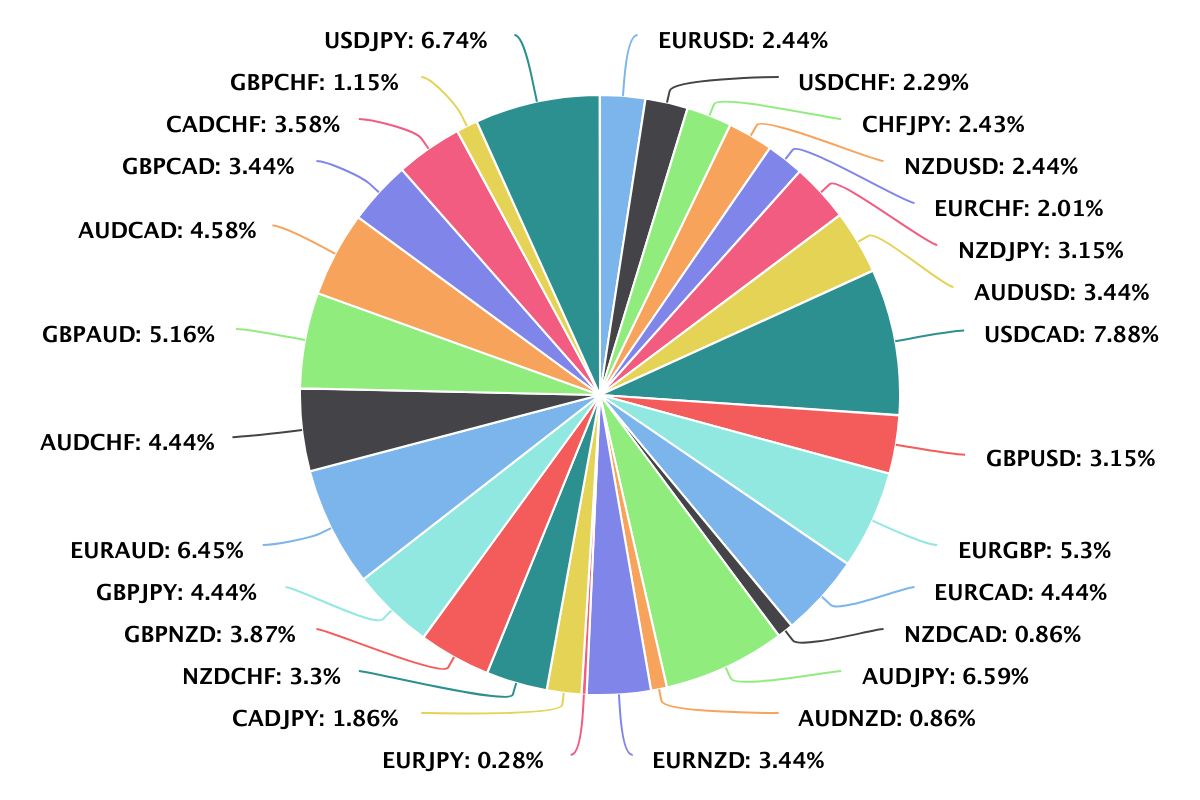
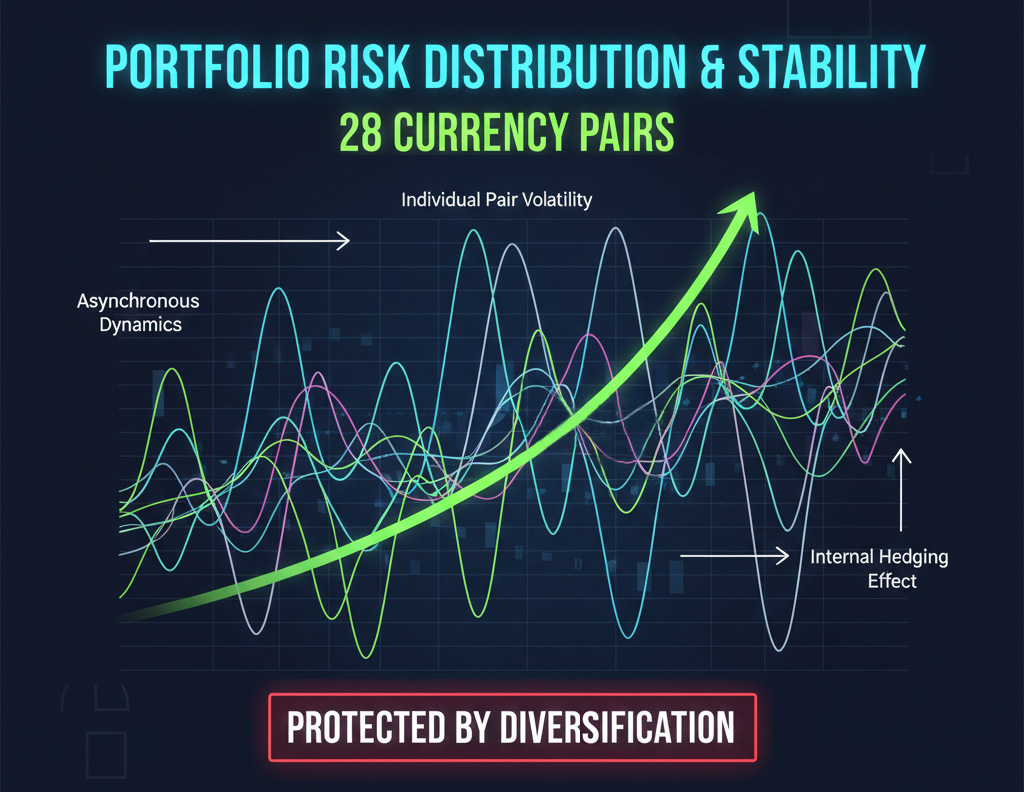
欢迎。我专注于开发旨在实现结构化稳定和资本长期增长的交易策略。我的旗舰策略 Bowstring's Song 是一种混合趋势适应模型,涵盖 28 种货币对的多元化投资组合。

官方链接与审计:

📊 实盘审计: 在 Myfxbook 上查看完整实时统计数据
myfxbook.com/members/AxelQuant/bowstrings-song/11859074

🔵 RoboForex (CopyFX): 基础信号,按盈利分红
roboforex.com/copy-trading/rating/aaai/74170190

🟢 SignalStart: 适用于其他经纪商的备选连接
axelquant.signalstart.com/analysis/bowstrings-song/285067

🛰 Telegram 频道: 策略日志、逻辑分析与动态更新
t.me/BowstringsSong

策略详情:
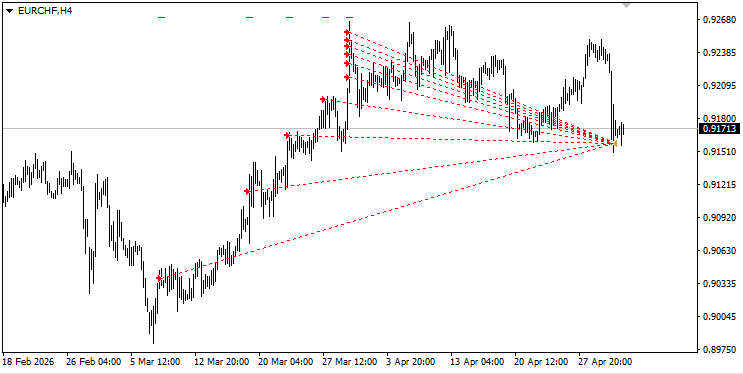
该逻辑基于顺势回调入场,并具备双重退出机制(趋势延续或均值回归)。我坚持透明化原则:每笔交易均设有强制止损 (Hard Stop-Loss),并结合专业的人工监控。

📖 有关逻辑、网格机制和风险管理的完整解析,请阅读下方个人主页动态的前 5 篇文章。

感谢您对我的工作感兴趣。
AxelQuant
AxelQuant
Architecture of Stability: Harmony of the 28 Elements

In the Tang era, order within the state was maintained not by chance, but by balance. If one province suffered from drought, another shared its harvest. The same applies to capital management: while the world around us chases random flashes, we calmly rotate the Wheel of Chakravartin.

What does this chart show? It is the distribution of all traded instruments for the Bowstring's Song strategy over the past 5 months. No single currency pair dominates, 28 instruments create a resilient and sustainable structure. When the dollar is stormy, cross-rates maintain equilibrium. When the yen stalls, the Swiss franc delivers profit.

We simply keep moving forward. Time is our greatest ally.
AxelQuant
AxelQuant
The World's First Paper Money and the Dawn of Inflation

In the 11th century, the Sichuan region (Chuanxia Lu) faced a severe copper shortage, forcing the government to mint coins from heavy, low-value iron. To purchase basic goods, merchants had to transport dozens of kilograms of iron money, which paralyzed local trade. To address this, sixteen wealthy merchants in Chengdu formed an association and began accepting iron for storage, issuing paper receipts known as "jiaozi" in return.

These lightweight paper sheets were made from mulberry tree bark, signed by trusted individuals, and verified with private seals. The population quickly embraced the convenience, and the receipts began to circulate freely as a legitimate medium of exchange. However, some private bankers eventually went bankrupt or issued notes without metallic backing, leading to widespread civil unrest.

To save the economy in 1024, the Northern Song Dynasty intervened by banning private issuance. The authorities established the state-run "Jiaozi Bureau" and began centrally producing the world's first official paper currency. Unfortunately, practically no original paper banknotes from this era have survived, as mulberry bark paper is not a very durable material. However, historians possess the copper printing plates that allow us to know exactly what they looked like.

Based on reconstructions from these plates, the banknotes featured a sophisticated visual structure. They primarily used black for the main illustrations and red for official seals, though dark blue was occasionally added. The top section typically depicted scenes from daily life - people, carts, and houses - which served as a security feature, as the complex details were difficult to replicate by hand. The center contained inscriptions regarding the denomination along with a stern warning that counterfeiters would face the death penalty. Finally, numerous official red seals were stamped around the edges, often overlapping one another.

Every three years, the government conducted a controlled release of new series while withdrawing old notes. This innovation revitalized trade and strengthened the empire. It's fascinating that "jiaozi" were essentially the stablecoins of their time. As long as there was collateral, the system thrived. But in later years, as soon as the government fired up the "printing press" to cover military expenditures, it all ended in the first large-scale hyperinflation in history. History truly repeats itself.
AxelQuant
AxelQuant
Just closed a complex grid sequence on EURCHF. This pair once again proved its structural tendency for mean reversion.

Key Stats:

• Total Gain: +15.6%

• Max Drawdown: -17.42%

• Duration: ~51 days for the initial seed

• Logic: The setup (which I call 'Golden Arrow') relied on the fact that the aggressive spike lacked structural memory.

The most intensive part of the grid was activated at the peak of the deviation. As predicted by my Hurst/Runs analysis, the mean-reversion energy was at its maximum when the price was near global stop-loss. The subsequent pivot allowed the entire cluster to close in profit.

This is a clear example of how mathematical edge beats emotional trading. I stayed for the reversion, and the model delivered.
AxelQuant
AxelQuant
The Bowstring Logic | Part 4/4

📖 RISK, REWARD, AND THE "GOLDEN ARROW" STANDARD

Trading is a balance. Low risks stifle growth, while excessive risks lead to ruin. My goal is to find the optimal point: a risk level that makes deposit loss highly unlikely while ensuring significant capital growth.


🛡 THE REALITY OF SAFETY

• TRANSPARENCY IS KEY: 100% safety does not exist in any market. In extreme global cataclysms, price gaps can jump over any stop-loss. However, such situations are rare "Black Swan" events that fall outside of normal market behavior. In nearly all other conditions, a disciplined stop-loss is a reliable shield that prevents disaster.

• EFFECTIVE RISK LEVEL: For a portfolio strategy, the most important factor is the recovery speed. If a deposit recovers slowly, a series of losses will deplete the capital. My system has high mathematical expectancy, allowing it to recover from a drawdown rapidly. Because the stop-loss is placed strategically, it is triggered very rarely — perhaps once or twice every few months across the entire portfolio. This rare frequency allows us to utilize a more effective risk level with minimal chances of total capital loss.


📊 RISK PARAMETERS

• TARGET RISK: The total risk for the entire grid typically ranges between 9% and 12%.

• VARIABLE FACTORS: The final risk percentage for each specific currency may vary within this range due to accumulated swaps (positive or negative) over the life of the trades.

• PROFIT TARGET: With these risk settings, I target an average return of 5% to 10% per month. Since market movement is non-linear and some trades remain open for longer than a month, profits are distributed unevenly. This means some periods may be quieter, while others exceed the target.


🏹 THE "GOLDEN ARROW" CELEBRATION

The lot weights in my grid are shifted toward the later orders, creating a specific growth dynamic:

• FREQUENT WINS: Small, steady gains from shallow moves smoothly grow the deposit.
• GROWTH SPRINTS: Mid-range moves accelerate our progress.
• THE GOLDEN ARROW: 2–3 times a year, the deepest levels of the grid are activated.

DEFINITION: A "Golden Arrow" is officially declared when the entire grid closes with a net profit of +10% or more of the total deposit in a single event.

To mark every Golden Arrow, I will host a giveaway in my Telegram channel, raffling off Telegram Stars and Premium subscriptions among our community members!
AxelQuant
AxelQuant
The Bowstring Logic | Part 3/4

This part focuses on practical implementation: structural entry analysis, grid mechanics, and the principles of position closure.


📉 MARKET STRUCTURE & ENTRY LOGIC
Decisions are based on a comparative analysis of current and historical trends.

• PHASE IDENTIFICATION: I determine the trend direction and its current phase, identifying whether the movement is at a peak or in a corrective stage, and whether it is accelerating or decelerating.

• TREND EXHAUSTION: A position is opened only when two conditions are met: the market must be in a retracement phase, and the primary trend must retain the structural potential to continue.

• PURE TECHNICAL ANALYTICS: All calculations are based on the relative position of price extremes: the lengths and intervals of trend waves and their pullbacks. No averaging indicators are used, keeping the logic tied to objective price action.


⚙️ EXECUTION MECHANICS
This structure transforms market theory into a precise execution model governed by statistical probability.

• INITIAL ENTRY: I open the first trade with a market order during a pullback, following the primary trend.

• STRUCTURAL ANCHOR: A single Stop-Loss for the entire grid is placed at a point determined by the statistical distribution of historical trend lengths.

• POWER LAW DISTRIBUTION: Subsequent limit orders are placed according to a Power Law function. As orders approach the Stop-Loss, density and lot size are increased to capitalize on the rising statistical probability of the correction's exhaustion.


📊 GRID DYNAMICS: PROBABILITY & SPEED
Unlike "toxic" grids without stop-losses, this system uses a grid solely to cover the statistical interval of a trend correction.

• PROBABILITY OVER PRECISION: Predicting a single, exact coordinate for the end of a pullback has a low probability of success. A grid of 5–10 orders effectively solves this, increasing entry frequency and improving the average price as the correction develops.

• STATISTICAL VELOCITY: By utilizing a wider range of entry points, the grid approach significantly increases the data sample size. This allows the strategy to achieve statistical significance and stable growth much faster than systems relying on infrequent, single entries.

• ACCELERATOR, NOT FOUNDATION: The grid is a tool for enhancing profitability, not the basis of the system. The foundation lies in identifying recurring price patterns. The grid simply increases the speed of capital growth.


🏹 THE BOWSTRING LOGIC: While small pullbacks result in steady trades, a deep correction that returns to the primary trend creates the "bowstring shot" effect. This powerful event occurs when a fully loaded grid closes its total volume, generating a rapid surge in capital growth.

These peak performance moments are officially celebrated as a Golden Arrow event.
AxelQuant
AxelQuant
The Bowstring Logic | Part 2/4

In this part, we transition from theory to the defensive architecture of the system. The focus here is on how the simultaneous trading of 28 assets creates a self-balancing portfolio and why an optimal stop-loss is the ultimate foundation for long-term capital preservation.


📊 PORTFOLIO DYNAMICS AND RISK DISTRIBUTION
The strategy operates simultaneously across all 28 major currency pairs. This extensive coverage ensures statistical stability through three key mechanisms:

• ASYNCHRONOUS CORRELATION: Assets move in different phases. While one pair corrects, others reach profit targets, allowing the portfolio to self-balance.

• INTERNAL HEDGING: Trading the full basket creates natural hedges. A drawdown in one position is often offset by profits from opposing positions of the same currency in other pairs.

• NON-LINEAR RISK: Risk does not aggregate linearly. Because these 28 instruments move with varying degrees of independence, the probability of a simultaneous maximum drawdown across all positions is statistically negligible.


⏳ TRADING TIME HORIZON
By filtering out intraday noise, I focus on long-term trends where structural patterns are more reliable.

• DURATION: Trade duration typically ranges from one week to 2–3 months, depending on the market phase.

• PATIENCE: During consolidation (flat market), patience is maintained until exit conditions are met.

• AVERAGE HOLD: These holding periods are standard for the system, with an average trade duration of approximately two weeks.


🛡️ CAPITAL PROTECTION: STRUCTURAL FOUNDATIONS
The "Stop-Loss Always" rule is the structural foundation of the entire architecture.

• THE EQUILIBRIUM OF PROTECTION: Given the "noisy" nature of Forex, my stops are placed at a strategic distance to balance the need to avoid premature, noise-driven exits with the absolute necessity of protecting the portfolio against deep, non-reverting trends.

• THE STRUCTURAL ANCHOR: A hard stop-loss is set for the entire grid. While it remains untouched in normal conditions, it serves as a "safety release" during extreme market moves. I accept a predetermined loss on a specific grid to ensure the survival of the entire portfolio.

• MANUAL EXIT: Most often, a trade is closed manually at a much better price if I no longer see viable prospects for its development. The hard stop remains the ultimate safeguard for capital preservation.
AxelQuant
AxelQuant
The Bowstring Logic | Part 1/4

🌊 THE NATURE OF PRICE DYNAMICS
There are several fundamental characteristics of the currency market that form the basis of my approach:

• CYCLICAL RECIPROCITY: Price dynamics are essentially a complex, wave-like process. While the market occasionally experiences single-directional breakouts that move far and fast without a significant corrective phase, such events are relatively rare. Most of the time, market structure consists of alternating phases where every move eventually exhausts itself and gives way to a counter-movement.

• FRACTAL STRUCTURE & NOISE: This process of alternating waves is fractal: larger waves are composed of smaller cycles, forming what we call a trend. While intraday movements are largely stochastic (random) and driven by noise, trends lasting a month or longer reflect the economic planning of central banks. In these longer-term trends, reliable structural patterns emerge.

• RELATIVE ECONOMIC EQUILIBRIUM: Unlike stocks, which can trend unidirectionally for years, often gaining or losing several hundred percent of their value, currencies represent the relative strength of national economies. This typically results in fluctuations within more constrained corridors over extended periods.

• LIQUIDITY MAGNETISM: A distinctive trait of Forex is the high probability of price breaching local extremums. Price action gravitates toward these levels to sweep liquidity. A return to a recent high or low often results in at least a marginal breakout, making these zones predictable targets.


🏛️ STRATEGIC CONCLUSIONS
From these fundamental properties, I derive the pillars that sustain my strategy:

1. THE STOCHASTIC REALITY: Despite identifiable patterns, the market remains largely stochastic, making it impossible to produce 100% accurate forecasts. Long-term profitability is built not on "certainty," but on a probabilistic model where cumulative gains systematically outweigh losses.

2. MEAN-REVERTING NOISE: Due to the inherently noisy character of price movement, the market tends to fluctuate around its local average. This creates a high statistical probability that price will repeatedly revisit the current zone in the near future. Such behavior provides an opportunity to mitigate or avoid significant losses, even in cases where the initial entry point was mistimed.

3. ALIGNING WITH THE DOMINANT TREND: A trend is a directional drift that creates a probability bias. Trading in the direction of this momentum is advantageous because price returns become asymmetrical, favoring the primary trend. Optimal entries emerge during corrections, allowing us to join the move before the movement resumes.

4. STATISTICAL REVERSAL ZONES: The termination of a retracement is not a fixed coordinate, but a probabilistic price range derived from the historical distribution of trend corrections. Strategy success relies on covering this entire statistical interval rather than attempting to pinpoint a singular pivot level.
AxelQuant
AxelQuant
🏹 Welcome to AxelQuant.

I am a practitioner trader and researcher. This feed is dedicated to my strategy Bowstring’s Song and my observations on market patterns.

My approach is built on long-term growth through systematic discipline. The system is based on probability theory, mean reversion, and rigorous risk control, focusing on identifying structural market inefficiencies within the noise.

The following four posts break down the full architecture of the strategy:

• Part 1: The nature of price dynamics.

• Part 2: Portfolio resilience and defense.

• Part 3: Execution mechanics and the Power Law grid.

• Part 4: Risk parameters and the "Golden Arrow" standard.

Detailed links to the Telegram diary and Live Monitoring are available in the profile header above.

Axel
AxelQuant
已在MQL5.community注册