HeikinAshi Delta
- Göstergeler
- Aren Davidian
- Sürüm: 1.60
- Güncellendi: 22 Mayıs 2023
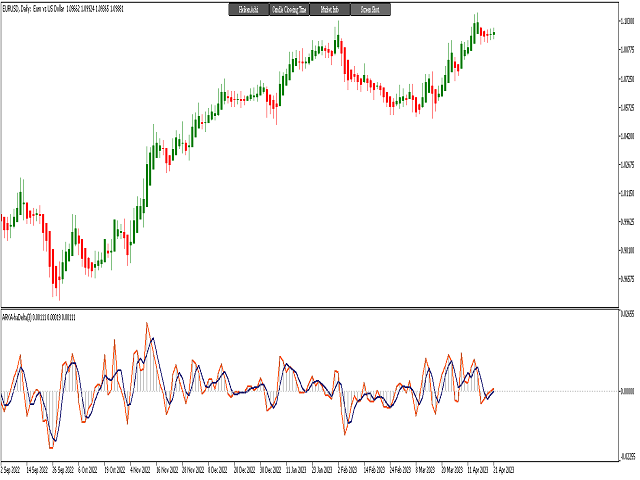
This Indicator is based on Mr. Dan Valcu ideas.
Bodies of candles(open-close) are the main component used to indicate and assess trend direction, strength, and reversals.
The indicator measures difference between Heikin Ashi close and open.
Measuring the height of candle bodies leads to extreme values that point to trend slowdowns. Thus quantifies Heikin Ashi to get earlier signals.
I used this indicator on Heiken Ashi charts but, it's possible to choose to calculate Body size based on Heiken Ashi or Candles.
haDelta can be smoothed with a simple moving average.
We see that crossings between the haDelta and SMA confirm trend changes with an anticipated delay introduced by each average. Crossings between the indicator and its average are better confirmations of trend changes.
When Delta crosses above SMA it is an uptrend.
When Delta crosses below SMA it is a downtrend.
Default haDelta smoothed value is by applying 3 periods SMA.
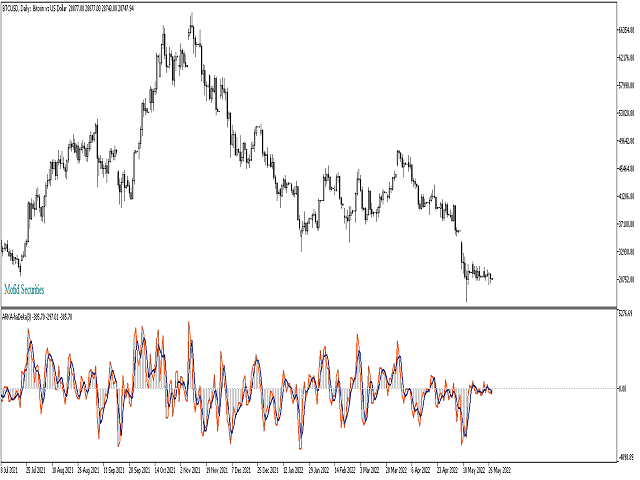
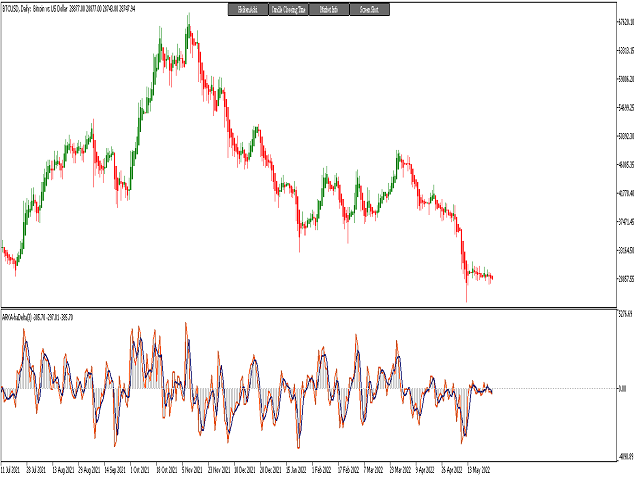