Level Trend Trader mt4
- Göstergeler
- Natasha Diedericks
- Sürüm: 1.3
- Güncellendi: 18 Mayıs 2023
- Etkinleştirmeler: 15
This indicator uses a special algorithm to plot the 4 lines for trading.
Great for scalping.
Does not feature any alerts and is best used manually after confirming the line displays.
No need to set up the indicator.
How to use:
Attach to any chart.
Can be used on any time frame. If used on lower time frames, check higher time frames for confirmation.
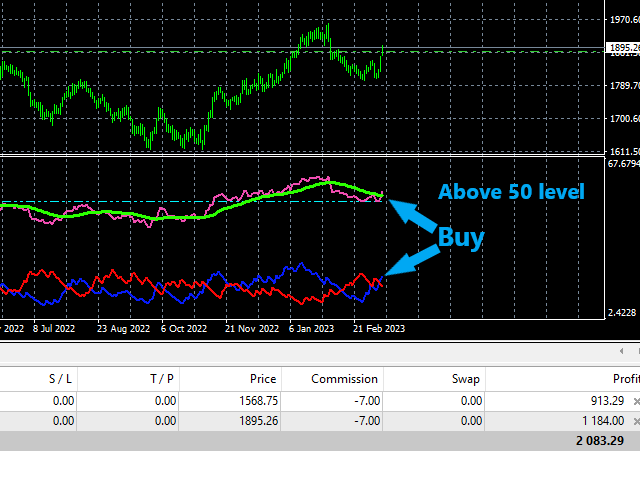
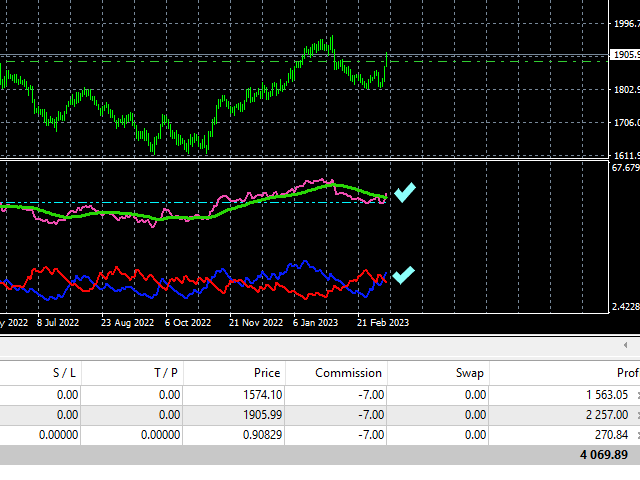
Buy:
- Wait for green and white lines to be above the level 50 dotted line, then open buys.
- Buy when the green line crosses below the white line, and the blue line is above the red line.
Best results when the the above conditions are met on multiple timeframes, e.g., H1-H4-D
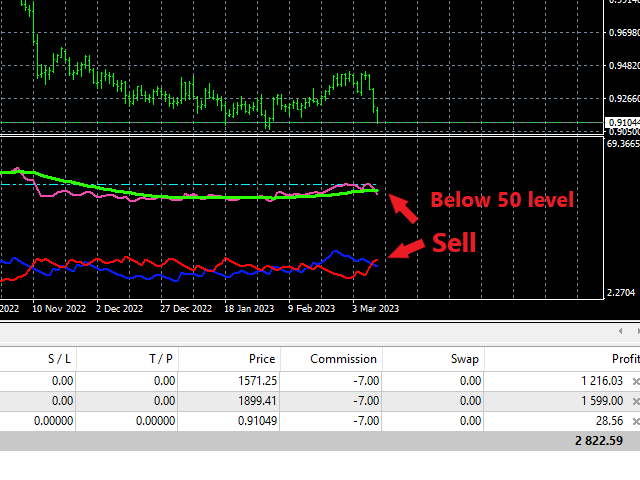
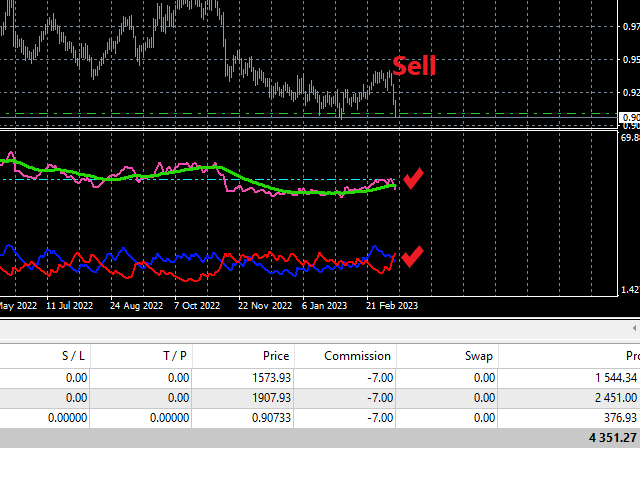
Sell:
- Wait for green and white lines to be below the level 50 dotted line, then open sells.
- Sell when the green line crosses above the white line, and the red line is above the blue line.
Best results when the the above conditions are met on multiple timeframes, e.g., H1-H4-D
Or change the settings, backtest and use as you see fit for your strategy.
See picture below.
Best results on Major Pairs, but can also be used on other pairs (Metals, Minors).
Important to note:
-
Please do not use this indicator haphazardly. Make sure it compliments your strategy.
-
Don't risk money you cannot afford to lose.
-
You use this indicator at your own risk. Please apply money management wisely.
-
Always test your strategy on a demo account before using a new indicator on a live account.