Qunity ADX Multi Timeframe Trend and Fibonacci
- Göstergeler
- Rodion Kachkin
- Sürüm: 1.3
Multi-timeframe trend indicator based on the ADX / ADXWilder indicator with Fibonacci levels
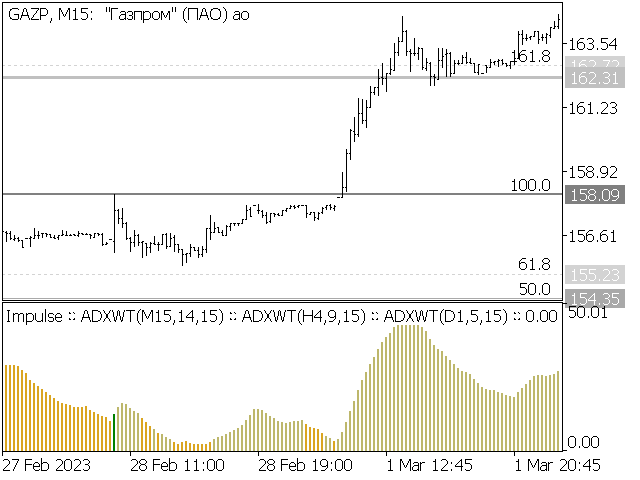
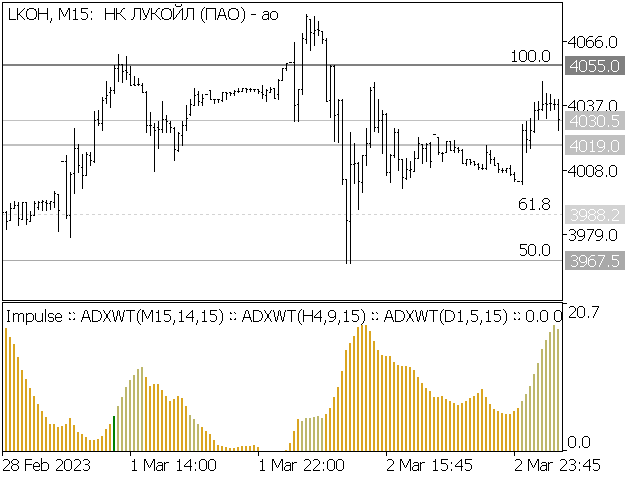
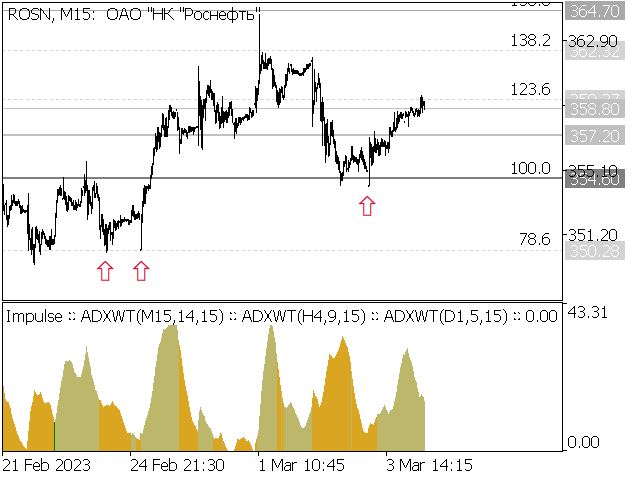
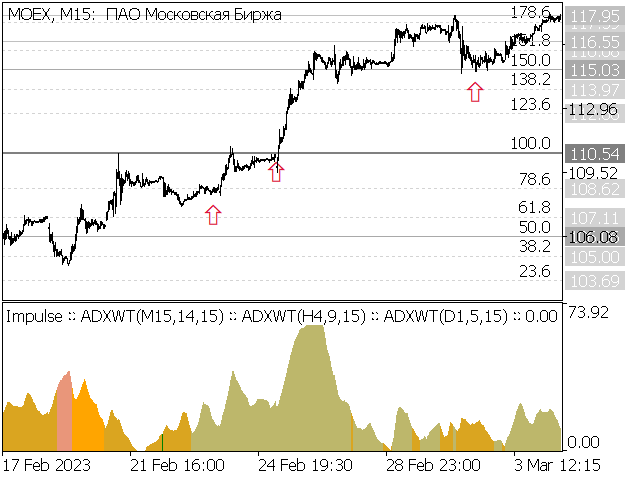
The indicator shows trend areas using ADX or ADXWilder indicator data from multiple timeframes. The impulse mode of the indicator allows you to catch the beginning of a trend, and several "Screens" with different timeframes allow you to filter out market noise. Fibonacci levels are added to the price chart, which have flexible settings.
How the indicator works:
- if PDI is greater than NDI, then it`s bullish movement;
- if PDI is less than NDI, then it`s bearish movement;
- to determine any trend, it is necessary to fulfill the above points on all included "Screens";
- if ADX is less than or equal to the filter value specified in the parameters, then there is no movement state;
- if the "Impulse" mode is enabled, then the trend data is calculated from the beginning of the trend formation on any of the "Screens" until the trend is reversed on all "Screens" ;
- Fibonacci levels, if enabled, are drawn based on the high (in an uptrend) and low (in a downtrend) and high/low price of the previous trend.
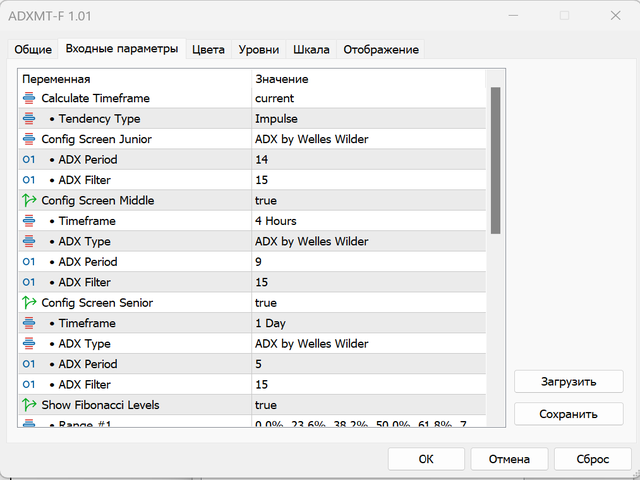
Input parameters of the indicator:
- Calculate Timeframe - current timeframe, i.e. "Junior" screen for calculation;
- Tendency Type - indicator calculation type;
- Config Screen Junior - ADX calculation type on the "Junior" screen, on the basis of which the calculation is performed;
- ADX Period - period of the "Junior" screen calculation used;
- ADX Filter - ADX value filter on "Junior" screen;
- Config Screen Middle - enable/disable "Middle" screen for calculation;
- ADX Type - ADX calculation type on the "Middle" screen, on the basis of which the calculation is performed;
- ADX Period - "Middle" screen calculation period;
- ADX Filter - ADX value filter on the "Middle" screen;
- Config Screen Senior - enable/disable "Senior" screen for calculation;
- ADX Type - ADX calculation type on the "Senior" screen, on the basis of which the calculation is performed;
- ADX Period - the period of the "Senior" screen calculation used;
- ADX Filter - ADX value filter on the "Senior" screen;
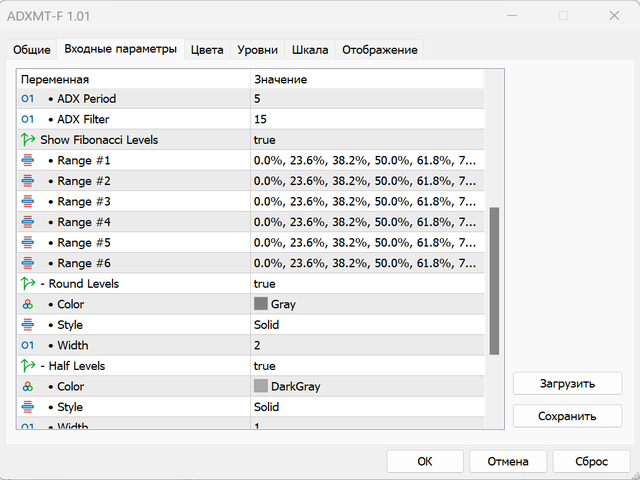
- Show Fibonacci Levels - enable/disable display of Fibonacci levels on the chart;
- Range #1 - list of levels that will be displayed for the range from 0.0% to 99.9%;
- Range #2 - list of levels that will be displayed for the range from 100.0% to 199.9%;
- Range #3 - list of levels that will be displayed for the range from 200.0% to 299.9%;
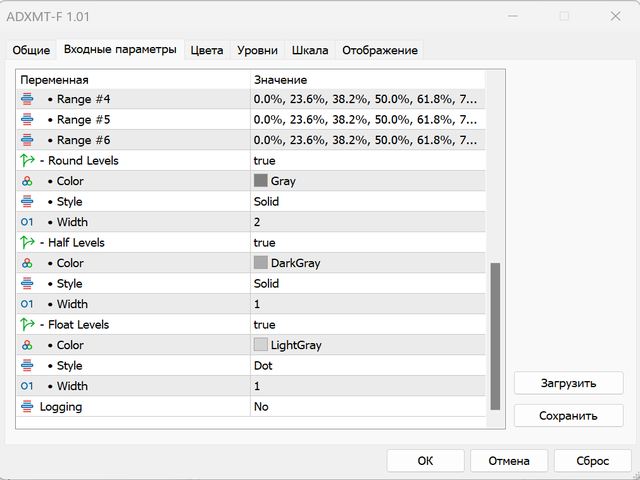
- Range #4 - list of levels that will be displayed for the range from 300.0% to 399.9%;
- Range #5 - list of levels that will be displayed for the range from 400.0% to 499.9%;
- Range #6 - list of levels that will be displayed for the range from 500.0% to 599.9%;
- Round Levels - enable/disable descriptions for "round" levels;
- Color - level color;
- Style - level style;
- Width - level line width;
- Half Levels - enable/disable descriptions for "fractional-half" levels;
- Color - level color;
- Style - level style;
- Width - level line width;
- Float Levels - enable/disable descriptions for "fractional" levels;
- Color - level color;
- Style - level style;
- Width - level line width;
- Logging - type of logging in the log.
Calculate Timeframe parameter do possible for you can display the values of higher timeframes on the younger chart for the "Junior" screen. It should be noted that the last closed bar of the higher timeframe is used to calculate the higher timeframes.
Values in the "Market Watch" window:
- Direction - trend direction;
- Strength - trend strength;
- Open - trend start price;
- High - maximum price during the trend;
- Low - minimum price during the trend;
- Close - trend completion price.
The direction of the trend can be from -1 to +1, where +1 is a bullish trend, 0 is no trend, -1 is a bearish trend. The trend strength is calculated by the formula: ADX value - (ADX Filter * 0.75). Changing the trend to the value "0" does not stop the calculation of the prices of the previous trend, "Open" and "Close" values may not coincide with the opening of the bar on the chart, because the trend may change during the formation of the bar. In impulse mode, the beginning of a trend is considered to be a trend reversal on all Screens.