Exponential Range Average Deviation Offset MT5
- Göstergeler
- Fernando Carreiro
- Sürüm: 1.0
(Google Çeviri)
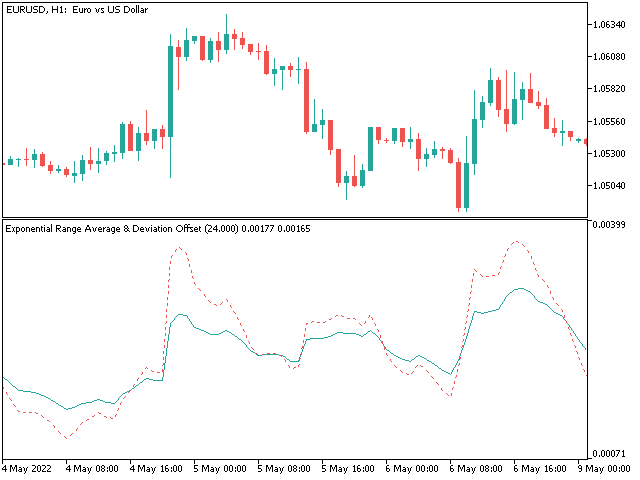
Bu gösterge, John Welles Wilder'ın ortalama gerçek aralığından (ATR) esinlenmiştir, ancak bazı ek bilgiler içermektedir. Benzer şekilde, gerçek aralığın üstel hareketli ortalamasını hesaplar, ancak Wilder yerine standart alfa ağırlığını kullanır. Ayrıca, aralık ortalamasının ortalama sapmasını da hesaplar ve bunu bir sapma olarak görüntüler. Bu, yalnızca bir değişikliği daha hızlı belirlemeye değil, aynı zamanda etkisini de belirlemeye yardımcı olur.
(Original text)
This indicator was inspired by John Welles Wilder's average true range (ATR), but with some extra information. Similarly, it calculates the exponential moving average of the true range, but using the standard alpha weight instead of Wilder's. It also calculates the average deviation of the range average, and displays it as an offset. This helps not only identify a change more quickly, but also its impact.