• Genel bakış
  • İncelemeler
  • Yorumlar (1)
  • Yenilikler

MR Trend Corrections 5

We publish the indicator as a useful tool in trading and call this indicator the "Swiss Army Knife" because it provides many possibilities and combinations to help understand the material on the "Masters of Risk" trading system. The indicator itself is not part of the tools used in the "Masters of Risk" trading system.


The indicator consists of 3 separate multi-timeframe indicators, which in combination with each other help to reduce the "noise" of false signals.

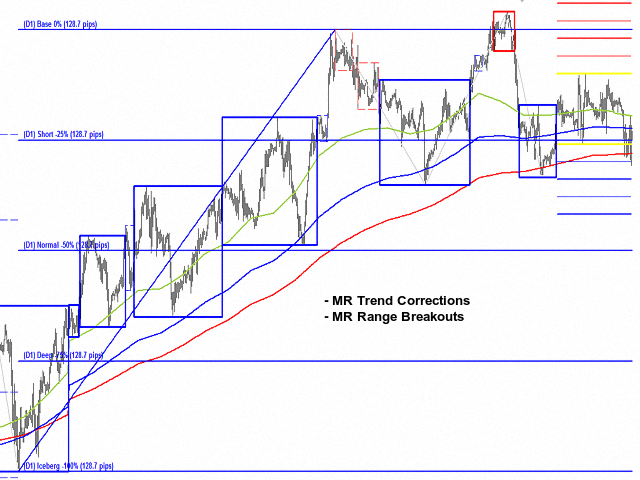
  • The first of the indicators are three "Moving averages". In trend they work well, but unfortunately the same cannot be said when we are in Range.
  • The second of the indicators is a modified "Zig-Zag". We use 3 bars on the left, 3 bars on the right and one bar in the middle to define the fractal. The indicator itself gives a lagging signal, but is very good at identifying "Impulse" price movements.
  • The third of the indicators is a modified "Fibonacci Levels". The idea is simple - we divide the "Impulse" price movement into equal parts of 25% each. This is what works in markets.

The combination of the three indicators helps you not to be "Lost in the Trend"!!!

Now we will explain the "Corrections" made by the price movement. Since we have not found anything meaningful as an explanation in the books we have and on the internet, we will use our own terminology for this.

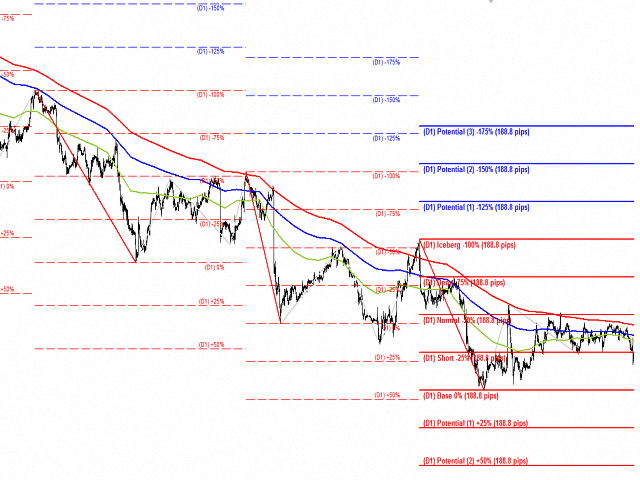
  • "Potential (1) +25%" and "Potential (2) +50%" corrections determine how far the movement along the trend is possible to continue. According to our observations, these are the levels most often reached by the price movement. Reaching these levels is a slow and difficult process. It is very possible that this has to do with the "limit barriers" that the "Big" players put up or the fixing of their positions. If we have weak and short "Impulses", we wait... A trend reversal is possible at these correction levels!!!
  • As "Base 0%" we use 0%, where the corrections start. The "Base 0%" is always at the end of the impulse price movement!!!
  • The "Short -25%" correction is the first level that the price corrects. This is a very interesting level of correction. From our experience, we have two findings about this: 1. This correction is tested in a "strong trend" and the next impulse of the price movement starts from it. The important thing is that there is no long-term holding of the price in the form of "Range". If there is no "Range", we call the level "Strong"!!! 2. If there is a "Range" we have the following finding.The battle between the "Big" players in the market has been going on for a long time and this has been seen by other market players. In such a case, the continuation is by testing the next correction of -50%. In that case, we call the -25% correction "Weak"!!!
  • In the "Normal -50%" level, there is nothing interesting. This is a "system" fix. Usually at this level there is some volume to be absorbed by the "Big" players in the market!!!
  • The most interesting is the next level of correction, which we have called "Deep -75%". This is a very interesting place. The essence of "Deep -75%" correction is as follows: A "big" player in the market holds an open position in the opposite direction of the price impulse (within the -100% correction). He has made interventions to reach his open position and to get out of it. However, other "Big" players saw this price movement and took action (more liquidity) to prevent it. In this case, we say that a "Big" player has remained in "Locked-in Range". The important thing to know is that in this level there is a battle between "Big" players and this level is very "Strong"!!!
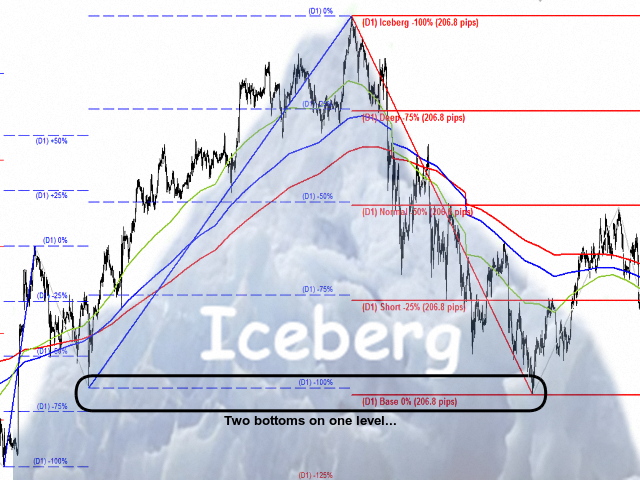
  • The term "Iceberg -100%" is our suggestion, because that is how we liken this model in the markets. It can easily be called "Mountain" and "Abyss". The essence of this correction is that there a "Big" player managed to get out of his position. There are two continuation options after the price has tested the "Iceberg -100%" correction. The first option is for the "Big" player to be very strong and win the battle with the other participants. Then we have a correction of between -25% and -50% of the "Iceberg" momentum and then a continuation of the price movement in the direction of the position of the strong "Big" player. The second option is that the "Big" player has freed himself from his position and has entered the market in a position opposite to his own. By adding his position to the other "Big" players, he gives a new impulse to the price movement and follows a big impulse and a new "Iceberg" model, opposite to the first one. A mandatory condition for a test of the "Iceberg -100%" level is that the price stops at this level and makes a correction. The "Iceberg -100%" model consists of two impulses - the second impulse is the size of the first impulse!!!
  • The "Potential (1) -125%", "Potential (2) -150%" and "Potential (3) -175%" corrections determine how far the correction movement can continue. According to our observations, these are frequently reached levels of the corrective price movement. Reaching these levels is a fast and powerful process. This is related to the increased liquidity at the expense of the stop losses of other players, regrouping of the positions of the "Big" players or long-term operations of Central Banks.


The indicator has two main concepts of use.

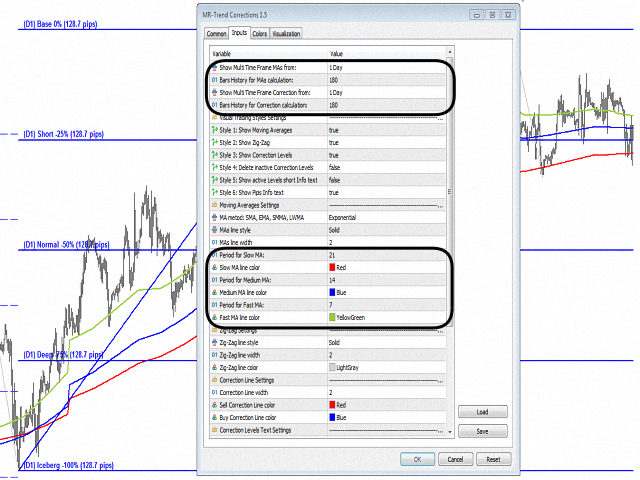
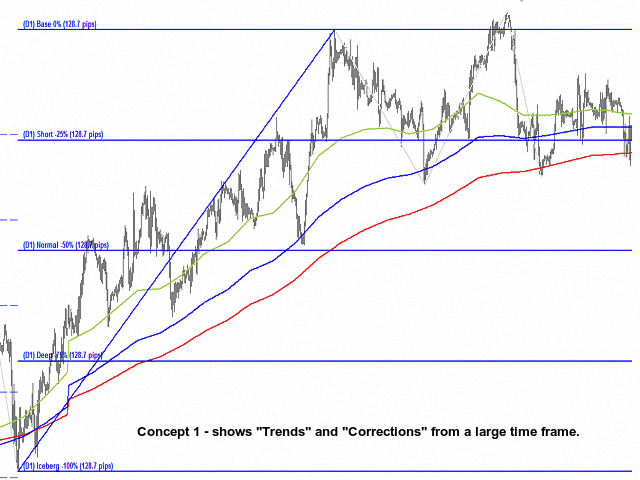
  • Concept 1 - shows "Trends" and "Corrections" from a large time frame. By default, the indicator is set to work on this concept - three "Moving averages" from time frame D1 with periods of 21, 14 and 7 days, "Zig-zag" and "Correction levels" also from time frame D1.
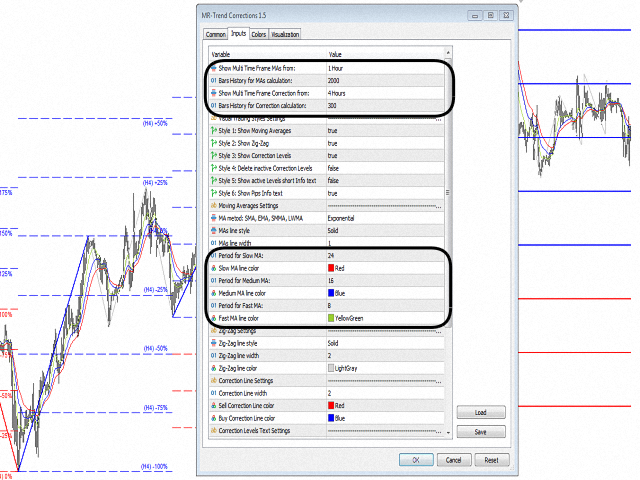
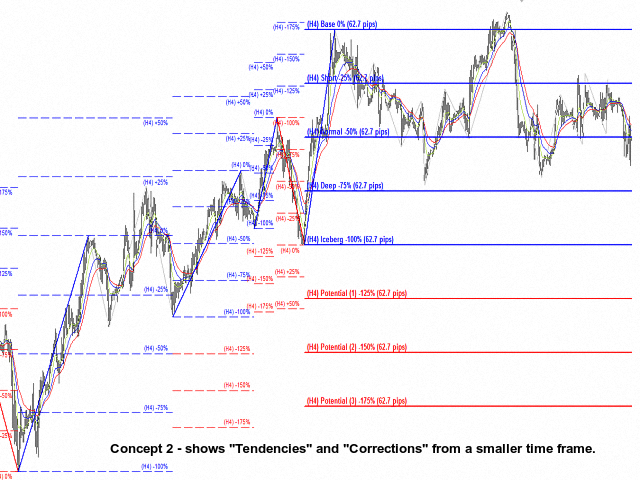
  • Concept 2 - shows "Tendencies" and "Corrections" from a smaller time frame. For example, If we use the "D1" time frame for the "Trend", then for the tendencies we will have to set the "Moving averages" on the current time frame, and the "Zig-zag" and the "Correction levels" one time frame higher - three "Moving averages" from time frame H1 with periods of 24, 16 and 8 hours, "Zig-zag" and "Correction levels" from time frame H4.
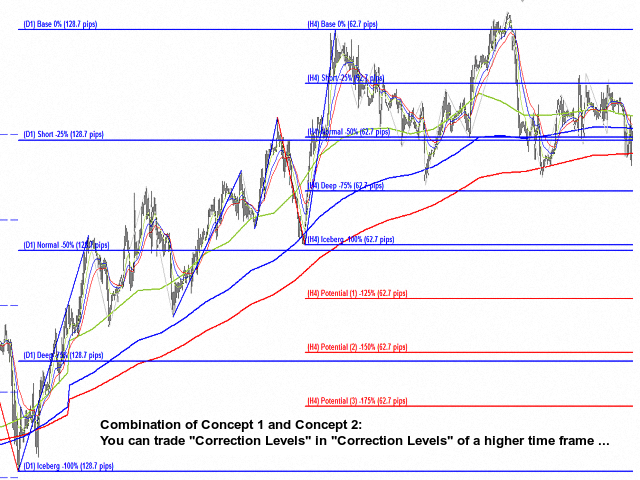
  • The combination of the two concepts provides an opportunity to trade the "Impulses" of tendencies (three H1 "Moving averages" that move in the same direction without crossing over a relatively long period of time) in relation to trend (three D1  "Мoving averages" that move in the same direction without crossing over a relatively long period of time). This way, you can trade "Correction Levels" into "Correction Levels" from a higher time frame.


Since the "MR Trend Corrections" indicator is an auxiliary tool, we recommend using it in combination with our other indicators to confirm trend movement or its reversal.

The features of our indicator are as follows:

  • The indicator shows the "Impulse" movement of the price and their "Corrections". Which "Impulse" movements are important and which are not are determined according to the author's methodology.
  • It shows the distance between the "Correction Levels" in pips, which makes it easier to make decisions about whether to trade the distances between them.
  • The indicator can use each of the nested indicators on its own, allowing you to combine them to meet the many requirements of traders.
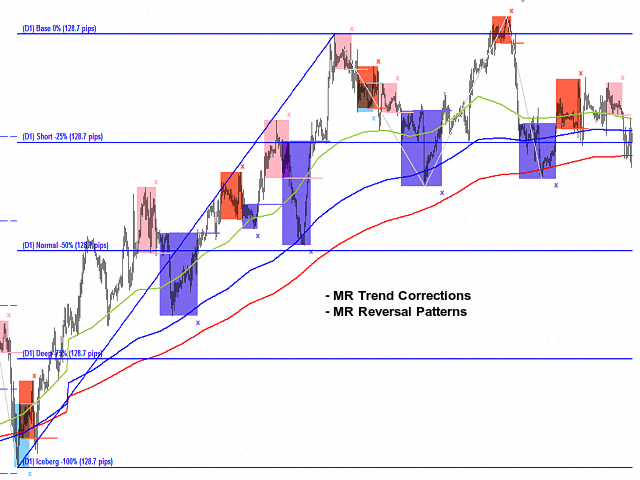
  • In combination with the "MR Reversal Patterns" indicator and its trading models, you can track how the price moves in the "Impulse" and where the price ends its corrections.
  • In combination with the "MR Range Breakouts" indicator, you can track the places where the volumes accumulate in the "Balances" and "Ranges" along the trend. Then the volumes of these places are absorbed in the "Correction" movements.
  • In combination with the "MR Volume POC Levels" indicator, you can track the places where volumes are absorbed and accumulated. You will notice that in the "Impulse" movements, the volumes participate in the entrainment of the price movement in the direction of the "Impulse", and in the "Corrections" new places arise with volumes that keep the price movement in the range.
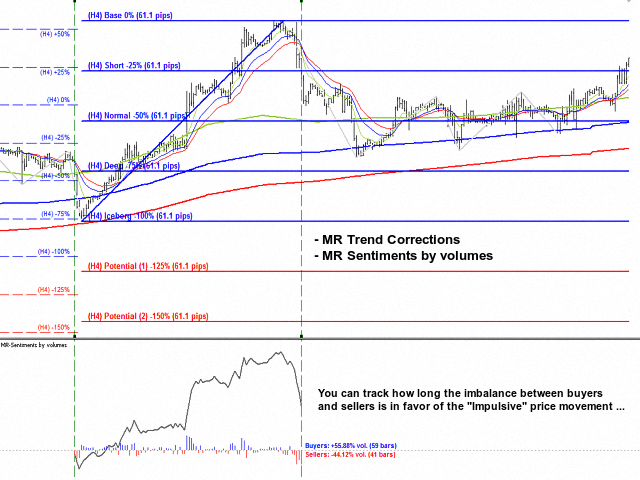
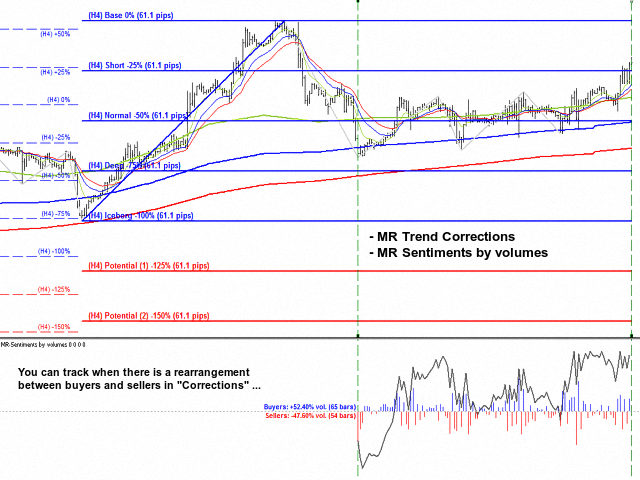
  • Combined with the "MR Sentiments by volumes" indicator, you can track how long the imbalance between buyers and sellers is in favor of the "Impulsive" price movement and when there is a rearrangement between them at the beginning and at the end of "Corrections".


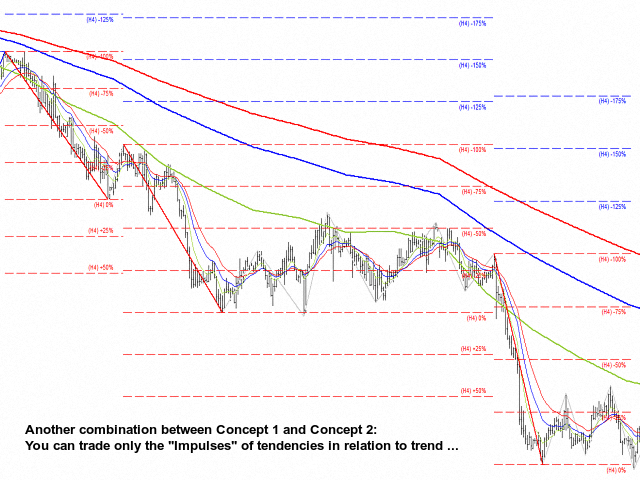
We also use other combinations to trade only the "Impulses" of tendencies in relation to trend.

    • For traders with a "Scalping" trading style, the following combinations are suitable:
    - If you are trading on the M1 time frame, we recommend using - 3 EMAs from time frame M15 (24,16,8) + 3 EMAs from time frame M1 (24,16,8), "Zig-zag" and "Correction levels" from time frame M5.
    - If you are trading on the M5 time frame, we recommend using - 3 EMAs from time frame Н1 (24,16,8) + 3 EMAs from time frame M5 (24,16,8), "Zig-zag" and "Correction levels" from time frame M15.
      • For traders who trade on time frames M15 - H1, the following combinations are suitable - 3 EMAs from time frame D1 (21,14,7) + 3 EMAs from time frame H1 (24,16,8), "Zig-zag" and "Correction levels" from time frame H4.
      • For traders who trade on time frame H4, the following combinations are suitable - 3 EMAs from time frame 1W + 3 EMAs from time frame H4 (21,14,7), "Zig-zag" and "Correction levels" from time frame D1.


      If you liked the indicator, please support our work by giving 5 stars!!!

      For MetaTrader 4 https://www.mql5.com/en/market/product/94053


      Indicator settings:

      Show Multi Time Frame MAs from: - Multi time frame on which to calculate the "Moving Averages". By default, the indicator works with data from time frame D1.
      Bars History for MAs calculation: - Number of bars on which the indicator works from multi time frame D1.
      Show Multi Time Frame Correction from: - Multi time frame on which to calculate the "Zig-Zag" and "Correction Levels". By default, the indicator works with data from time frame D1.
      Bars History for Correction calculation: - Number of bars on which the indicator works from multi time frame D1.

      Section "Visual Trading Styles Settings"
      Style 1: Show Moving Averages - Shows or not "Moving Averages".
      Style 2: Show Zig-Zag - Shows or not "Zig-Zag".
      Style 3: Show Correction Levels - Shows or not "Correction Levels".
      Style 4: Delete inactive Correction Levels - Shows or deletes inactive "Correction Levels". The shows of inactive corrections is for the purpose of researching the history of a financial instrument.
      Style 5: Show active Levels short Info text - Show an abbreviated form of information about "Correction Levels". If not, it shows an expanded form of the "Correction Levels" information.
      Style 6: Show Pips Info text - Shows or not Pips Info text.

      Section "Moving Averages Settings"
      In this section you can set the visual and technical details for "Moving Averages".

      Section "Zig-Zag Settings"
      In this section you can set the visual details for "Zig-Zag".

      Section "Correction Line Settings"
      In this section you can set the visual details for "Correction Line".

      Section "Correction Levels Text Settings"
      In this section you can set the visual and technical details for "Correction Levels Text".

      Section "Pips Info Text Settings"
      Use manual Pips calculation - Allows to choose between manual or automatic mode to calculate the Pips between two corrections. By default, automatic mode is on. We provide this option because different "Brokers" provide different forms of information about the same financial instrument. For example, one "Broker" provides information about the financial instrument "NAS100" with 1 decimal place, and another "Broker" with 2 decimal places. The manual Pips calculation form allows you to make the values for the pips shown in the indicator the same.
      Characters after the decimal point - In manual Pips calculation mode you can choose how many decimal places to calculate pips.

        Önerilen ürünler
        Limitless MT5
        Dmitriy Kashevich
        Limitless MT5 is a universal indicator suitable for every beginner and experienced trader. works on all currency pairs, cryptocurrencies, raw stocks Limitless MT5 - already configured and does not require additional configuration And now the main thing Why Limitless MT5? 1 complete lack of redrawing 2 two years of testing by the best specialists in trading 3 the accuracy of correct signals exceeds 80% 4 performed well in trading during news releases Trading rules 1 buy signa
        MarketMagnet
        Kelly Adediran Raymond
        Are you ready to take your trading journey to new heights? Look no further than MarketMagnet, this groundbreaking indicator designed to propel your trading success with excitement and accuracy. Powered by the convergence of Momentum and CCI (Commodity Channel Index), MarketMagnet equips traders with the ultimate tool to determine direction and entry prices for a wide range of recommended currency pairs and instruments. It is designed for traders seeking to scalp for a few pips on lower timeframe
        Divergence Detection: The indicator is designed to identify divergences between the price movement and the Stochastics oscillator. This can help traders spot potential trend reversals or trend continuation opportunities. Early Warning System: By capturing divergences, the Stochastics Divergence Indicator can provide an early warning of possible market turning points. This allows traders to take timely action and make informed decisions. Versatility: The indicator can be applied to various finan
        This indicator is based on a mathematical formula and an ANN combined, designed to make a model(using previous prices) of the most recent market condition (any chart*) in order to use the model as a forecasting tool. *This indicator can operate on any chart/timeframe, but it's suggested you use multiple timeframes for each trade because this method relies solely on the time factor, you can not use this indicator to predict price volatility, but if it's fit correctly it will show you when the nex
        The new update makes this indicator a complete tool for studying, analyzing and operating probabilistic patterns. It includes: On-chart Multi-asset percentage monitor. Configurable martingales. Twenty-one pre-configured patterns, including Mhi patterns and C3. An advanced pattern editor to store up to 5 custom patterns. Backtest mode to test results with loss reports. Trend filter. Hit operational filter. Martingale Cycles option. Various types of strategies and alerts. Confluence between patter
        Volatility Index Pro Indicator
        Savia Forex Software Solutions
        Volatility Index Pro Indicator The Savia Forex Solutions Volatility Index Pro Indicator gives you highly accurate entries on all Volatility Indices and Jump Indices. The Volatility Index Pro Indicator is dynamic and powerful and is optimized for all timeframes. Trade with improved confidence and maximize your success rate. Benefits Dynamic and Powerful. Volatility Index Pro Indicator is fully optimized for all chart timeframes. Volatility Index Pro Indicator works with Volatility Indices and Jum
        The Plasma Trend indicator is a simple technical indication that is used to determine the current trend direction in the market. The Plasma Trend indicator is a powerful tool for determining the direction of the trend in the Forex market. It is based on both standard technical indicators and proprietary mathematical calculations, which provides a more accurate and reliable trend determination. Its implementation in the form of lines of two colors simplifies the visual determination of a change
        Market Session Pro
        Kambiz Shahriarynasab
        The  Market Sessions Indicator for MT5 helps you  predict market turnarounds  by detecting major supply and demand areas. These pivot points tend to occur after a new session has started and the previous one is still open. It is also used to gauge how many points or pips the market moves on average during a session. This helps us to place better our take profits and stop losses. The indicator works on all forex pairs, gold, silver, commodities, stocks, indices and any other instrument that your
        - This is the exact conversion from TradingView: "Support/Resistance" By "BarsStallone". - This indicator lets you read the buffers for R/S values. - This is a non-repaint and light processing load indicator. - This is not a multi time frame indicator If you want the multi time frame version you should create a personal order and I deliver two files that you need them both to have the multi time frame indicator running on your system. - The MT4 version of the indicator is not light load from pr
        Hello There, Today I want to show you my new researchable fore BUY SELL indicator, it work all asset, and also work Derive Volatility asset! it work all time frame, but i recommend start 5 minute to H1 when you receive a signal just take trade and stay wait for your take profit asset All Major Pair And minor IT WORK ALSO XAUUSD Fantastic results,  for more info,,, message us thank you   
        Gösterge, İKİLİ SEÇENEKLER için giriş sinyalleri üretir, grafikte bir ok çizer ve sesli bir uyarı verir. ÇALIŞMA SAATLERİ: 6.OO GMT/ 17.00 GMT (17.00 GMT'den sonra ve gece çok düşük volatilite ve hacim eksikliği nedeniyle önerilmez) ÇİFTLER: EUR/USD (@EU6), GBP/USD (BP6). Zaman dilimleri: 1,2,3,5,10,15 dakika En iyi zaman aralığı: 3 dakika SON KULLANMA TARİHİ: 1 mum Göstergenin çalışması için gerçek hacimlere (onay hacmi yok) ihtiyacı vardır: EUR/USD, GBP/USD ECC spot çiftlerinde çalı
        PipFinite Exit EDGE MT5
        Karlo Wilson Vendiola
        4.89 (35)
        Did You Have A Profitable Trade But Suddenly Reversed? In a solid strategy, exiting a trade is equally important as entering. Exit EDGE helps maximize your current trade profit and avoid turning winning trades to losers. Never Miss An Exit Signal Again Monitor all pairs and timeframes in just 1 chart www.mql5.com/en/blogs/post/726558 How To Trade You can close your open trades as soon as you receive a signal Close your Buy orders if you receive an Exit Buy Signal. Close your Sell orde
        The implementation of the Trend Turn trend indicator is simple - in the form of lines of two colors. The indicator algorithm is based on standard indicators as well as its own mathematical calculations. The indicator will help users determine the direction of the trend. It will also become an indispensable advisor for entering the market or closing a position. This indicator is recommended for everyone, both beginners and professionals. How to interpret information from the indicator. We se
        Fib Auto Trendline
        Nhlanhla Brilliant Mashavha
        INTRODUCTION The  Fib Autotrendline   is a basic tool that analysts use to find out when a security's trend is reversing. By determining the   support and resistance areas , it helps to identify significant changes in price while filtering out short-term fluctuations, thus eliminating the noise of everyday market conditions. It is an excellent tool for any trader who follows indicators that use   swing highs  and   swing lows . How to Use the fib Auto Trendline Indicator The Fib Auto Trendline
        This indicator identifies and displays zones, as it were areas of strength, where the price will unfold. The indicator can work on any chart, any instrument, at any timeframe. The indicator has two modes. The indicator is equipped with a control panel with buttons for convenience and split into two modes. Manual mode: To work with manual mode, you need to press the NEW button, a segment will appear. This segment is stretched over the movement and the LVL button is pressed. The level is displayed
        My PVSR
        Ashok Kumar Singha
        My PVSR   is based on All Type of Pivot Points. Use this Indicator to get proper Support / Resistance Zone and Trade accordingly.. Recommendation: Use this Indicator along with my another Indicator --->>> Dr. Trend   <<<--- Click Here ; To get the best output result feel free to contact me ; Best of Luck It can be used for: All Pairs: Forex, Cryptocurrencies, Metals, Stocks, Indices etc. All Timeframe All Brokers All type of Trading Style like Scalping, Swing, Intraday, Short-Term, Lon
        A useful scanner/dashboard that shows the RSI values for multiple symbols and Time-frames. It can be easily hidden/displayed with a simple click on the scanner man top left of the dashboard. You can input upper and lower RSI values and the colours can be set to show when above/below these values. The default values are 70 and 30. There are also input colours for when the RSI is above or below 50 (but not exceeding the upper/lower levels Symbols and time-frames are input separated by commas.
        The Reversal Trend indicator was created on the basis of the original indicators for searching for extremes, the indicator is well suited for determining a reversal or a large sharp jerk in one direction, thanks to it you will know when this happens, it will notify you by the appearance of a blue dot to buy red to sell. It is based on the process of identifying the rate of change in price growth and allows you to find entry and exit points from the market. a fundamental technical indicator
        Gioteen Volatility Index (GVI) - your ultimate solution to overcoming market unpredictability and maximizing trading opportunities. This revolutionary indicator helps you in lowering your losing trades due to choppy market movements. The GVI is designed to measure market volatility, providing you with valuable insights to identify the most favorable trading prospects. Its intuitive interface consists of a dynamic red line representing the volatility index, accompanied by blue line that indicate
        Premium seviye, %80'den fazla doğru tahmin doğruluğuna sahip benzersiz bir göstergedir! Bu gösterge en iyi Ticaret Uzmanları tarafından iki aydan uzun süredir test edilmiştir! Yazarın göstergesini başka hiçbir yerde bulamazsınız! Ekran görüntülerinden bu aracın doğruluğunu kendiniz görebilirsiniz! 1, sona erme süresi 1 mum olan ikili opsiyon ticareti için harikadır. 2 tüm döviz çiftleri, hisse senetleri, emtialar, kripto para birimleri üzerinde çalışır Talimatlar: Kırmızı ok görün
        Reliable Scalping Indicator   RELIABLE SCALPING INDICATOR ( RSI ) As the name implies, this indicator gives reliable BUY and SELL signals on your chart. NO FANCY INDICATORS, NO MESSING WITH YOUR CHARTS. IT DOES NOTHING TO YOUR CHARTS EXCEPT TO SHOW ARROWS FOR BUYS AND SELLS. It DOES NOT repaint and has alerts and notifications which you can allow. It has chart notifications, mobile and email notifications and alerts. THIS INDICATOR PRODUCES ABOUT 85% ACCURATE SIGNALS WHICH IS VERY ENOUGH TO MAKE
        How to use Pair Trading Station Pair Trading Station is recommended for H1 time frame and you can use it for any currency pairs. To generate buy and sell signal, follow few steps below to apply Pair Trading Station to your MetaTrader terminal. When you load Pair Trading Station on your chart, Pair Trading station will assess available historical data in your MetaTrader platforms for each currency pair. On your chart, the amount of historical data available will be displayed for each currency pai
        11 göstergenin tümü hızla kapanır ve hızla açılır! gösterge seti: 2 gösterge "TREND"   : - hızlı = satır 4 renk - yavaş = noktalar 4 renk Göstergelerin rengi, trendin yönüne ve RSI göstergesine bağlıdır: 1) yükseliş trendi ve RSI <%50 2) yükseliş trendi ve RSI>%50 3) düşüş trendi RSI<%50 4) düşüş trendi RSI   >   %50 Her zaman çerçevesi için gösterge dönemlerini ayarlayın: M5 M10 M15 M30 H1 H2 H4 H6 H12 D1 W1 MN Göstergelerden en az 1 tanesi yatay ise işlem yapmayın. Bir ticaret içi
        Balance Weighted Moving Hedge System- is the trend following manual system for forex/crypto market. Indicator represents custom balance-weighted moving average indicator. The main advantagies : very stable moving with really early signals, defines current trend power, ignores market noise. The more width of indicator line - the more expressive trend is. On the other hand thin moving line shows unstable / choppy market. Indicator can be used as single b alance weighted moving or with hedge strate
        A powerful oscillator that provide Buy and Sell signals by calculating the investor liquidity. The more liquidity the more buy possibilities. The less liquidity the more sell possibilities. Please download the demo and run a backtest! HOW IT WORKS: The oscillator will put buy and sell arrow on the chart in runtime only . Top value is 95 to 100 -> Investors are ready to buy and you should follow. Bottom value is 5 to 0 -> Investors are ready to sell and you should follow. Alert + sound will app
        Noize Absorption Index - is the manual trading system that measures the difference of pressure between bears forces and bulls forces. Green line - is a noize free index that showing curent situation. Zero value of index shows totally choppy/flat market.Values above zero level shows how powerfull bullish wave is and values below zero measures bearish forces.Up arrow appears on bearish market when it's ready to reverse, dn arrow appears on weak bullish market, as a result of reverse expectation.
        Skiey
        Vitalii Zakharuk
        Skiey - Indicator of easy solutions! Using this indicator is very simple, since the simplest is to look at the chart and act according to the color arrows. Such a calculation option takes into account intraday price fluctuations and focuses on measuring the "candlestick" share in the trend. The algorithm takes into account the measurement of prices, this method also emphasizes the measurement of each of the price drops (H / C, H / O, LC, LO) - which gives more detailed information but also mo
        The "Deviation Scaled Moving Average Crosses" indicator is a powerful technical analysis tool designed for the MetaTrader 5 trading platform. It facilitates informed trading decisions by visually presenting the interaction between two moving averages, both of which are smoothed and scaled to offer enhanced insights into market trends. This custom indicator is developed by mladen and is copyright-protected for the year 2023. Using a unique approach, the indicator displays two types of deviatio
        The indicator is designed to work on any trading platform. The program is based on proprietary algorithms and W.D.Ganna's mathematics, allowing you to calculate target levels of price movement based on three points with the highest degree of certainty. It is a great tool for stock trading. The indicator has three buttons: NEW - call up a triangle for calculation. DEL - delete the selected triangle. DELS - completely remove all constructions. The probability of achieving the goals is more than 80
        Atomic Analyst MT5
        Issam Kassas
        3.64 (11)
        Öncelikle belirtmek gerekir ki bu Ticaret Göstergesi Yeniden Çizim Yapmaz, Gecikmez ve Gecikme Göstermez, bu da hem manuel hem de robot ticareti için ideal hale getirir. Atom Analisti, Piyasada Daha İyi Bir Avantaj Bulmak İçin Fiyatın Gücünü ve Momentumunu Kullanan PA Fiyat Hareketi Göstergesidir. Gürültüleri ve Yanlış Sinyalleri Kaldırmaya ve Ticaret Potansiyelini Artırmaya Yardımcı Olan Gelişmiş Filtrelerle Donatılmıştır. Birden fazla katmanlı karmaşık göstergeler kullanarak, Atom Analisti
        Bu ürünün alıcıları ayrıca şunları da satın alıyor
        FX Volume MT5
        Daniel Stein
        4.94 (17)
        Sabah Brifingimiz aracılığıyla ayrıntılar ve ekran görüntüleri ile günlük piyasa güncellemenizi alın burada mql5 ve on Telegram ! FX Volume, bir brokerin bakış açısından piyasa duyarlılığı hakkında GERÇEK bir fikir veren İLK ve TEK hacim göstergesidir. COT raporlarından çok daha hızlı bir şekilde, brokerlar gibi kurumsal piyasa katılımcılarının Forex piyasasında nasıl konumlandıklarına dair harika bilgiler sağlar. Bu bilgileri doğrudan grafiğinizde görmek, ticaretiniz için gerçek oyun değiştir
        Advanced Supply Demand MT5
        Bernhard Schweigert
        4.53 (15)
        Herhangi bir Acemi veya Uzman Tüccar için En İyi Çözüm! Bu gösterge benzersiz, yüksek kaliteli ve uygun fiyatlı bir ticaret aracıdır çünkü bir dizi tescilli özelliği ve yeni bir formülü bir araya getirdik. Bu güncelleme ile çift zaman dilimi dilimlerini gösterebileceksiniz. Yalnızca daha yüksek bir TF gösteremeyeceksiniz, aynı zamanda TF grafiğini ve ARTIK daha yüksek TF'yi de gösterebileceksiniz: YUVARLAK BÖLGELERİ GÖSTERMEK. Tüm Arz Talebi tüccarları buna bayılacak. :) Önemli Bilgiler Açıkland
        XQ Indicator MetaTrader 5
        Marzena Maria Szmit
        5 (1)
        Step into the realm of Forex trading with confidence and precision using XQ, a cutting-edge Forex indicator designed to elevate your trading game to unprecedented heights. Whether you're a seasoned trader or just stepping into the world of currency exchange, XQ Forex Indicator empowers you with the insights and signals needed to make informed trading decisions. The signal conditions are a combination of three indicators, and XQ Forex Indicator only display  medium and long-term trends . The ind
        Gann Kare Göstergesi, W.D. Gann tarafından yazılan "Piyasa Tahminleri için Matematiksel Formül" makalesine dayalı güçlü bir piyasa analizi aracıdır. Bu araç, piyasa analizi için matematiksel ve Gann teorilerini kullanarak hassas analizler gerçekleştirir. 144, 90, 52 karelerini ve ayrıca 9 karesini kullanır. Ayrıca, ın 9 karesi ve bu kareyle ilişkili kanallar ve yıldız modelleri için yöntemini içerir. Kullanıcı Kılavuzu ve Uygulama: Bu göstergeleri kullanmadan önce, kullanıcı kılavuzunu okumanız
        Golden Gate Algo MT5
        James David Lane
        4 (6)
        CHRISTMAS İÇİN %40 İNDİRİM! 1 OCAK'TA FİYATI $250'YE YÜKSELECEK! GoldenGate Entries Tanıtımı: Keskin Kenarlı Bir Ticaret Çözümü! GoldenGate Entries (GGE) ile ticarette devrim niteliğinde bir yaklaşım keşfedin. GGE, ticaret deneyiminizi yükseltmek amacıyla tasarlanmış gelişmiş bir gösterge olup kullanıcılara ticaret kararlarında hassasiyet ve güven sağlamak için kapsamlı bir özellik seti sunar. Çiftler: Herhangi biri (FX - Emtia - Hisse Senetleri - Hisse Senetleri - Kripto) Zaman Çerçeve
        Bill Williams Advanced
        Siarhei Vashchylka
        5 (3)
        Bill Williams Advanced is designed for automatic chart analysis using Bill Williams' "Profitunity" system. The indicator analyzes four timeframes at once. Manual (Be sure to read before purchasing) Advantages 1. Automatically analyzes the chart using the "Profitunity" system of Bill Williams. The found signals are placed in a table in the corner of the screen. 2. Equipped with a trend filter based on the Alligator indicator. Most of the system signals are recommended to be used only accordi
        TPA True Price Action indicator reveals the true price action of the market makers through 100% non-repainting signals strictly at the close of a candle! TPA shows entries and re-entries, every time the bulls are definitely stronger than the bears and vice versa. Not to confuse with red/green candles. The shift of power gets confirmed at the earliest stage and is ONE exit strategy of several. There are available now two free parts of the TPA User Guide for our customers. The first "The Basics"
        TrendMaestro5
        Stefano Frisetti
        note: this indicator is for METATRADER4, if you want the version for METATRADER5 this is the link:  https://www.mql5.com/it/market/product/108106 TRENDMAESTRO recognizes a new TREND in the bud, he never makes mistakes. The certainty of identifying a new TREND is priceless. DESCRIPTION TRENDMAESTRO identifies a new TREND in the bud, this indicator examines the volatility, volumes and momentum to identify the moment in which there is an explosion of one or more of these data and therefore the mome
        Professional Scalping Tool on Deriv Attention! The indicator will be sold in limited quantities!!! Description: This trading indicator is designed for professional traders focused on scalping. Designed with the market in mind, it provides highly accurate spike trading signals. It works on the M1 timeframe and supports the following symbols: Boom 300 Index, Boom 500 Index, Boom 1000 Index, Crash 300 Index, Crash 500 Index, Crash 1000 Index. Functional Features: - Direction: - Trading is ca
        IVISTscalp5
        Vadym Zhukovskyi
        5 (3)
        We present you the iVISTscalp5 indicator, which is not only unique, but also effective in the analysis of trading operations. This indicator is based on time data and is the result of many years of experience and deep analysis of financial markets. The iVISTscalp5 indicator is an excellent assistant for manual trading. Convenience, simplicity and visualization. All the most difficult is hidden inside. We have simplified the settings and use of the iVISTscalp5 indicator as much as possible. The i
        VTrende Pro
        Andrii Diachenko
        5 (1)
        VTrende Pro - MTF indicator for trend trading with a display panel for MT5 *** Videos can be translated into any language using subtitles (video language - Russian) Although the signals of the VTrende Pro indicator can be used as signals of a full-fledged trading system, it is recommended to use them in conjunction with the Bill Williams TS. VTrende Pro is an extended version of the VTrende indicator. Difference between Pro version and VTrende: - Time zones - Signal V - signal 1-2 waves
        Swing Trading is the first indicator designed to detect swings in the direction of the trend and possible reversal swings. It uses the baseline swing trading approach, widely described in trading literature. The indicator studies several price and time vectors to track the aggregate trend direction and detects situations in which the market is oversold or overbought and ready to correct. [ Installation Guide | Update Guide | Troubleshooting | FAQ | All Products ] Profit for market swings with
        SMCpro MT5  Original Price  $440   ---  Currently Price  40% OFF  ( for unlimited use ) Hello World! Introducing.. SMCpro tool and Indicator for  MetaTrader 5 , a cutting-edge feature designed to revolutionize your trading experience. With innovative ICT Smart Money Concept, you gain unparalleled insight into market dynamics, empowering you to make informed trading decisions like never before. Built on the foundation of advanced algorithms and real-time data analysis, SMCpro tool and Indicat
        [ MT4 Version ] Backtesting Simulator Are you tired of spending months on demo or live accounts to test your trading strategies? The Backtesting Simulator is the ultimate tool designed to elevate your backtesting experience to new heights. Utilizing Metatrader historical symbol information, it offers an unparalleled simulation of real market conditions. Take control of your testing speed, test ideas quickly or at a slower pace, and witness remarkable improvements in your testing performance.
        Weis Wave with Alert MT5
        Trade The Volume Waves Single Member P.C.
        4.93 (15)
        Rental/Lifetime Package Options and Privileges  * For optimum results the yearly or lifetime package is suggested due to live training ! Rent Monthly Six Months   Yearly/Lifetime Weis Wave with Speed with Alert+Speed Index x x x Manual  x x x Quick Set up Video x x x Blog x x x Lifetime Updates x x x Setup and Training Material x x Free Rectangle Break Alert Tool      x Discord Access Channel "The SI traders" x 2-hour live methodology training x How to trade with it:    http://
        This is arguably the most complete harmonic price formation auto-recognition indicator you can find for the MetaTrader Platform. It detects 19 different patterns, takes fibonacci projections as seriously as you do, displays the Potential Reversal Zone (PRZ) and finds suitable stop-loss and take-profit levels. [ Installation Guide | Update Guide | Troubleshooting | FAQ | All Products ] It detects 19 different harmonic price formations It plots primary, derived and complementary Fibonacci p
        RAD CRITICAL LEVES RAD indicator tracks “Relevant Volume” in real time, identifying accumulation and distribution processes, projecting them in the chart as SUPPORT or RESISTANCE zones. Natural   support   and resistance levels are generated by Volume Accumulation and Distribution processes. As these processes evolve, levels at which the relevant volume in the market place is positioned, become difficult areas to cross upwards or downwards. By using this information, traders can identify very s
        Tricky to find and scarce in frequency, divergences are one of the most reliable trading scenarios. This indicator finds and scans for regular and hidden divergences automatically using your favourite oscillator. [ Installation Guide | Update Guide | Troubleshooting | FAQ | All Products ] Easy to trade Finds regular and hidden divergences Supports many well known oscillators Implements trading signals based on breakouts Displays suitable stop-loss and take-profit levels Configurable oscilla
        "Piranha" - an autonomous trading system that determines overbought and oversold levels on the chart. Red and blue zones represent overbought and oversold levels respectively. Entry points are marked with arrows: a downward arrow in the red zone for "sell" and an upward arrow in the blue zone for "buy". The Take profit level is indicated by the green moving average. Key features: Adjusting the Take profit level as the green moving average changes position. Averaging ability when a new market e
        Big Player Range
        Thalles Nascimento De Carvalho
        5 (2)
        "BigPlayerRange" göstergeye hoş geldiniz, finansal kurumların piyasalardaki önemli ilgi alanlarını belirlemek için geliştirilmiş bir teknik analiz aracı. Bu gösterge, ana pazar katılımcılarının önemli bir aktivite ve ilgi gösterdiği fiyat aralıklarının kesin analizini sunar. Temel Özellikler: 1. Kurumsal İlgi Alanlarının Haritalanması: "BigPlayerRange", finansal kurumların güçlü aktivite gösterdiği grafik alanlarını kesin olarak vurgular. Bu noktalar stratejik olarak önemlidir ve olası piy
        Introduction to X3 Chart Pattern Scanner X3 Cherart Pattern Scanner is the non-repainting and non-lagging indicator detecting X3 chart patterns including Harmonic pattern, Elliott Wave pattern, X3 patterns, and Japanese Candlestick patterns. Historical patterns match with signal patterns. Hence, you can readily develop the solid trading strategy in your chart. More importantly, this superb pattern scanner can detect the optimal pattern of its kind. In addition, you can switch on and off individu
        Multi-currency, multi-timeframe, harmonic pattern indicator AB = CD. Supports sending push notifications about signals to a mobile device, messages on e-mail, as well as messages using alerts on all available currency pairs and timeframes. This indicator was based on the indicator Harmonic ABCD Universal. Version for MetaTrader 5:  https://www.mql5.com/en/market/product/44972 . See also: Harmonic ABCD Universal for MetaTrader 4 . Using modern software development methods has made the indicator a
        The indicator is designed to close positions on the market in time. For example: to take profits ahead of schedule if the price has not reached TakeProfit, and the market is turning around. The indicator analyzes the momentum, not the trend. He does not give any information about the trend. The indicator is well suited for finding divergence. The Ershov 38 Parrots indicator dynamically adjusts to the market and detects price movement impulses of medium and high amplitude. It almost does not rea
        MetaForecast M5
        Vahidreza Heidar Gholami
        5 (2)
        MetaForecast, fiyat verilerindeki harmonileri kullanarak herhangi bir piyasanın geleceğini tahmin eder ve görselleştirir. Piyasa her zaman tahmin edilemezken, fiyatlarda bir desen varsa, MetaForecast geleceği mümkün olduğunca doğru bir şekilde tahmin edebilir. Benzer ürünlere göre, MetaForecast piyasa eğilimlerini analiz ederek daha kesin sonuçlar üretebilir. Giriş Parametreleri Past size (Geçmiş boyut) MetaForecast'ın gelecekteki tahminler oluşturmak için kullandığı çubuk sayısını belirtir. M
        Bu gösterge, W.D. Gann'ın dokuzun karesi ve 144'ün karesine bağlı olarak yazdığı "Piyasa tahminleri için matematiksel formül" makalesine dayanan bir piyasa analiz yöntemidir. Kullanım kılavuzu: Add Your review And contact us to get it Tam MT4 Sürümünü Şunlardan Satın Alabilirsiniz: https://www.mql5.com/en/market/product/15316 MT4'te ücretsiz olarak test edebilirsiniz: https://www.mql5.com/en/market/product/15320?source=Site +Profile+Seller#!tab=reviews Bu ürün sizin için Düz
        PZ Trend Trading MT5
        PZ TRADING SLU
        3.67 (3)
        Trend Trading is an indicator designed to profit as much as possible from trends taking place in the market, by timing pullbacks and breakouts. It finds trading opportunities by analyzing what the price is doing during established trends. [ Installation Guide | Update Guide | Troubleshooting | FAQ | All Products ] Trade financial markets with confidence and efficiency Profit from established trends without getting whipsawed Recognize profitable pullbacks, breakouts and early reversals The ind
        This indicator is a perfect wave automatic analysis indicator for practical trading! 黄金实战 案例... The standardized definition of the band is no longer a wave of different people, and the art of man-made interference is eliminated, which plays a key role in strict analysis of the approach.=》Increase the choice of international style mode, (red fall green rise style) The  purchase discount is currently in progress! Index content: 1.Basic wave: First, we found the inflection point of the ba
        Elliot Waves Analyzer Pro
        Viktor Weidenthal
        3.25 (4)
        Elliot Waves Analyzer Pro calculates Elliot Waves to Help Identify Trend direction and Entry Levels. Mainly for Swing Trading Strategies. Usually one would open a Position in trend direction for Wave 3 or a Correction for Wave C . This Indicator draws Target Levels for the current and next wave. Most important Rules for Elliot Wave Analysis are verified by the Indicator.  The Pro version analyzes Multiple Timeframes and shows the Subwaves and Target-Levels.   For an Overview  " Elliot Waves Anal
        Native Channels
        BeeXXI Corporation
        5 (2)
        This indicator recognizes all support and resistance levels. A number of unique high-performance techniques have been applied, which made the existence of this indicator possible. All formed channels are naturally visible: horizontal linear linear parabolic cubic (Polynomial 3 degrees - Wave) This is due to a bundle of approximating channels. The formed channels form "standing waves" in a hierarchical sequence. Thus, all support and resistance levels are visible. All parameter management is
        Elliott Wave Trend was designed for the scientific wave counting. This tool focuses to get rid of the vagueness of the classic Elliott Wave Counting using the guideline from the template and pattern approach. In doing so, firstly Elliott Wave Trend offers the template for your wave counting. Secondly, it offers Wave Structural Score to assist to identify accurate wave formation. It offers both impulse wave Structural Score and corrective wave Structure Score. Structural Score is the rating to sh
        Yazarın diğer ürünleri
        MR Range Breakouts 4
        Sergey Khramchenkov
        5 (1)
        " A trading range occurs when a financial instrument trades between constant high and low prices over a period of time. The upper part of the trading range of a financial instrument often provides price resistance, while the lower part of the trading range usually offers price support.  Traders can enter in the direction of a breakout or breakdown from a trading range... " This is the "Classical Theory" understanding of ranges. We have a different understanding of the nature of ranges and th
        MR Reversal Patterns 4
        Sergey Khramchenkov
        5 (2)
        In the "Masters of Risk" trading system, one of the main concepts is related to places where markets change direction. In fact, this is a change in priority and a violation of the trend structure at the extremes of the market, where supposedly there are or would be stop-losses of "smart" participants who are outside the boundaries of the accumulation of volume. For this reason, we call them "Reversal Patterns" - places with a lot of weight for the start of a new and strong trend. Some of the imp
        The most crucial price level in any "Volume Profile" is the "Point of Control" . Is the price level with the highest traded volume. And mainly, is the level where the big guys start there their positions, so it's an accumulation/distribution level for smart money. The idea of the indicator arose after the "MR Volume Profile Rectangles" indicator was made. When creating the "MR Volume Profile Rectangles" indicator, we spent a lot of time comparing the volumes with those from the volume profil
        MR Range Breakouts 5
        Sergey Khramchenkov
        5 (2)
        " A trading range occurs when a financial instrument trades between constant high and low prices over a period of time. The upper part of the trading range of a financial instrument often provides price resistance, while the lower part of the trading range usually offers price support.  Traders can enter in the direction of a breakout or breakdown from a trading range... " This is the "Classical Theory" understanding of ranges. We have a different understanding of the nature of ranges and th
        MR Reversal Patterns 5
        Sergey Khramchenkov
        5 (1)
        In the "Masters of Risk" trading system, one of the main concepts is related to places where markets change direction. In fact, this is a change in priority and a violation of the trend structure at the extremes of the market, where supposedly there are or would be stop-losses of "smart" participants who are outside the boundaries of the accumulation of volume. For this reason, we call them "Reversal Patterns" - places with a lot of weight for the start of a new and strong trend. Some of the im
        MR Volume POC Levels 4
        Sergey Khramchenkov
        5 (3)
        The most crucial price level in any "Volume Profile" is the "Point of Control" . Is the price level with the highest traded volume. And mainly, is the level where the big guys start there their positions, so it's an accumulation/distribution level for smart money. The idea of the indicator arose after the "MR Volume Profile Rectangles" indicator was made. When creating the "MR Volume Profile Rectangles" indicator, we spent a lot of time comparing the volumes with those from the volume profil
        A "Volume Profile" is an advanced charting indicator that displays total volume traded at every price level over a user specified time period. The main components of the volume profile are POC ( Point Of Control - the price level, at which the maximum number of contracts were executed during a selected period), VAH ( Value Area High - the highest price in the Value Area) and VAL ( Value Area Low - the lowest price in the Value Area). When we settled on the original indicator, we spent a lot o
        MR Dynamic POC 4
        Sergey Khramchenkov
        The most crucial price level in any "Volume Profile" is the "Point of Control" . Is the price level with the highest traded volume. And mainly, is the level where the big guys start there their positions, so it's an accumulation/distribution level for smart money. The idea of the indicator arose after the "MR Volume Profile Rectangles" indicator was made. When creating the "MR Volume Profile Rectangles" indicator, we spent a lot of time comparing the volumes with those from the volume profil
        We publish the indicator as a useful tool in trading and call this indicator the "Swiss Army Knife" because it provides many possibilities and combinations to help understand the material on the "Masters of Risk" trading system. The indicator itself is not part of the tools used in the "Masters of Risk" trading system. The indicator consists of 3 separate multi-timeframe indicators, which in combination with each other help to reduce the "noise" of false signals. The first of the indicators ar
        "Sentiments of traders" in the financial markets is a topic that has been of interest to us for a long time. In time, we could not find the right formula to define these sentiments. We went through many stages in the search for the right methodology - from taking data from external sources to calculate open positions of buyers and sellers to calculating tick volumes, but still we were not satisfied with the results. The calculation of open positions of buyers and sellers from external sources ha
        A "Volume Profile" is an advanced charting indicator that displays total volume traded at every price level over a user specified time period. The main components of the volume profile are POC ( Point Of Control - the price level, at which the maximum number of contracts were executed during a selected period), VAH ( Value Area High - the highest price in the Value Area) and VAL ( Value Area Low - the lowest price in the Value Area). When we settled on the original indicator, we spent a lot o
        MR Dynamic POC 5
        Sergey Khramchenkov
        The most crucial price level in any "Volume Profile" is the "Point of Control" . Is the price level with the highest traded volume. And mainly, is the level where the big guys start there their positions, so it's an accumulation/distribution level for smart money. The idea of the indicator arose after the "MR Volume Profile Rectangles" indicator was made. When creating the "MR Volume Profile Rectangles" indicator, we spent a lot of time comparing the volumes with those from the volume profil
        "Sentiments of traders" in the financial markets is a topic that has been of interest to us for a long time. In time, we could not find the right formula to define these sentiments. We went through many stages in the search for the right methodology - from taking data from external sources to calculate open positions of buyers and sellers to calculating tick volumes, but still we were not satisfied with the results. The calculation of open positions of buyers and sellers from external sources ha
        Filtrele:
        İnceleme yok
        İncelemeye yanıt
        Sürüm 1.5 2023.03.15
        - Fixed some technical details.
        Sürüm 1.4 2023.02.21
        - Improved the formula for determining the important "Impulses". With the new formula, we reduce even more "noise" from potentially false (bad) signals!!!