Tillson TMA T3
- Göstergeler
- Emin Ulucanli
- Sürüm: 1.10
- Güncellendi: 7 Mart 2023
TILLSON MOVING AVERAGE
TMA veya T3 indikatörü olarak da bilinir. Formülünde EMA ve DEMA kullanan ve 3. derece Binom açılımı ile hesaplanan bir hareketli ortalamadır.
   ...
   int     handle1;     //Handle of the Tillson TMA T3.EX5 custom indicator
   double  euBuff1[];
   int TMAperiod=12;
   int TMSshift=0;
   double VolumeFactor=0.618;

int OnInit()
   {
   ...
   handle1=iCustom(NULL,PERIOD_CURRENT,"Market\\Tillson TMA T3.EX5",0,TMAperiod,0,0,TMSshift,0,0,VolumeFactor);
   ArrayResize(euBuff1,5); //Set a new array size specifying the reserve of 5 elements!
   ArraySetAsSeries(euBuff1,true);
   ...
   }

//Code to use in indicators
int OnCalculate(..........)
   {
   ...
   CopyBuffer(handle1, 0, 0, 4, euBuff1); //Copy the values of the indicator Tillson TMA T3 to our indicator buffer
   printf (euBuff1[3]);
   ...
   }

//Code to use in Expert Advisors
void OnTick()
   {
   ...
   CopyBuffer(handle1, 0, 0, 4, euBuff1); //Copy the values of the indicator Tillson TMA T3 to our indicator buffer
   printf (euBuff1[3]);
   ...
   }


void OnDeinit(const int reason)
  {
   ...
  IndicatorRelease(handle1);  //free the handle of the indicator
  }
Artıları;
1- Diğer hareketli ortalamalarda karşılaşılan hatalı sinyalleri (sürekli çizilen zig zag) olabildiğinde azaltmıştır.
2- Klasik hareketli ortalamalardaki görülen gecikmelerin önüne geçmiştir.
3- Trendlerde çok başarılıdır
Eksileri
1- Yatay piyasalarda etkili değildir.
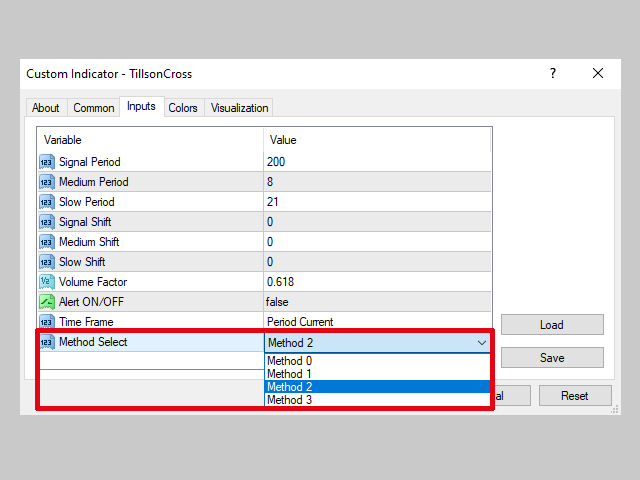
Parametrelerin ayarlanması;
Periyot; Tavsiye edilen değer 5 olsa da 7 veya 8 değerleri de kullanılabilmektedir.
Volume Factor; 0 ile 1 aralığı tavsiye edilen değer aralığı olmakla birlikte maksimum 2 ‘ye kadar çıkabilmektedir. Tavsiye edilen değer 0.7 ‘dir. Volume Factor ‘ün T3 ‘e etkisini daha basitçe anlatmak gerekirse 0 ‘a yakın değerler alırsa EMA ‘ya, 1 yakın değerleri alırsa DEMA ‘ya benzer davranışlar sergilemesini sağlayacaktır.
BUY/SELL Sinyalleri;
Method 1; 1 adet T3 ‘ün kullanıldığı bir strateji,
Volume Factor=0.7 iken Periyot=8 ve üstü değerler almalı
- Barlar T3 ‘ü yukarı keserse BUY sinyal
- Barlar T3 ‘ü aşağı keserse SELL sinyal
Methot 2; 2 adet T3 ‘ün kullanıldığı bir strateji,
- Küçük Periyotlu T3 ‘ün büyük Periyotlu T3 ‘ü aşağıdan yukarı kesmesi BUY sinyal
- Küçük Periyotlu T3 ‘ün büyük Periyotlu T3 ‘ü yukarıdan aşağıya kesmesi SELL sinyal
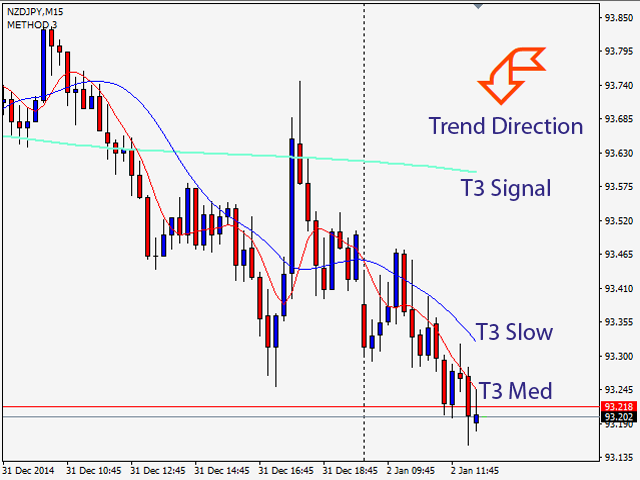
Methot 3; 3 adet T3 ‘ün kullanıldığı bir strateji,
Method 2 ‘ye trend yönü belirleyici üçüncü bir T3 ‘ün eklenmesinden oluşuyor. Varsayılan değerler; Periyot1=200, Periyot2=8, Periyot3=21 ve Volume Factor=0.7
Periyot1=200 olan T3 trend yönü belirleyicisi olacak. Yani küçük periyotlu T3 ‘ler 200 ‘lük T3 ‘ün üzerinde iken trend yukarı olduğu kabul edilecek ve Methot 2 ye göre sadece BUY sinyaller dikkate alınacak. Aynı şekilde küçük periyotlu T3 ‘ler 200 ‘lük T3 ‘ün altında iken trendin yukarı olduğu kabul edilecek ve Methot 2 ye göre sadece SELL sinyaller dikkate alınacak.


Danke, sehr gute Ergebnisse.