Wilders Average True Range for MT5
- Göstergeler
- Fernando Carreiro
- Sürüm: 1.0
(Google çevirisi)
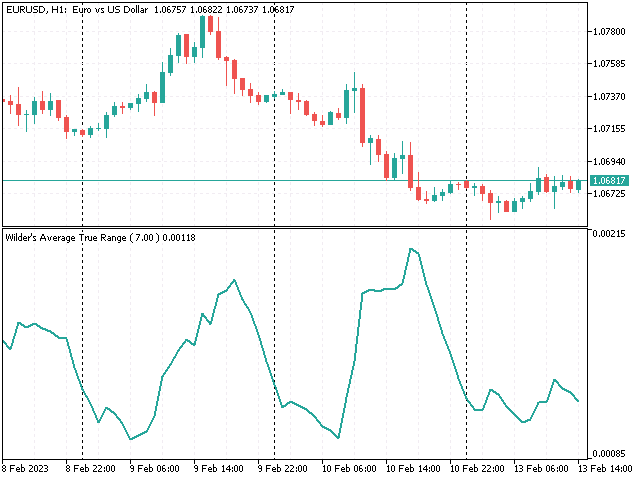
Bu gösterge, kitabında açıklandığı gibi, John Welles Wilder Jr. tarafından geliştirilen orijinal “Average True Range (ATR)”yi uygular— Teknik Ticaret Ticaret Sistemlerinde Yeni Kavramlar [1978].
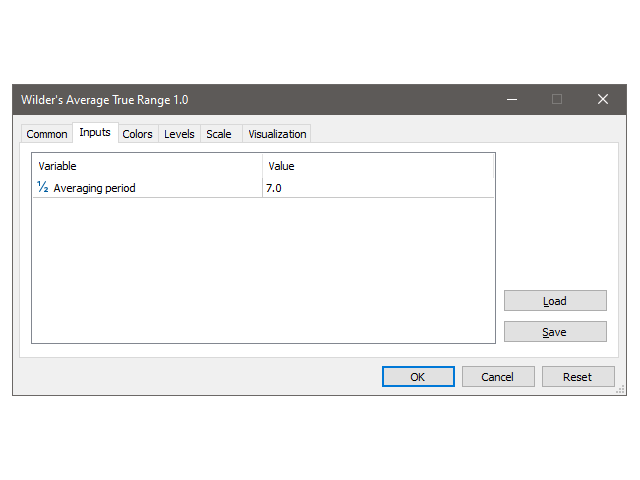
Basit hareketli ortalama (SMA) yerine düzleştirilmiş hareketli ortalama (SMMA) olarak da bilinen Wilder'ın hareketli ortalamasını kullanır. MetaTrader yerleşik ATR göstergesinde kullanıldığı gibi. Kitabındaki açıklamaya göre uygulanan varsayılan süre 14 yerine 7'dir.
(Original text)
This indicator implements the original “Average True Range (ATR)” developed by John Welles Wilder Jr., as described in his book—New Concepts in Technical Trading Systems [1978].
It uses Wilder’s moving average, also known as the smoothed moving average (SMMA), instead of a simple moving average (SMA) as used on MetaTrader’s built-in ATR indicator. The default period applied is 7, instead of 14, as per the description in his book.