DR and IDR
- Göstergeler
- Barend Paul Stander
- Sürüm: 1.4
- Güncellendi: 20 Mart 2023
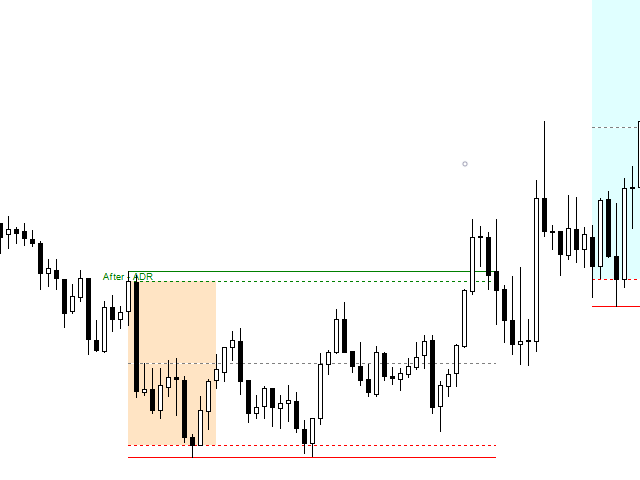
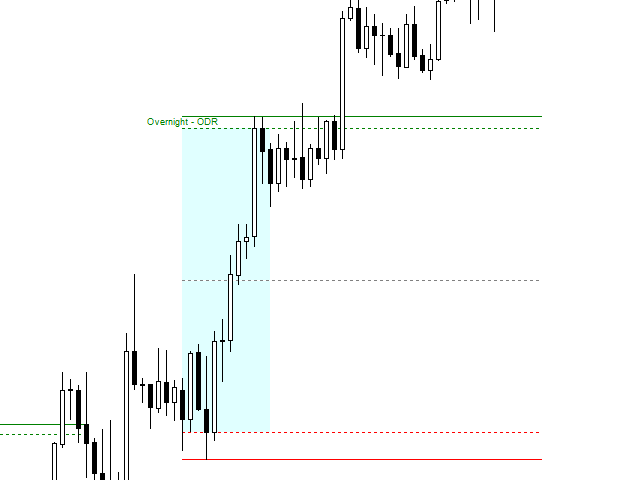
Defining Range ( DR ) and Implied Defining Range ( IDR ) indicator
Show DR and IDR ranges on the chart for Regular , Overnight and After Sessions
for more information how DR and IDR work and the high probability watch : https://www.youtube.com/@themas7er
or https://twitter.com/IamMas7er
Remember to set set your chart TimeZone when you attach indicator to the chart under indicator settings / inputs
Volume Imbalance : https://www.mql5.com/en/market/product/91165?source=Site+Profile+Seller
...


Nice one...Please add DR step 0.5,1,1.5 etc. which is visible till next IDR