Diamond by MMD MT5
- Göstergeler
- Mariusz Maciej Drozdowski
- Sürüm: 7.33
- Güncellendi: 26 Nisan 2023
- Etkinleştirmeler: 5
MMD'den Elmas
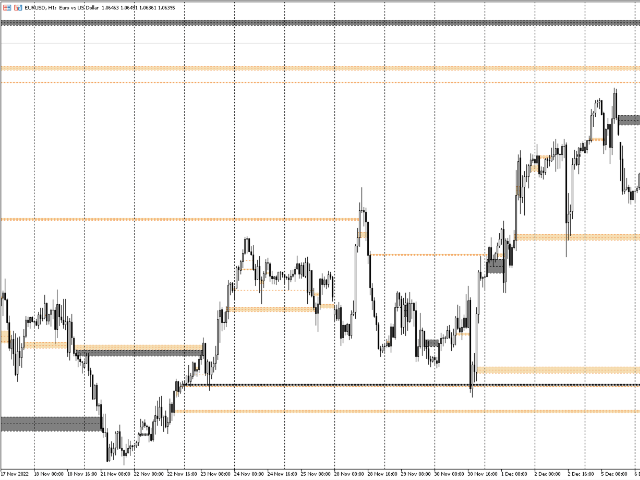
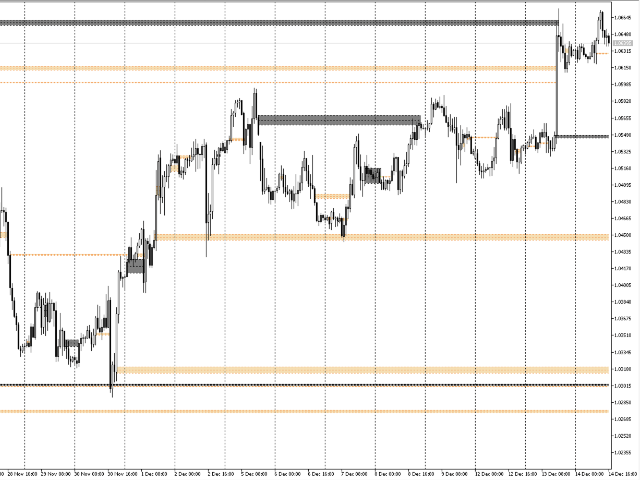
Diamond by MMD, fiyat davranışı için önemli olan yerleri tanımlayan gelişmiş bir göstergedir.
Bu gösterge - herhangi bir zaman diliminde - grafikte fiyat reaksiyon bölgelerini algılar ve işaretler.
MMD metodolojisindeki bilgi piramidinin unsurlarından biri olan elmaslar, çok katı koşulları karşılayan mumlardır.
İki ana elmas türü vardır:
- standart elmas
- ters bunama.
Bu modellerin her ikisi de otomatik olarak tanımlanır ve tablo üzerinde işaretlenir.
Gösterge elmasları, örneğin M5 aralığından H1 aralığında işaretleyebilir. Göstergenin varsayılan ayarı, grafiğinizin o anda açık olduğu zaman dilimindeki elmasları gösterir.
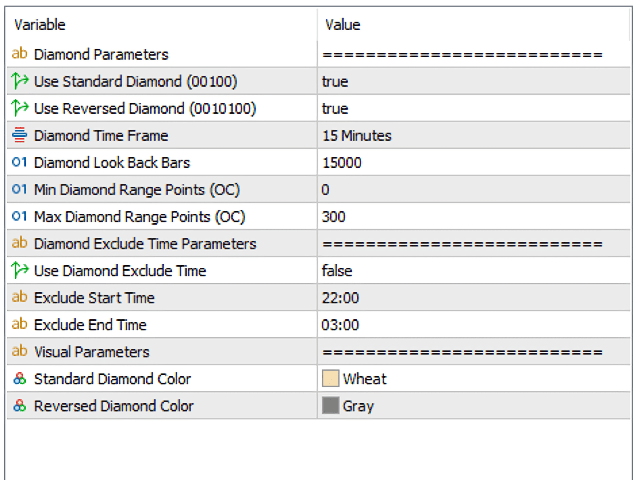
Gösterge parametrelerinin açıklaması.
Standart Elmas Kullan - 00100 modelinde elmasları gösterir/gizler
Ters Elmas Kullan - 0010100 modelinde elmasları gösterir/gizler
Elmas Zaman Çerçevesi - elmasların gösterileceği aralığı belirtmenizi sağlayan bir seçenek. Örneğin M5 aralığındaki elmasları M1 veya H1 mumlarıyla grafikte göstermek mümkündür.
Elmas Geriye Bakma Çubukları - belirli bir aralıkta - taranacak - elmaslar için seçilen parametreleri karşılayan mumları aramak için mum sayısını belirtir.
Minimum Elmas Aralığı Puanları - minimum elmas boyutu (puan olarak).
Max Diamond Range Points - maksimum elmas boyutu (puan olarak).
Elmas Hariç Tutma Süresini kullanın - parametrenin etkinleştirilmesi/devre dışı bırakılması. Bu parametre, elmaslar için belirlenen koşulları karşılayan mumların grafikte işaretlenmeyeceği süreyi belirlemekten sorumludur. Bu özellikle gece saatleri için geçerlidir.
Hariç Başlangıç Zamanı - elmasların işaretlenmeyeceği dönemin başlangıcının göstergesi.
Hariç Bitiş Zamanı - elmasların işaretlenmeyeceği sürenin sonunun göstergesi.
Standart Elmas Rengi - standart elmasın rengi.
Ters Elmas Rengi - ters elmasın rengi.