Candle Heiken Ashi
- Göstergeler
- BPASoftware Thai Co. Ltd
- Sürüm: 1.3
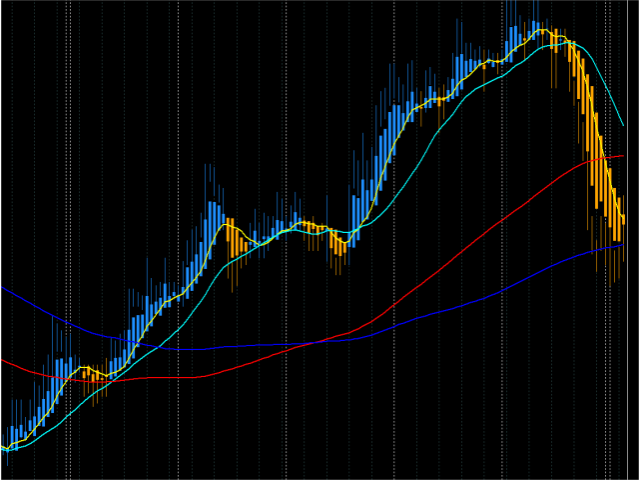
Presentation
Another indicator that makes scalping on tick charts easier, it displays an Heiken Ashi graph in Ticks.
It allows to detect entry points and trend reversals.
Recommended number of ticks in a candle : 5, 13 or 21.
Parameters
- Ticks in candle: Number of ticks in a candle (default 5),
- Displays Trend arrows : displays a trend arrow based on EMA8 and EMA20 crossing,
- Displays MM50,
- Displays MM100,
- Max Candle (CPU): number of candles max to manage, low value will save ressources of your computer (CPU).
EA Interface
This indicator sends a chart event (23 or 24) when EMA8 and MA20 cross.
Be careful, after crossing, at least, the color of Heiken Ashi candles must be checked before opening a position.
Chart event 23: a bullish trend is starting
Chart event 24: a bearish trend is starting
Record ticks values
It is not realistic to record all the ticks (huge volume of data), so these indicators collect ticks data in real time, hence the display of this indicator will be reset to 0 every time you will restart it.

fantastic!! is there an EA that might work with TickCandle?