Stochastic RSI Alerts MT5
- Göstergeler
- Javier Morales Fernandez
- Sürüm: 1.0
- Etkinleştirmeler: 5
Stokastik RSI nedir?
Stokastik RSI (StochRSI), teknik analizde kullanılan, sıfır ile bir (veya bazı grafik platformlarında sıfır ile 100) arasında değişen ve Stokastik osilatör formülünün standart fiyat verileri yerine bir dizi göreli güç endeksi (RSI) değerine uygulanmasıyla oluşturulan bir göstergedir. Bu sürüm, gerçekten iyi fırsatları kaçırmamak için uyarılar içerir. Bir sinyal satın alma emri veya sinyal satış emri almak istediğinizde parametreyi ayarlarsınız. Herhangi bir sinyal almak için masaüstü sürümünüzü MetaQuotes ID aracılığıyla Metatrader uygulamasına bağlamanız gerekir. MetaQuotes ID, MT4/5 uygulamanızda Ayar >>> Sohbet ve Mesajlar bölümünde bulunur. Masaüstünde Araç>> Seçenek>> Bildirimler'de. Kimliği masaüstü sürümüne koyarsınız, bildirimleri etkinleştirirsiniz ve kullanıma hazırdır.
MT4 sürümünü BURADA deneyin
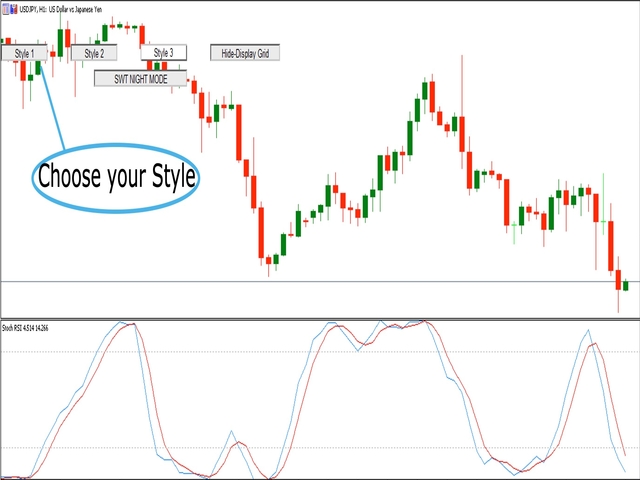
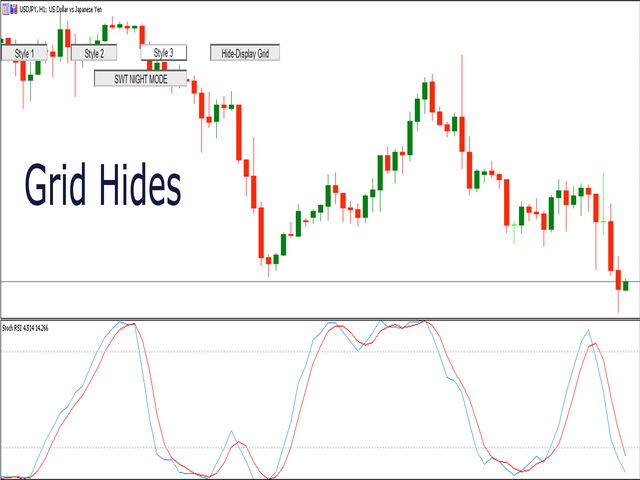
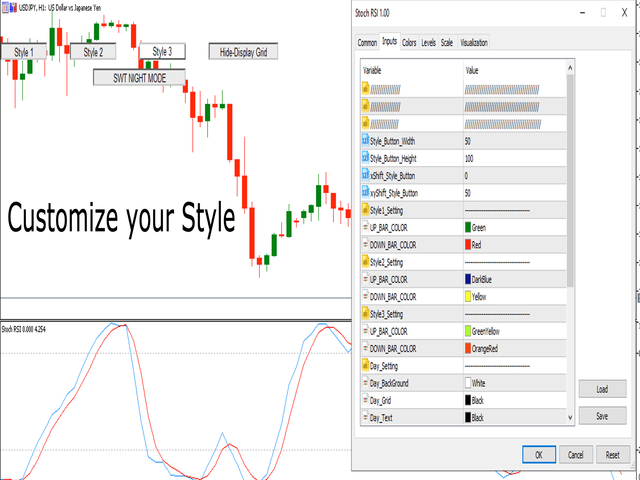
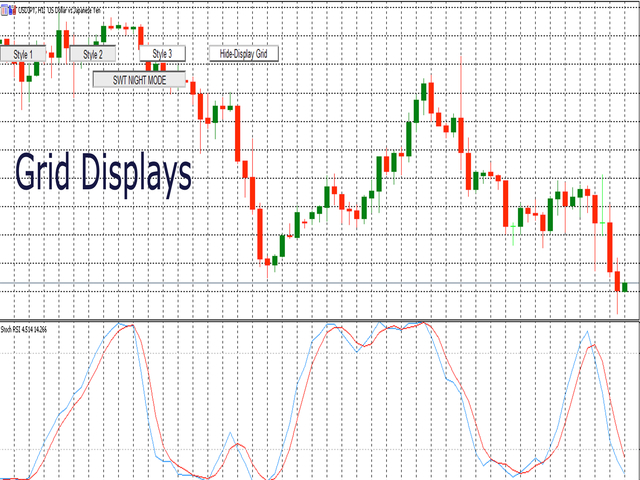
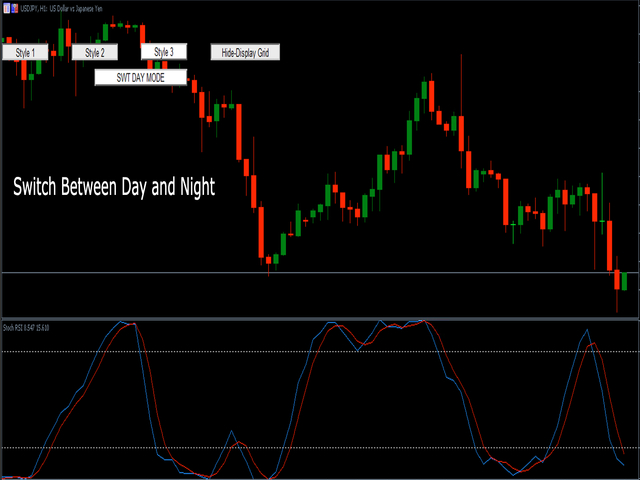
Çünkü stil önemlidir
Mumun rengini, arka planı açık veya koyu olarak değiştirmek ve ızgarayı koymak veya kaldırmak için her seferinde özelliklere tıklamanın ne kadar can sıkıcı olduğunu biliyorum. İşte tek tıklamayla çözüm:
- Tüccarların istediği mum stilini seçmek için üç özelleştirilebilir düğme.
- Gündüz ve Gece modu arasında geçiş yapmak için bir düğme.
- Grafiklerde Izgarayı göstermek veya gizlemek için bir düğme.
*****Ayarlarda, düğmelerin ekranda nerede görüntüleneceğini seçebilirsiniz*****
Ayrıca, diğer ürünlerime de göz atmayı unutmayın https://www.mql5.com/en/users/javimorales.fer/seller
Yazar
Javier Morales, Algorithms for Trading'in kurucusu.