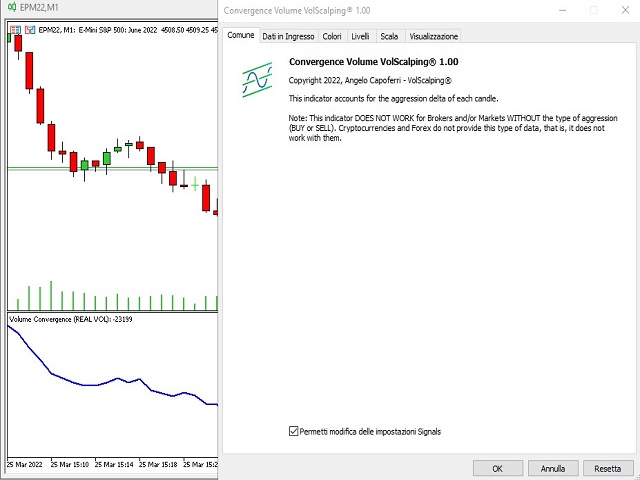
Volume Convergence
- Göstergeler
- Angelo Capoferri
- Sürüm: 1.0
- Etkinleştirmeler: 5
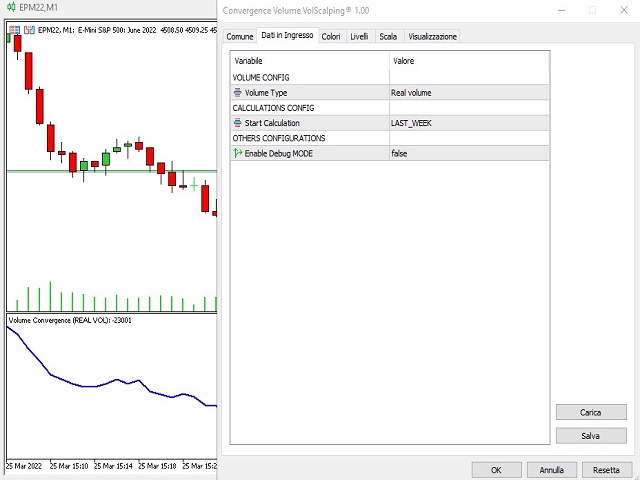
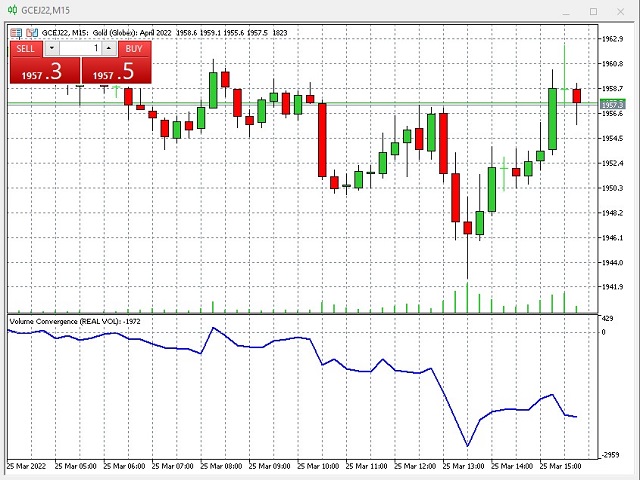
bu gösterge, gerçek hacmin fiyata karşı gücünü gösterir.
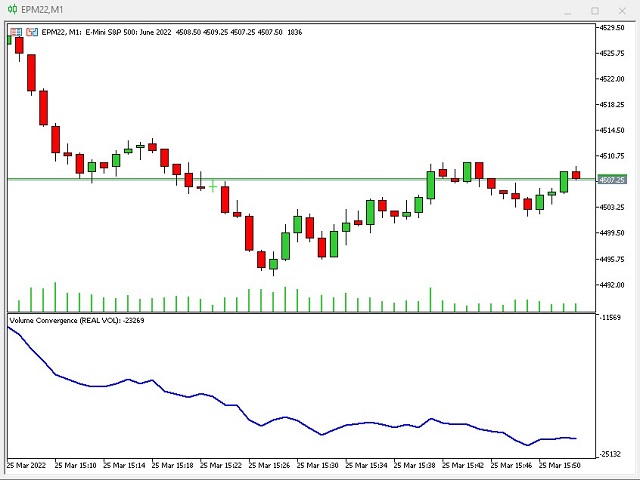
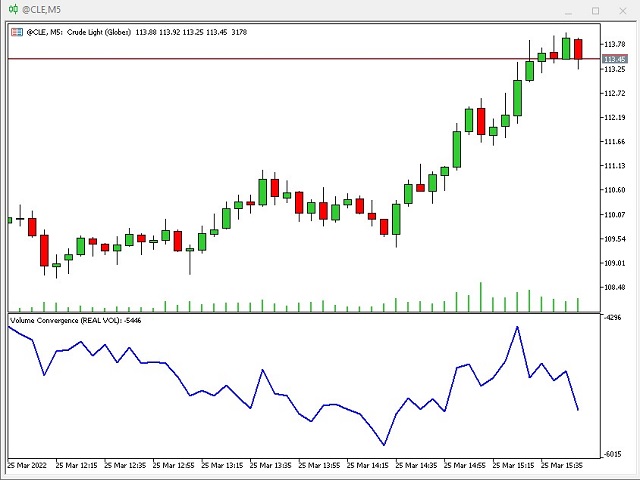
fiyat grafiği ve hacim trendi aynı trende sahipse, her şey normal demektir. gösterge fiyat tablosundan saparsa, geri dönüşün yakın olduğu anlamına gelir.
fiyat yükseldiğinde ve "hacim yakınsama" grafiği düştüğünde, paranın piyasadan çıktığı, satıcıların yükselişte olduğu ve fiyatın yakında düşmeye başlayacağı anlamına gelir.
tersine, fiyat grafiği düşerken "hacim yakınsama" grafiği yükseliyorsa, alıcılar aşağı yönlerden satın alıyor ve fiyatın tersine dönmesi gerekiyor.
gösterge, aynı yanlış sinyalleri filtrelemek için geçerli bir ticaret stratejisi ile birleştirilmelidir.
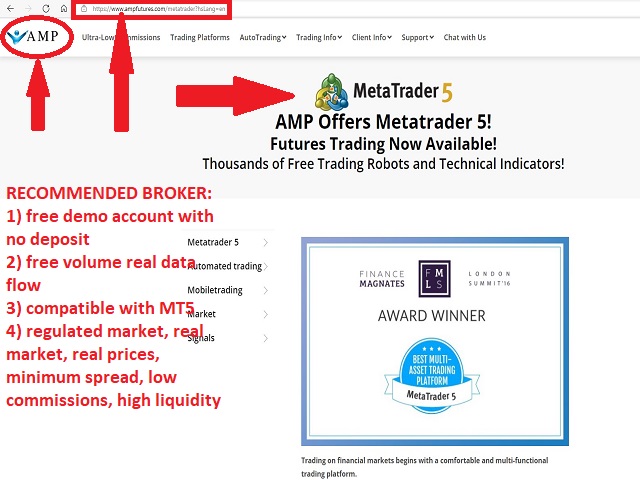
DİKKAT: gösterge YALNIZCA BID AND ASK'ta imzalanan sözleşmelerin bölünmesiyle gerçek hacimsel veri akışı sunan brokerlerle çalışır. CFD'ler, KRİPTO BİRİMLER VE FOREX sentetik, düzenlenmemiş piyasaya aittir, bu nedenle bu bilgilere sahip değildirler ve sonuç olarak gösterge çalışmaz.
Demo hesapta para yatırmaya gerek kalmadan gerçek veri akışı sunan mt5 uyumlu bir broker AMP FUTURE.