JS Daily
- Göstergeler
- Joan Serfati
- Sürüm: 2.2
- Etkinleştirmeler: 5
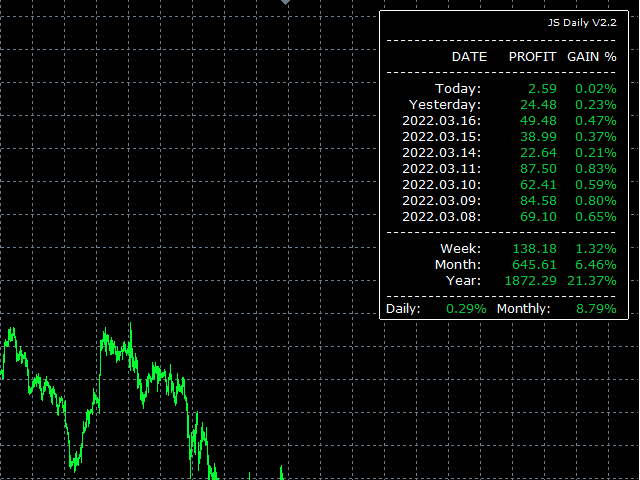
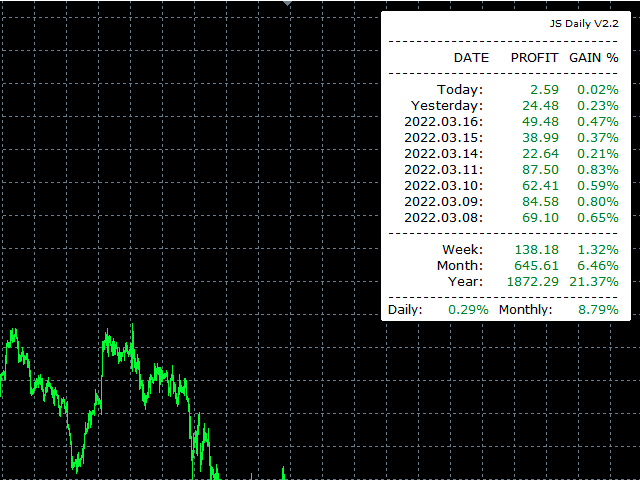
This indicator shows your daily profit for each chart. Please let me know in the comment section or via the MQL5 chat if you find any problem, or if you want any specific features for this indicator.
How to use:
- Attach the indicator to the chart you want to see your profit.
- You can change the color of the indicators. (Currently positive figures are green, and negative are red)
- You can display the profit for pair it is attached, or for the whole account (all the pairs)