Brilliant Price Action
- Göstergeler
- Mohamed Sabry
- Sürüm: 1.1
- Güncellendi: 1 Aralık 2021
- Etkinleştirmeler: 5
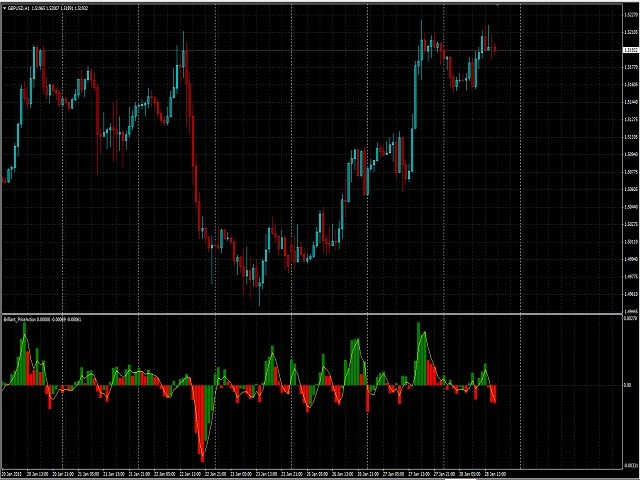
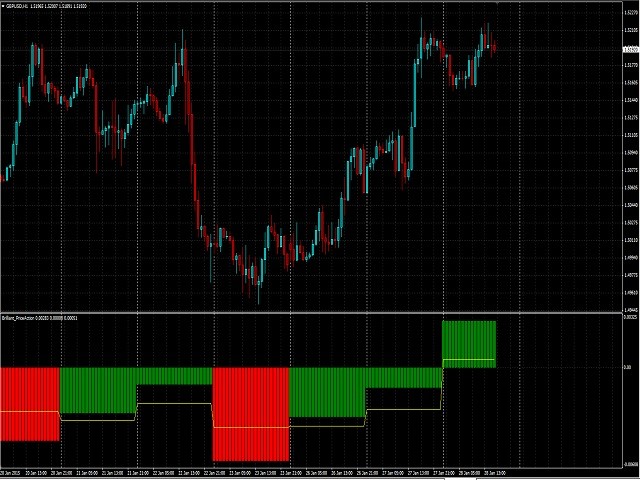
Brilliant Price Action
Brilliant Price Action Indicator is a leading Indicator that does not repaint.
It can be calculated on a time frame and represented on another time frame.
It can be used in trend identification from higher time frames OR for Entry on lower time frames.
Moving average modes are:
0 = Simple moving Average.
1 = Exponential moving Average.
2 = Smoothed moving Average.
3 = Linear Weighted moving Average.