Multi indicator divergence MT5
- Göstergeler
- Jan Flodin
- Sürüm: 2.1
- Güncellendi: 7 Ocak 2022
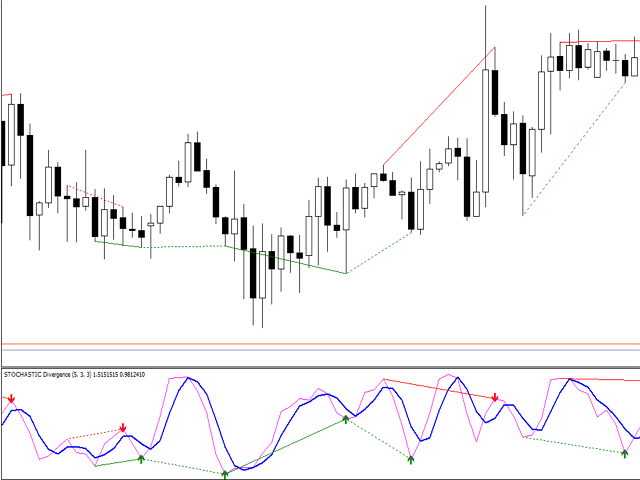
The indicator identifies when a divergence occurs between price and an indicator or oscillator. It identifies both regular and hidden divergences. Combined with your own rules and techniques, this indicator will allow you to create (or enhance) your own powerful system.
Features
- Can detect divergences for the following oscillators/indicators: MACD, OsMA, Stochastics, RSI, CCI, RVI, Awesome, ADX, ATR, OBV, Composite index, MFI and Momentum. Only one oscillator/indicator can be selected.
- Draws solid lines for regular/classical (potential reversal) divergences and dashed lines for hidden (trend continuation) divergences. The lines are drawn on the chart as well as in the indicator window.
Input parameters
Please find the description and explanation of the input parameters here.


great