Moving Average Force
- Göstergeler
- Lorenzo Marchesin
- Sürüm: 1.0
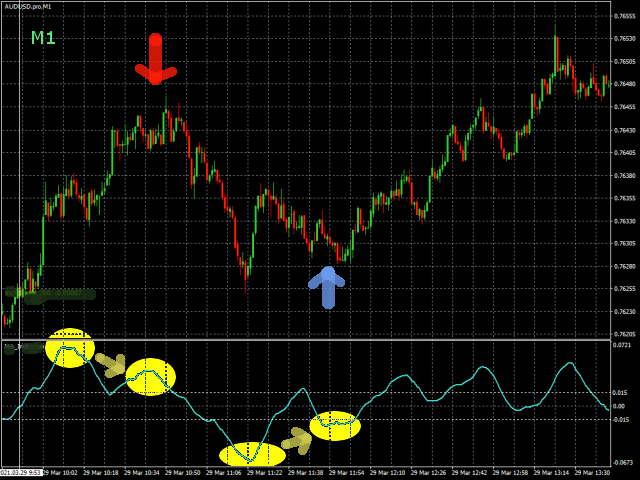
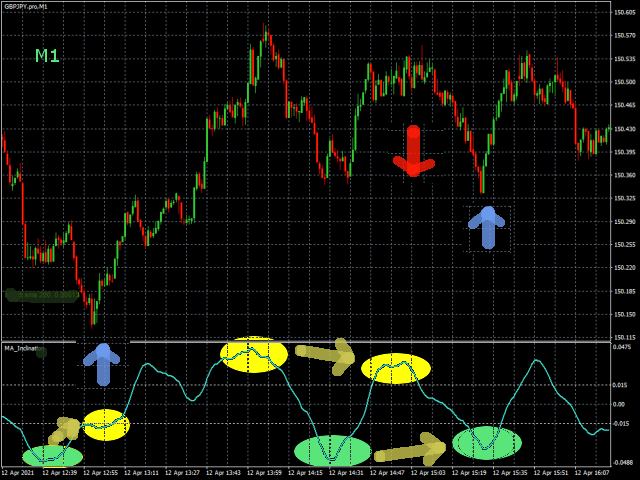
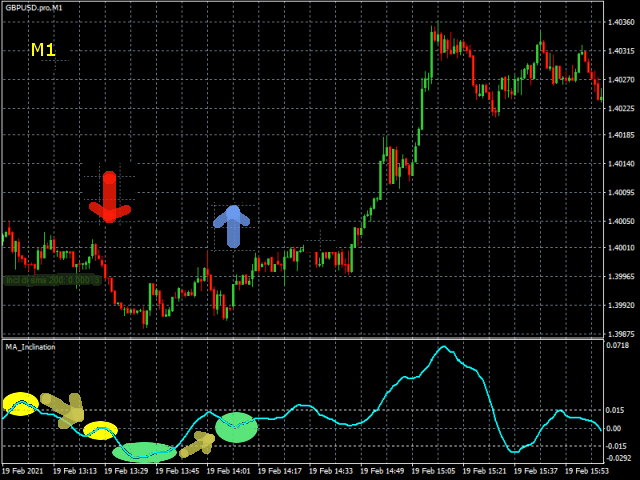
Scalp using the behavior of a short moving average, the indicator gives the slope and identifies the "hyper" moments.
Operational advice:
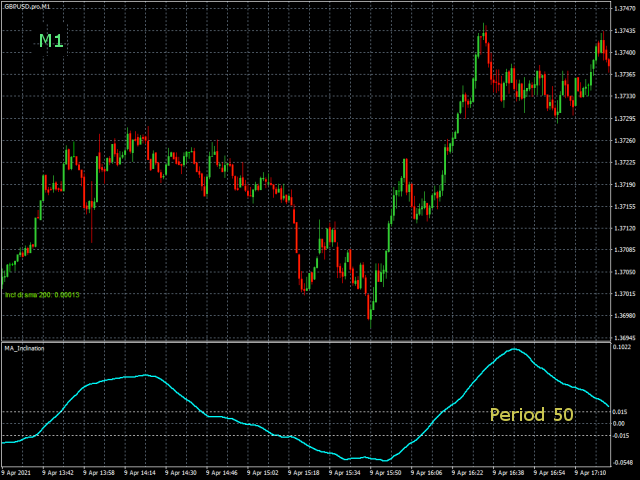
Use M1 chart.
Period 20: open buy after two rising lows; sell after two max downhill; avoid countertrend openings; when the line goes flat put a stop at the opening price. Avoid actions in low volatility timeslots.
When the curve that draws the min / max is very flat, it is better to postpone at least 15'.
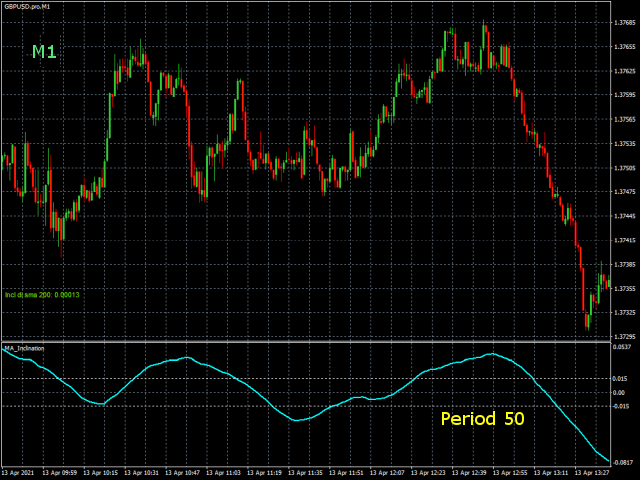
Period 50: matches the trend, when it is at the extremes it clearly indicates when trend starts and ends.Do not use during congestion times
To change period indicator right click over the line and choose "MA Inclination () property". Also you can customize line color and other properties.
Recommended pairs: EurUsd, GbpUsd, UsdJpy, AudUsd, NzdUsd, GbpJpy, GbpAud, GbpCzk, GbpHuf, GbpNzd, UsdSgd, ...


thanks for the work. when used correctly, it brings results. the main thing is to see where the trend is directed. and @ThorstenKock is a fraudster who gives everyone specially bad reviews. @ThorstenKock delete the terminal and forex