Box Weis Wave
- Göstergeler
- Thalles Nascimento De Carvalho
- Sürüm: 2.0
- Etkinleştirmeler: 5
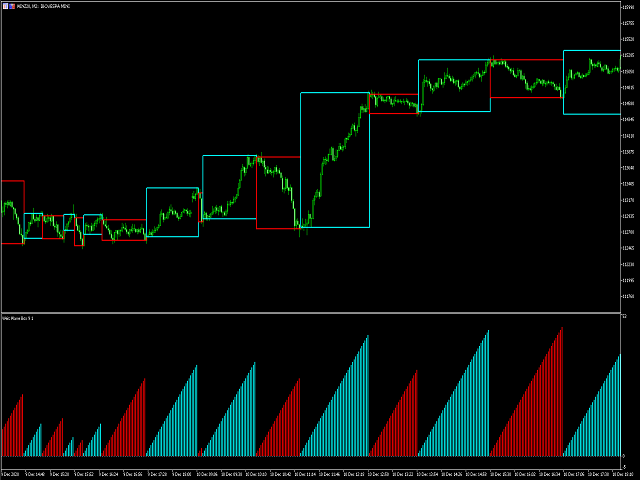
Eğer aktif bir trader iseniz ve finansal piyasaların hareketlerini etkili bir şekilde yorumlamak için bir yol arıyorsanız, Weis Wave Box'u keşfetmekten hoşlanacaksınız. Bu inanılmaz gösterge, hacim dalgalarının net ve doğru bir görsel analizini, buna karşılık gelen dönüş noktalarının çizimini sunmak için tasarlanmıştır. Beş özelleştirilebilir dönüş şekli ve diğer benzersiz özellikleriyle Weis Wave Box, deneyimli ve yeni başlayan traderlar için vazgeçilmez bir araç olarak öne çıkıyor.
Weis Wave Box'un dikkate değer bir özelliği, özel tick aralıklarında hacim dalgaları oluşturma yeteneğidir. Bu, ticaret tercihlerinize uyum sağlamanızı ve stratejileriniz için kesin ve ilgili sonuçlar elde etmenizi sağlar. Ayrıca, gösterge ayarlanabilir bir geçmiş sınırlama özelliğine sahiptir, böylece istediğiniz zaman dilimlerine odaklanabilir ve belirli trendleri analiz edebilirsiniz.
Weis Wave Box'un büyük avantajlarından biri, tick hacmi ve gerçek hacim hakkında bilgi sağlayabilme yeteneğidir. Bu iki hacim türü arasındaki farkı anlamak, piyasa analizi için önemlidir. Gösterge bu bilgileri net ve anlaşılır bir şekilde sunarak bilinçli ve stratejik kararlar almanıza yardımcı olur.
Weis Wave Box'un diğer bir önemli özelliği, dönüş şekillerine esneklik sağlamasıdır. Toplam hacim (totalVol), uzunluk (length), genişlik (width), barDVol ve lengthDVol gibi beş farklı seçenek sunarak analizinizi tercihlerinize ve belirli hedeflerinize göre özelleştirebilirsiniz. Bu esneklik, Weis Wave Box'u diğer teknik analiz araçlarından ayıran önemli bir özelliktir.
Hemen Weis Wave Box'u edinin ve finansal piyasalarda bir adım öne geçin. Kullanıcı dostu arayüzü ve güçlü özellikleriyle bu gösterge, trendleri, dönüş noktalarını ve karlı ticaret fırsatlarını belirlemenize yardımcı olacaktır. Stratejilerinizi geliştirme ve sonuçlarınızı yeni bir seviyeye taşıma fırsatını kaçırmayın.
* Swing Point Volume göstergesini aşağıdaki linkten satın alabilirsiniz:
https://www.mql5.com/tr/market/product/59094
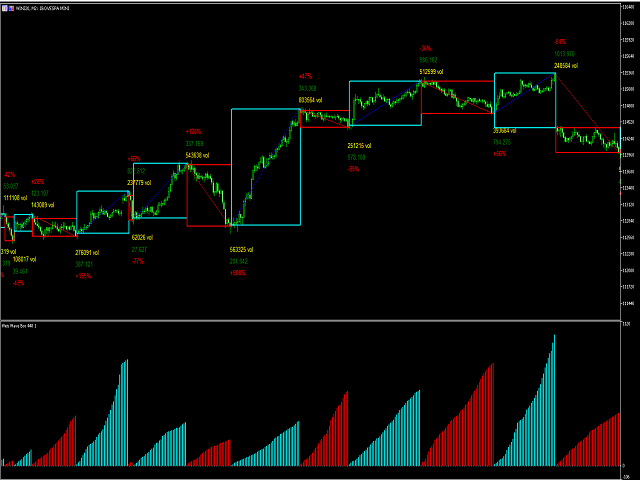


A Very good product.The Box format is very nice.The developer has said there are 5 options to print text near the boxes.The description pictures also show the Wave Distance printed next to the Boxes.However,I am not able to see any text printed near the boxes and I have tried all the options.Maybe something was missed in the update.I have sent a note to the developer and I am hoping that he would fix it soon to restore the full functionality as described.