• Genel bakış
  • İncelemeler
  • Yorumlar
  • Yenilikler

Imagic03

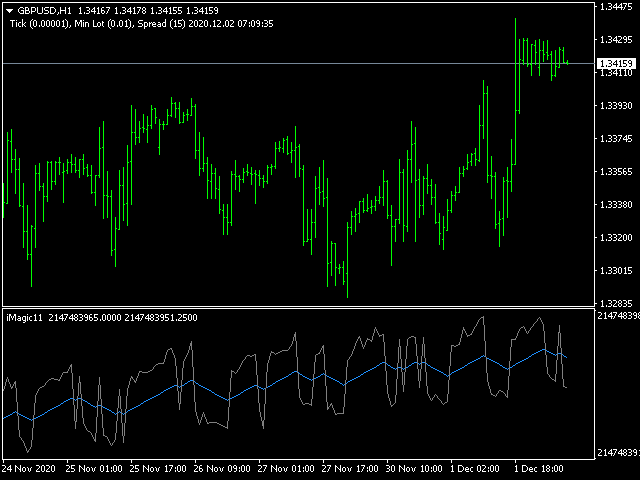
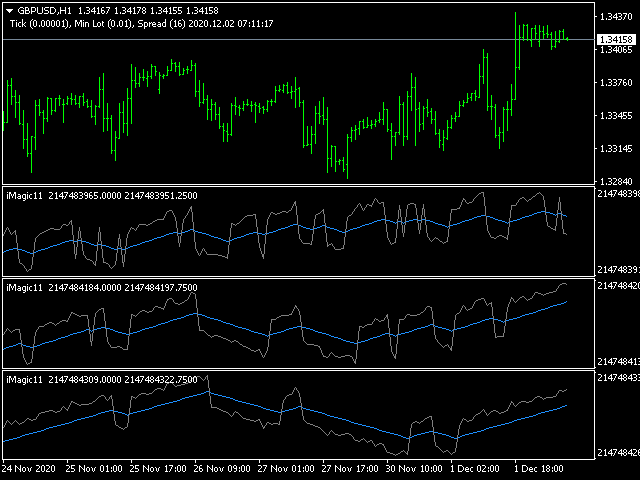
The indicator shows the trend change and how the market is changing. When calculating, many parameters are weighed. Therefore, divergence between the chart and the indicator is possible.

Input parameters:

IndicatorPeriod: several calculation periods (small - small period, medium - medium period, long - long period).

You can trade by divergence, analyzed on the resistance and support lines (and other types of graphical analysis), as part of other indicators.

Tags: Stochastic, Trend.

Önerilen ürünler
The indicator detects and displays Shark harmonic pattern (see the screenshot). The pattern is plotted by the extreme values of the ZigZag indicator (included in the resources, no need to install). After detecting the pattern, the indicator notifies of that by a pop-up window, a mobile notification and an email. The indicator highlights the process of the pattern formation and not just the complete pattern. In the former case, it is displayed in the contour triangles. After the pattern is comple
Take Your Trading Experience To the   Next Level ! and get the Magic Bollinger Bands Diamond Indicator MagicBB Diamond Indicator is MT4 Indicator which can suggest signals for you while on MT4. The indicator is created with Non Lag Bollinger Bands strategy for the best entries. This is a system to target 10 to 20 pips per trade. The indicator will give alerts on the pair where signal was originated including timeframe. If signal sent, you then enter your trade and set the recommended pips target
The indicator detects and displays 3 Drives harmonic pattern (see the screenshot). The pattern is plotted by the extreme values of the ZigZag indicator (included in the resources, no need to install). After detecting the pattern, the indicator notifies of that by a pop-up window, a mobile notification and an email. The indicator highlights the process of the pattern formation and not just the complete pattern. In the former case, it is displayed in the contour triangles. After the pattern is com
Trend Ray
Andriy Sydoruk
The indicator shows the potential trend direction by cyclical-wave dependence. Thus, all the rays of the intersection will be optimal rays, in the direction of which the price is expected to move, taking into account the indicator period. Rays can be used as a direction for potential market movement. But we must not forget that the approach must be comprehensive, the indicator signals require additional information to enter the market.
TrendTrade
Alexey Surkov
5 (2)
The Trend Trade indicator displays assumed turning points of the price on the chart in the direction of the trend after correction. It is based on data of the Prise Reversal oscillator with the period 6 and indicators which characterize strength and availability of the trend. When the value of Prise Reversal is in overbought or oversold area (area size is set by a user), and the current trend is confirmed, the Trend Trade indicator draws an arrow pointed to the further assumed price movement.
"Adjustable Fractals" - is an advanced version of fractal indicator, very useful trading tool! As we know   Standard fractals mt4 indicator does not have settings at all   - this is very inconvenient for traders Adjustable Fractals has resolved that issue - it has all necessary settings: Adjustable period   of indicator (recommended values - above 7) Adjustable distance   from Highs/Lows of price Adjustable design   af fractal arrows // More great Expert Advisors and Indicators are available he
Forex scalping indicator that does not redraw its arrows. It works best on M5, M15, M30, H1 timeframes. The default settings are for M5 timeframe. The picture below shows an example of working on the H1 chart with the "period=0.35" parameter value. You can download the demo version and test it yourself. Now we use the signals of this indicator in almost all of our scalping strategies. According to our calculations, the accuracy of its signals is about 95% depending on the timeframe. The indicato
The indicator allows you to trade binary options. The recommended time frame is М1 and the expiration time is 1,2,3 minutes. The indicator suitable for auto and manual trading. A possible signal is specified as a arrows above/under a candle. You should wait until the candle closes! Arrows are not re-painted Trade sessions: TOKYO section (Half-end) Currency pairs: USD/JPY Working time frame: M1 Expiration time: 1,2,3 minutes. The indicator also shows good results when using the martingale strateg
FREE
ADX Pointer is an indicator which is based on "Average Directional Index" and draws three numbers in chart window depending on the value of ADX. In ADX Pointer you can set "ADX_Period" which is of course period of Average Directional Index and you can also set 3 levels. When ADX value exceed first level ("ADX_Level1") in chart window appears number "1", when ADX exceed second level ("ADX_Level2") appears "2" and when ADX exceed third level ("ADX_Level3") appears "3". Simple. ADX Pointer works on
Owl smart levels
Sergey Ermolov
4.63 (54)
MT5 versiyonu  |  FAQ Owl Smart Levels Indicator ,   Bill Williams'ın gelişmiş fraktalları , piyasanın doğru dalga yapısını oluşturan Valable ZigZag ve kesin giriş seviyelerini gösteren   Fibonacci seviyeleri   gibi popüler piyasa analiz araçlarını içeren tek gösterge içinde eksiksiz bir ticaret sistemidir. pazara ve kar elde edilecek yerlere. Stratejinin ayrıntılı açıklaması Gösterge ile çalışma talimatı Baykuş Yardımcısı ticaretinde Danışman Yardımcısı Kullanıcıların özel sohbeti -> Satın ald
TrendPlus
Sivakumar Subbaiya
4.21 (14)
Trend Plus   Trendplus  Indicator   Time Frame: Suitable for any time frame.  Purpose: Trend Prediction. Blue and red candle indicate the buy and sell call respectively. Buy: When the blue candle is formed buy call is initiated. close the buy trades when the next red candle will formed.   Sell: When the Red candle is formed Sell call is initiated. close the Sell trades when the next blue candle will formed.   Happy trade!!
FREE
COG LR Osc AM
Andriy Matviyevs'kyy
The presented indicator allows you to determine potential entry points into the market and set protective orders at reasonable levels. This product can be useful for both beginners and experienced traders. The indicator is based on calculation methods proven by time and practicing traders. The indicator is calculated in two stages: At the first stage, linear regression (LR) of the selected price type is determined for a given number of chart periods. At the second stage, the obtained data is p
Fractal Zig Zag
Mikhail Nazarenko
5 (1)
A   professional version of the ZigZag indicator for visualizing the structure of price movements by fractals. Fractal ZigZag fixes the flaws of the standard version of the ZigZag indicator MT4. It uses Price action and a unique filtering algorithm to determine fractals. Suitable for all types of trading. Ideal for trading according to the WM pattern "Sniper" strategy !!! Features Marks the place of price reversal during the formation of a new fractal with specified parameters. Suitable for
VR Cub
Vladimir Pastushak
VR Cub , yüksek kaliteli giriş noktaları elde etmenin bir göstergesidir. Gösterge, matematiksel hesaplamaları kolaylaştırmak ve bir pozisyona giriş noktalarının aranmasını basitleştirmek için geliştirildi. Göstergenin yazıldığı ticaret stratejisi uzun yıllardan beri etkinliğini kanıtlamaktadır. Ticaret stratejisinin basitliği, acemi yatırımcıların bile başarılı bir şekilde ticaret yapmasına olanak tanıyan büyük avantajıdır. VR Cub, pozisyon açılış noktalarını ve Kâr Al ve Zararı Durdur hedef sev
This indicator is based on the Bollinger Bands on one or more timeframes and on any Currency Cross Pair. The indicator generates an alert message when it detects a buy or sell signal. It also draws a vertical bar on the price chart: green for buy or red for sell, white if flat. Alert messages and Vertical bars for BUY or SELL, are generated when the Bollinger Bands is consistent for all chosen timeframes else a FLAT signal is generated. In addition, the Multi TimeFrames Bollinger Bands Signals i
Mirror
Stanislav Korotky
This indicator predicts rate changes based on the chart display principle. It uses the idea that the price fluctuations consist of "action" and "reaction" phases, and the "reaction" is comparable and similar to the "action", so mirroring can be used to predict it. The indicator has three parameters: predict - the number of bars for prediction (24 by default); depth - the number of past bars that will be used as mirror points; for all depth mirroring points an MA is calculated and drawn on the ch
Wise Men Indicator demo
Bohdan Kasyanenko
3.67 (3)
The indicator displays signals according to the strategy of Bill Williams on the chart. Demo version of the indicator has the same features as the paid, except that it can work only on a demo account . Signal "First Wise Man" is formed when there is a divergent bar with angulation.  Bullish divergent bar - with lower minimum and closing price in the upper half. Bearish divergent bar - higher maximum and the closing price at the bottom half. Angulation is formed when all three lines of Alligat
FREE
Sto Signal AM
Andriy Matviyevs'kyy
This indicator displays Stochastic osc signals on the price chart and allows the user to receive notifications of such signals. The Stochastic indicator is a classic and proven indicator of the technical analysis of the markets. Despite its age, it is still relevant today. Depending on the settings, the indicator allows you to work effectively on various TFs and any markets. Signals are given on fully formed bars and are not redrawn. Custom Parameters: Stochastic_Price (0-1) - The applied pric
FREE
This indicator can be used to show and evaluate the trailing stop algorithm "Trailing Stop with Inside Bars" that was proposed by the famous German trader and author Michael Voigt ("Das grosse Buch der Markttechnik") to capture robust gains when trading strong price moves. The trailing stop price is shown as a red line. You can start the trailing stop anywhere on your chart (bars or candles) by setting the "initialBarDateTime" input parameter to the open time of an arbitrary candle You can speci
FREE
PABT Pattern Indicator - it's classical system one of the signal patterns. Indicator logic - the Hi & Lo of the bar is fully within the range of the preceding bar, look to trade them as pullback in trend. In the way if indicator found PABT pattern it's drawing two lines and arrow what showing trend way.  - First line - it's entry point and drawing at: 1. On the high of signal bar or on middle of the signal bar (depending from indicator mode) for buy; 2. On the low of signal bar or on middle of t
Trend PA
Mikhail Nazarenko
5 (3)
The Trend PA indicator uses   Price Action   and its own filtering algorithm to determine the trend. This approach helps to accurately determine entry points and the current trend on any timeframe. The indicator uses its own algorithm for analyzing price changes and Price Action. Which gives you the advantage of recognizing, without delay, a new nascent trend with fewer false positives. Trend filtering conditions can be selected in the settings individually for your trading style. The indicator
Infinity Trend Pro
Yaroslav Varankin
1 (1)
This is a trend indicator without redrawing Developed instead of the binary options strategy (by the color of the Martingale candlestick) Also works well in forex trading When to open trades (binary options) A signal will appear in the place with a candle signaling the current candle It is recommended to open a deal for one candle of the current timeframe M1 and M5 When a blue dot appears, open a deal up When a red dot appears, open a trade down. How to open trades on Forex. When a signal is rec
FX Flow
Eva Stella Conti
FX Flow   indicator can be used as an anticipator of the next trend, preferably confirmed by Price Action or another oscillator (RSi, Stochastic ..). It takes the money flows of the major currencies USD EUR GBP AUD NZD CAD CHF JPY into account, and processes them. Excellent tool for indices, but also for correlations between currencies. Works on each timeframes.  Blue line: Bull market Yellow line: Bear market Note : if the indicator opens the window, but does not draw lines, load the histo
ZhiBiCCI MT4
Qiuyang Zheng
5 (1)
[ZhiBiCCI] indicators are suitable for all cycle use, and are also suitable for all market varieties. [ZhiBiCCI] Green solid line is a reversal of bullish divergence. The green dotted line is a classic bullish divergence. [ZhiBiCCI] The solid line to the red is a reverse bearish divergence. The red dotted line is a classical bearish divergence. [ZhiBiCCI] can be set in the parameters (Alert, Send mail, Send notification), set to (true) to send instant signals to the alarm window, email, in
MACDivergence MTF
Pavel Zamoshnikov
4.29 (7)
Advanced ideas of the popular MACD indicator: It detects and displays classic and reverse divergences (three methods of detecting divergences). It uses different color to highlight an uptrend and a downtrend. Two methods of determining a trend: а) MACD crosses the 0 level (classic signal); б) MACD crosses its own average (early signal). This is a multi-timeframe indicator: it can display MACD data from other timeframes. Two methods of drawing: classic histogram and line. It generates sound and v
KDJ Index 4   交易实用必备工具指标 波浪自动计算指标,通道趋势交易 完美的趋势-波浪自动计算通道计算 , MT4版本 完美的趋势-波浪自动计算通道计算 , MT5版本 本地跟单复制交易 Easy And Fast Copy , MT4版本 Easy And Fast Copy , MT5版本 本地跟单复制交易 模拟试用 Easy And Fast Copy , MT4 模拟账号运行 Easy And Fast Copy , MT5 模拟账号运行 "Cooperative QQ:556024  "  "Cooperation wechat:556024"  "Cooperative email:556024@qq.com" 强烈推荐趋势指标, 波浪的标准自动计算   和   波浪的标准自动计算MT5版本     KDJ指标又叫 随机指标 ,是一种相当新颖、实用的技术分析指标,它起先用于期货市场的分析,后被广泛用于股市的中短期趋势分析,是期货和股票市场上最常用的技术分析工具。 随机指标KDJ一般是用于股票分析的统计体系,根据统计学原理,通过一个特定的周期(常为9日、9周等
This indicator is the undisputed leader among the indicators. And for this statement there is a good reason. The indicator builds a very high quality channel in which it generates signals to enter! What is the ideal strategy for the trader, since the trader always hesitates when choosing a strategy for the job. That is, this indicator will allow you to solve the dilemma of choosing a job by trend or to the channel, since it combines these two basic concepts. Working with the indicator is very
Based on MACD indicator waves with standard parameters Applies Fibonacci levels to the last two MACD waves, positive and negative respectively, if at the moment the MACD indicator runs out of negative Wave - the color is green, if at the moment the MACD indicator runs out of positive Wave - the color is red. The Wave termination criterion is two ticks with a different MACD sign. Applies trend lines on the last four MACD Waves. Works well with the expert Figures MACD   https://www.mql5.com/ru/mar
LordAutoFibonnaci
Igor Pereira Calil
5 (1)
Lord Auto Fibonnaci is a free indicator for Meta Trader, in order to show the most famous chart in the financial market known as "Fibonnaci". As we can see in the images below, the fibonnaci table will automatically analyze the graph for you, with trend factors through percentage, almost infallible use, you can always work when the percentage is low or high, start shopping and sales on time, great for analyzing entries! In the images below we can see an example in gold in H4, where we are a
FREE
Download the free version   here. Divergence Divergence refers to when the price of a currency pair moves in one direction while the trend indicator is moving in the opposite direction. With divergence, there can be positive and negative signals. Divergences in Forex trading are quite common signals of technical analysis. These are basic early Forex signals indicating the trend reversal and filter false signals. Application of this indicator It is usually not easy to detect divergences by the t
Bu ürünün alıcıları ayrıca şunları da satın alıyor
Gann Made Easy
Oleg Rodin
4.92 (66)
Gann Made Easy , bay teorisini kullanarak ticaretin en iyi ilkelerine dayanan, profesyonel ve kullanımı kolay bir Forex ticaret sistemidir. WD Gann. Gösterge, Zararı Durdur ve Kâr Al Seviyeleri dahil olmak üzere doğru SATIN AL ve SAT sinyalleri sağlar. PUSH bildirimlerini kullanarak hareket halindeyken bile işlem yapabilirsiniz. Lütfen satın aldıktan sonra benimle iletişime geçin! Alım satım ipuçlarımı ve harika bonus göstergelerini ücretsiz olarak sizinle paylaşacağım! Muhtemelen Gann ticaret y
ŞU ANDA %26 INDIRIMLI Yeni Başlayanlar veya Uzman Tüccarlar için En İyi Çözüm! Bu Gösterge benzersiz, yüksek kaliteli ve uygun fiyatlı bir ticaret aracıdır çünkü bir dizi tescilli özellik ve yeni bir formül ekledik. Sadece BİR grafik ile 28 Forex çifti için Döviz Gücünü okuyabilirsiniz! Yeni bir trendin veya scalping fırsatının tam tetik noktasını belirleyebildiğiniz için ticaretinizin nasıl gelişeceğini hayal edin? Kullanım kılavuzu: buraya tıklayın Bu ilk olan, orijinal! Değersiz bir
TPSpro RFI Levels
Roman Podpora
4.87 (15)
Reversal First Impulse levels (RFI)    INSTRUCTIONS        RUS       -       ENG              R ecommended to use with an indicator   -   TREND PRO -  Version MT5 A key element in trading is zones or levels from which decisions to buy or sell a trading instrument are made. Despite attempts by major players to conceal their presence in the market, they inevitably leave traces. Our task was to learn how to identify these traces and interpret them correctly. Main functions: Displaying active zones
Break and Retest
Mohamed Hassan
4.64 (11)
New update to V.4 where  Break & Retest automatically draws the take profit & stop loss levels and you also have more signals per day! ‍You can visually backtest Break & Retest to see how it behaved in the past!     Manual guide:   Click here $65  for only 2  copies left! Next price is $120 .  This Indicator only places quality trades when the market is really in your favor with a clear break and retest. Patience is key with this price action strategy! If you want more alert
Scalper Inside PRO
Alexey Minkov
4.75 (57)
An exclusive indicator that utilizes an innovative algorithm to swiftly and accurately determine the market trend. The indicator automatically calculates opening, closing, and profit levels, providing detailed trading statistics. With these features, you can choose the most appropriate trading instrument for the current market conditions. Additionally, you can easily integrate your own arrow indicators into Scalper Inside Pro to quickly evaluate their statistics and profitability. Scalper Inside
TPSproTREND PrO
Roman Podpora
4.76 (17)
TPSpro TRENDPRO  - is a trend indicator that automatically analyzes the market and provides information about the trend and each of its changes, as well as giving signals for entering trades without redrawing! The indicator uses each candle, analyzing them separately. referring to different impulses - up or down impulse. Exact entry points into transactions for currencies, crypto, metals, stocks, indices!  -  Version MT5               DETAILED DESCRIPTION                R ecommended to use with
Gold Stuff
Vasiliy Strukov
4.89 (255)
Gold Stuff, özellikle altın için tasarlanmış bir trend göstergesidir ve herhangi bir finansal enstrümanda da kullanılabilir. Gösterge yeniden çizilmez ve gecikmez. Önerilen zaman dilimi H1. Bu göstergede tam otomatik Uzman Danışman EA Gold Stuff çalışır. Profilimde bulabilirsiniz. Ayarları ve kişisel bir bonusu almak için satın alma işleminden hemen sonra benimle iletişime geçin!   AYARLAR Ok Çiz - açık kapalı. grafik üzerinde oklar çizmek. Uyarılar - sesli uyarılar kapalı. E-posta bild
Advanced Supply Demand
Bernhard Schweigert
4.92 (311)
CURRENTLY 26% OFF !! Best Solution for any Newbie or Expert Trader! This indicator is a unique, high quality and affordable trading tool because we have incorporated a number of proprietary features and a new formula. With this update, you will be able to show double timeframe zones. You will not only be able to show a higher TF but to show both, the chart TF, PLUS the higher TF: SHOWING NESTED ZONES. All Supply Demand traders will love it. :) Important Information Revealed Maximize the potenti
Özel MT4 göstergemizle başarılı forex ticaretinin sırrını keşfedin! Forex piyasasında nasıl başarıya ulaşacağınızı hiç merak ettiniz, riski en aza indirirken sürekli olarak kar kazandınız mı? İşte aradığınız cevap! Ticaret yaklaşımınızda devrim yaratacak tescilli MT4 göstergimizi tanıtmamıza izin verin. Benzersiz çok yönlülük Göstergemiz, Renko ve RangeBar Mum oluşumlarını tercih eden kullanıcılar için özel olarak tasarlanmıştır. Bu grafik türlerinin birçok deneyimli tüccar tarafından ter
Öncelikle, bu Ticaret Aracının Non-Repainting, Non-Redrawing ve Non-Lagging Gösterge olduğunu vurgulamakta fayda var, bu da onu profesyonel ticaret için ideal hale getiriyor. Çevrimiçi kurs, kullanıcı kılavuzu ve demo. Akıllı Fiyat Hareketi Kavramları Göstergesi, hem yeni hem de deneyimli tüccarlar için çok güçlü bir araçtır. İleri ticaret fikirlerini, Inner Circle Trader Analizi ve Smart Money Concepts Ticaret Stratejileri gibi 20'den fazla kullanışlı göstergeyi bir araya getirerek bir araya g
Atomic Analyst
Issam Kassas
5 (3)
Öncelikle belirtmek gerekir ki bu Ticaret Göstergesi Yeniden Çizim Yapmaz, Gecikmez ve Gecikme Göstermez, bu da hem manuel hem de robot ticareti için ideal hale getirir. Kullanıcı kılavuzu: ayarlar, girişler ve strateji. Atom Analisti, Piyasada Daha İyi Bir Avantaj Bulmak İçin Fiyatın Gücünü ve Momentumunu Kullanan PA Fiyat Hareketi Göstergesidir. Gürültüleri ve Yanlış Sinyalleri Kaldırmaya ve Ticaret Potansiyelini Artırmaya Yardımcı Olan Gelişmiş Filtrelerle Donatılmıştır. Birden fazla katma
Trend Screener
STE S.S.COMPANY
4.83 (88)
Trend Göstergesi, Trend Alım Satım ve Filtreleme için Çığır Açan Benzersiz Çözüm, Tüm Önemli Trend Özellikleriyle Tek Bir Araç İçinde Yerleştirildi! Forex, emtialar, kripto para birimleri, endeksler ve hisse senetleri gibi tüm sembollerde/araçlarda kullanılabilen %100 yeniden boyamayan çoklu zaman çerçevesi ve Çoklu para birimi göstergesidir. Trend Screener, grafikte noktalarla ok trend sinyalleri sağlayan etkili bir trend trend göstergesidir. Trend analizörü göstergesinde bulunan özellikler: 1.
Fiyat tersine döndükçe ve geri çekildikçe piyasa yapısından elde edilen kâr değişir. Piyasa yapısını tersine çevirme uyarısı göstergesi, bir trendin veya fiyat hareketinin ne zaman tükenmeye yaklaştığını ve tersine dönmeye hazır olduğunu tanımlar. Genellikle bir geri dönüş veya büyük bir geri çekilme meydana gelmek üzereyken meydana gelen piyasa yapısındaki değişiklikler konusunda sizi uyarır. Gösterge, olası bir tükenme noktasının yakınında her yeni yüksek veya düşük oluştuğunda, başlangıçta
74% discount for the next 10 buyers (original price $605): 1 left Get a 50% bonus by buying (or even renting) any of our products. After buying (or renting), send a message for more information. 3 Indicators in 1 indicator Strategy based on price action Made specifically for the best forex currency pairs Can be used in the best time frame of the market at a very reasonable price This indicator is basically 3 different indicatos . But we have combined these 3 indicators in 1 indicator so th
Tanıtım       Kuantum Trend Keskin Nişancı Göstergesi   , trend tersine dönmeleri belirleme ve ticaret yapma şeklinizi değiştiren çığır açan MQL5 Göstergesi! 13 yılı aşkın ticaret tecrübesine sahip deneyimli tüccarlardan oluşan bir ekip tarafından geliştirilmiştir.       Kuantum Trend Keskin Nişancı Göstergesi       trend dönüşlerini son derece yüksek doğrulukla belirlemenin yenilikçi yolu ile ticaret yolculuğunuzu yeni zirvelere taşımak için tasarlanmıştır. ***Kuantum Trend Keskin Nişancı Gö
The indicator of a Professional Trader is an arrow indicator for predicting the direction of price movement. I have been working on this indicator since 2014. You can use this indicator as your main indicator, use its entry signals, and use it as your only indicator to find entry points. About the product: Recommended TF [H4-D1-W1]   . The indicator predicts the direction of the next candle. Fits a variety of tools; Flexibility in settings for different instruments and intervals through the
FX Power MT4 NG
Daniel Stein
5 (10)
Sabah Brifingimiz burada mql5 ve on Telegram! FX Power MT4 NG , uzun zamandır çok popüler olan döviz gücü ölçerimiz FX Power'ın yeni neslidir. Peki bu yeni nesil güç ölçer ne sunuyor? Orijinal FX Power hakkında sevdiğiniz her şey PLUS GOLD/XAU güç analizi Daha da hassas hesaplama sonuçları Ayrı ayrı yapılandırılabilir analiz dönemleri Daha da iyi performans için özelleştirilebilir hesaplama limiti Özel çokluDaha fazlasını görmek isteyenler için örnek ayarlar Her grafikte en sevdiğiniz renkler i
Quantum Breakout Indicator PRO
Bogdan Ion Puscasu
4.96 (26)
Tanıtım       Quantum Breakout PRO   , Breakout Bölgeleri ile ticaret yapma şeklinizi değiştiren çığır açan MQL5 Göstergesi! 13 yılı aşkın ticaret deneyimine sahip deneyimli tüccarlardan oluşan bir ekip tarafından geliştirilen   Quantum Breakout PRO   , yenilikçi ve dinamik koparma bölgesi stratejisiyle ticaret yolculuğunuzu yeni zirvelere taşımak için tasarlanmıştır. Kuantum Breakout Göstergesi, size 5 kar hedefi bölgesi ile kırılma bölgelerinde sinyal okları ve kırılma kutusuna dayalı ol
PRO Renko Sistemi, RENKO grafikleri ticareti için özel olarak tasarlanmış son derece hassas bir ticaret sistemidir. Bu, çeşitli ticaret araçlarına uygulanabilen evrensel bir sistemdir. Sistemi etkin piyasa sana doğru ters sinyallerine erişim hakkı denilen ses nötralize eder. Göstergenin kullanımı çok kolaydır ve sinyal üretiminden sorumlu tek bir parametreye sahiptir. Aracı, seçtiğiniz herhangi bir ticaret aracına ve renko çubuğunun boyutuna kolayca uyarlayabilirsiniz. Yazılımımla karlı b
TrendMaestro
Stefano Frisetti
5 (2)
note: this indicator is for METATRADER4, if you want the version for METATRADER5 this is the link:  https://www.mql5.com/it/market/product/108106 TRENDMAESTRO ver 2.4 TRENDMAESTRO recognizes a new TREND in the bud, he never makes mistakes. The certainty of identifying a new TREND is priceless. DESCRIPTION TRENDMAESTRO identifies a new TREND in the bud, this indicator examines the volatility, volumes and momentum to identify the moment in which there is an explosion of one or more of these data a
TrendDecoder Premium
Christophe Pa Trouillas
5 (4)
Aralıkları ve bir sonraki olası hamleleri belirleyin   |  Trendlerin en erken sinyallerini ve gücünü alın   |  Geri dönüşten önce net çıkışlar alın   |  Fiyatın test edeceği Fibo seviyelerini tespit edin Gecikmesiz, takip edilmeyen gösterge - manuel ve otomatik ticaret için ideal - tüm varlıklar ve tüm zaman birimleri için uygun Sınırlı süreli teklif >>   %50 İNDİRİM Satın aldıktan sonra, kişiselleştirilmiş ayarlar için bu kanaldan benimle iletişime geçin . MT5   sürümü:   buraya tıklayın Tam y
Shepherd Harmonic Pattern
Abdullah Alrai
4.68 (59)
Bu gösterge, manuel ve otomatik yöntemlerle çizilen harmonik desenleri algılar. Kullanım kılavuzuna şu bağlantıdan erişebilirsiniz: İncelemenizi ekleyin ve ürünü almak için bizimle iletişime geçin. Bu ürünü mt4'te denemek için ücretsiz bir sürümü vardır. Gartley ve Nenstar desenlerini algılamak için kullanabilirsiniz: https://www.mql5.com/en/market/product/30181 Tam MT4 sürümünü şuradan satın alabilirsiniz: https://www.mql5.com/en/market/product/15212 Notlar Gösterge kontrol paneline sahiptir ve
ICT, SMC, SMART MONEY CONCEPTS, SMART MONEY, Smart Money Concept, Support and Resistance, Trend Analysis, Price Action, Market Structure, Order Blocks, BOS/CHoCH,   Breaker Blocks ,  Momentum Shift,   Supply&Demand Zone/Order Blocks , Strong Imbalance, HH/LL/HL/LH,    Fair Value Gap, FVG,  Premium  &   Discount   Zones, Fibonacci Retracement, OTE, Buy Side Liquidity, Sell Side Liquidity, BSL/SSL Taken, Equal Highs & Lows, MTF Dashboard, Multiple Time Frame, BigBar, HTF OB, HTF Market Structure, 
Currency Strength Wizard , başarılı ticaret için size hepsi bir arada çözüm sağlayan çok güçlü bir göstergedir. Gösterge, birden çok zaman dilimindeki tüm para birimlerinin verilerini kullanarak şu veya bu forex çiftinin gücünü hesaplar. Bu veriler, şu veya bu para biriminin gücünü görmek için kullanabileceğiniz, kullanımı kolay para birimi endeksi ve para birimi güç hatları biçiminde temsil edilir. İhtiyacınız olan tek şey, işlem yapmak istediğiniz tabloya göstergeyi eklemektir ve gösterge size
Italo Levels Indicator
Italo Santana Gomes
5 (7)
BUY INDICATOR AND GET EA FOR FREE AS A BONUS + SOME OTHER GIFTS! ITALO LEVELS INDICATOR  is the best levels indicator ever created, and why is that? Using high volume zones on the market and Fibonacci the Indicator works on all time-frames and assets, indicator built after 7 years of experience on forex and many other markets. You know many levels indicators around the internet are not complete, does not help, and it's difficult to trade, but the   Italo Levels Indicator is different , the Ital
Bu gösterge panosu, piyasa yapısını tersine çevirme göstergesiyle kullanım için bir uyarı aracıdır. Birincil amacı, belirli zaman dilimlerinde geri dönüş fırsatları ve ayrıca göstergenin yaptığı gibi uyarıların yeniden test edilmesi (onay) konusunda sizi uyarmaktır. Pano, kendi başına bir grafik üzerinde oturacak ve seçtiğiniz çiftler ve zaman dilimlerinde size uyarılar göndermek için arka planda çalışacak şekilde tasarlanmıştır. Piyasa tersine çevrilme göstergesinin tek bir MT4'te birden fazla
Auto Order Block with break of structure based on ICT and Smart Money Concepts Futures Break of Structure ( BoS )             Order block ( OB )            Higher time frame Order block / Point of Interest ( POI )    shown on current chart           Fair value Gap ( FVG ) / Imbalance   ,  MTF      ( Multi Time Frame )    Volume Imbalance     ,  MTF          vIMB Gap’s Equal High / Low’s     ,  MTF             EQH / EQL Liquidity               Current Day High / Low           HOD /
ADR Ters Çevirme Göstergesi, normal ortalama günlük aralığına göre fiyatın şu anda nerede işlem gördüğünü bir bakışta size gösterir. Fiyat, ortalama aralığı ve seçtiğiniz seviyenin üzerindeki seviyeleri aştığında, açılır pencere, e-posta veya push yoluyla anında uyarılar alacaksınız, böylece hızlı bir şekilde geri çekilmelere ve geri dönüşlere atlayabilirsiniz. Gösterge, grafikte ortalama günlük aralık uç noktalarında yatay çizgiler ve ayrıca fiyatları aşan matematiksel olasılıkları olan seviye
Wolfe Wave Scanner
Jalitha K Johny
5 (1)
Wolfe Waves scanner - It scans all the Symbols and identify the movement of price and it gives confidence in trade. It automatically plots  fifth wave breaks out of the channel. According to the theory behind the pattern, a line drawn from the point at the beginning of the first wave and passing through the beginning of the fourth wave predicts a target price for the end of the fifth wave. If a trader properly identifies a Wolfe Wave as it forms, the beginning of the fifth wave represents an op
on free demo press zoom out button to see back.. cnt number is bar numbers.you can change up to 3000 related to chart bars numbers. minimum value is 500. there is g value set to 10000. no need to change it. this indicator almost grail,no repaint and all pairs ,all timeframe indicator. there is red and blue histograms. if gold x sign comes on red histogram that is sell signal. if blue x sign comes on blue histogram that is buy signal. this indicator on thise version works all pairs.al timeframe
Yazarın diğer ürünleri
Imagic01
Aleksandr Morozov
The indicator represents 4 moving averages, shifted back. Created, like any moving average indicators, in order to see the approximate balance of volatility and the number of bulls and bears. The difference from other Moving Averages is that an attempt is made here to bring the moving averages of different periods to a common denominator, respectively, to bring the number of traders trading on different timeframes to a common denominator. The indicator is distributed as is. MnojitelMA1, Mnoji
FREE
Imagic02
Aleksandr Morozov
An indicator showing volumes with the addition of four moving averages of these volumes. What is this indicator for? When analyzing the Forex markets, metals, indices on the H1, H4 charts, at the beginning of the day and at the end of the trading day according to server time, the volumes are less than in the middle of the day. This indicator was created for this. It will help you compare trading volumes within the day. The indicator is distributed as is. Tags: Volume, Custom Volume, MA, Custom M
FREE
Imagic04
Aleksandr Morozov
Indicator formula: High-Low + Volume; Open-Close + Volume That is, an attempt to bring price and volume to a common denominator. Input parameters: IndicatorPeriod: several periods of calculation (small-short-term; medium-medium; long-long-term). MnojitelLine, MnpjitelLine2 - multiplication of lines for comparison. AverageVolume - averaging volumes for calculation (needed to remove the dependence on volumes). If both the indicator and the chart make a fast jump, then we are waiting for
Imagic05
Aleksandr Morozov
The indicator is a tough Moving Average, weighted by many parameters. Accordingly, you need to trade according to the volatility of the chart. For convenience, moving averages of High, Low, Median ((High-Low) / 2) periods have been added to the indicator. Input parameters: IndicatorPeriod (green line): several periods (general-general, calculation for all periods; small- small period; medium- medium period; long- long period) MaLine- indicator smoothing (Moving Average) (blue line). Per
Imagic06
Aleksandr Morozov
The indicator represents 2 lines of different periods: one line is short-term (red line), the other is long-term (blue line). Each of the lines is a hard Moving Average, weighted by many parameters. Accordingly, you need to trade according to chart volatility. For convenience, the indicator has been added moving averages of the High, Low, Median ((High-Low) / 2) periods. Input parameters: IndicatorPeriod: several periods (general- general period, calculation for all periods; small- short-te
Filtrele:
İnceleme yok
İncelemeye yanıt
Sürüm 2.3 2021.01.06
Added the ability to hide the comment in the left corner of the chart.
Added weighting of volumes when calculating the indicator.