Trend Actual
- Göstergeler
- Iurii Tokman
- Sürüm: 1.0
- Etkinleştirmeler: 5
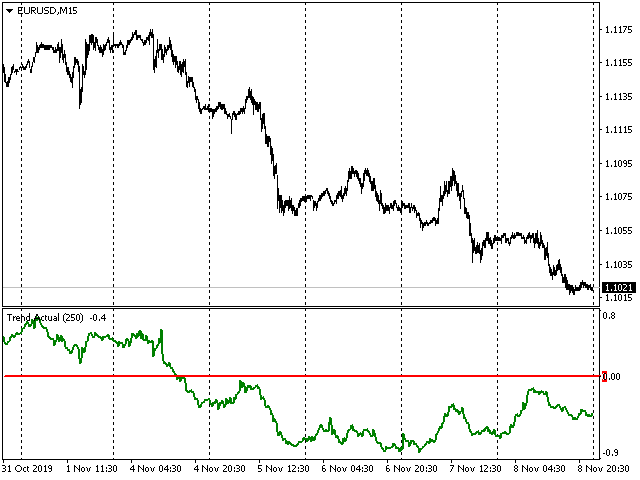
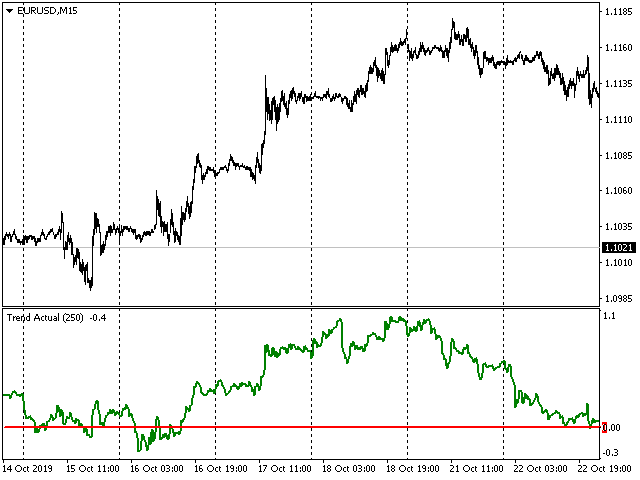
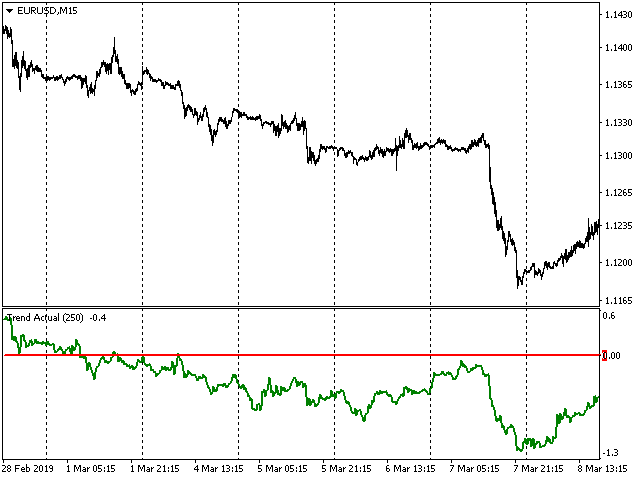
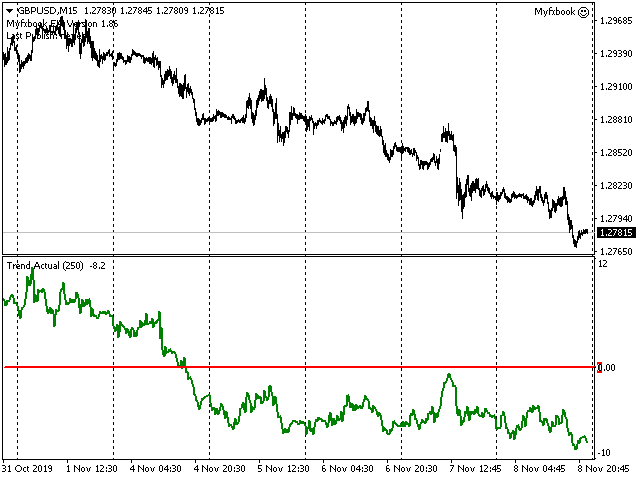
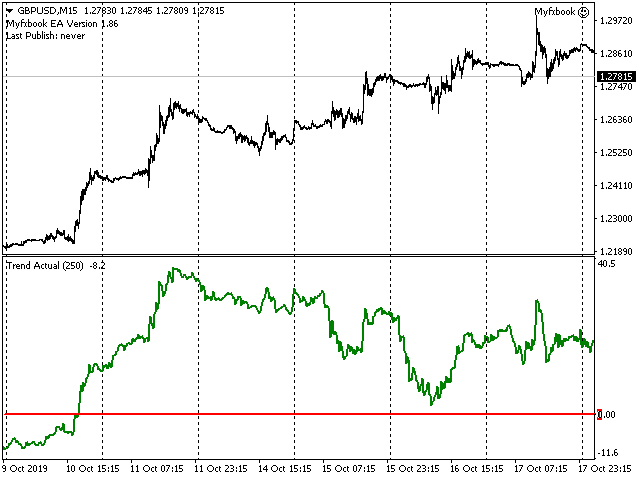
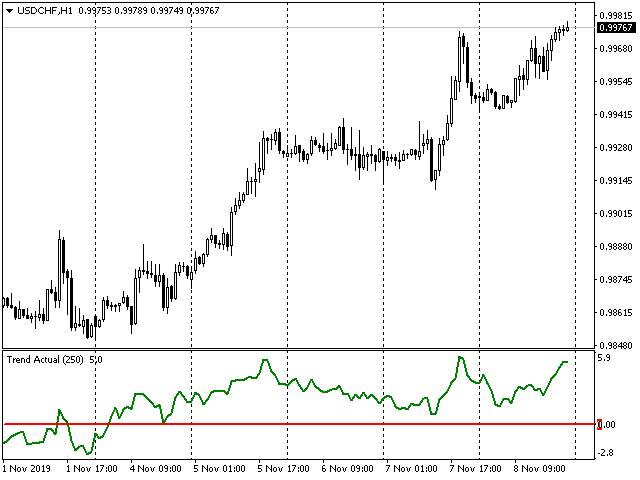
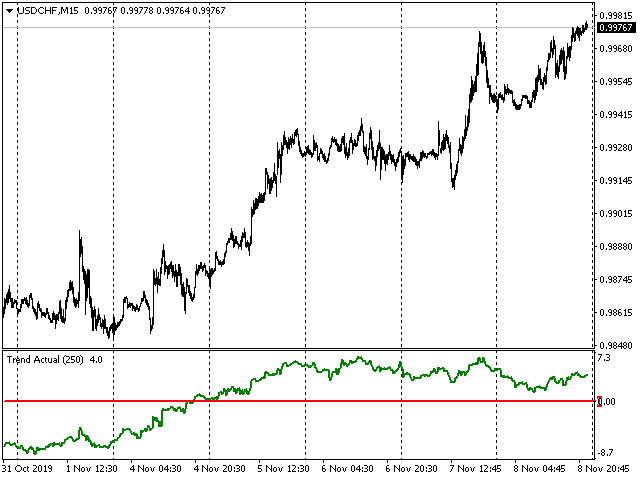
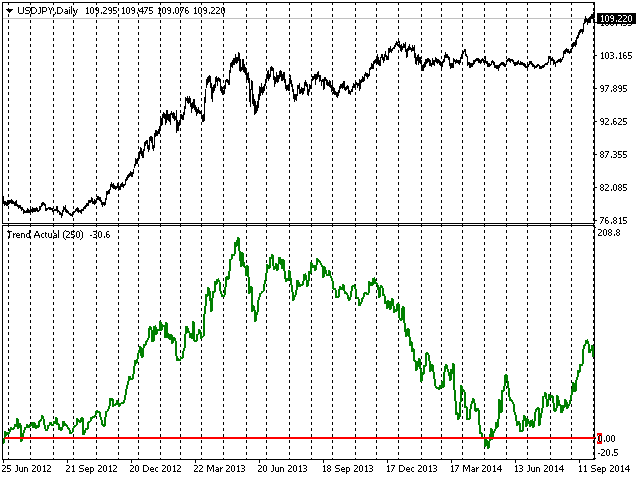
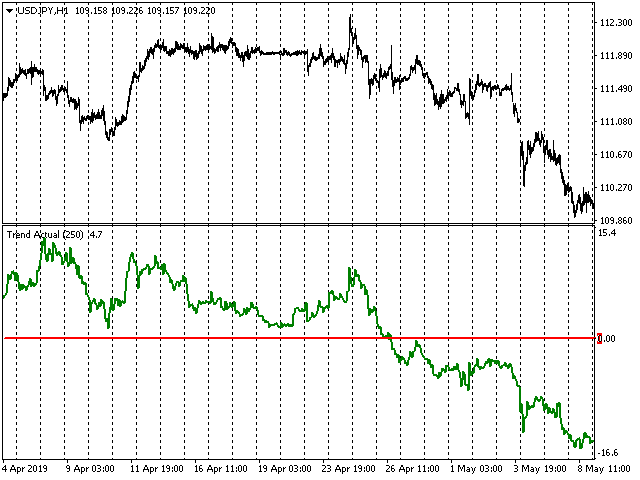
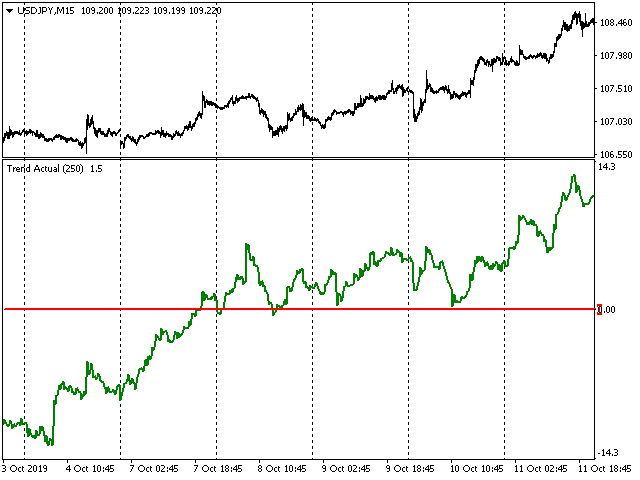
Trend Actual
Indicator of the direction of the current trend. The direction is determined by the position of the indicator line relative to the zero level, if the line is above the zero level - the trend direction is upward and purchases are assumed, if the indicator line is below the zero level - the trend direction is downward and sales are assumed. When the indicator line crosses the zero level, the trend changes to the opposite one.
Description of indicator settings:
- period - indicator period