• Genel bakış
  • İncelemeler (2)
  • Yorumlar
  • Yenilikler

Two Currency Pairs Correlation

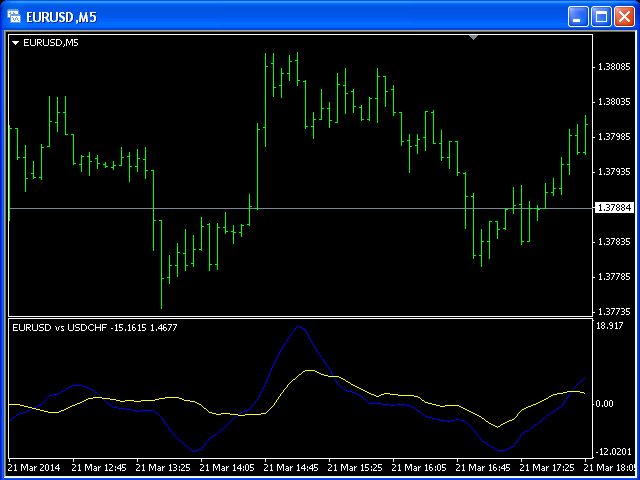
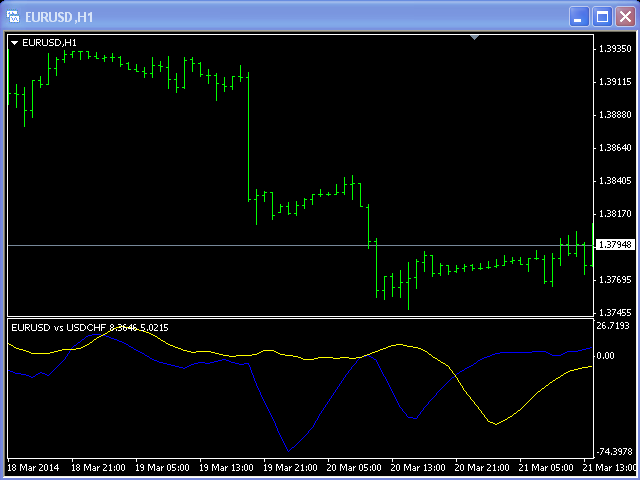
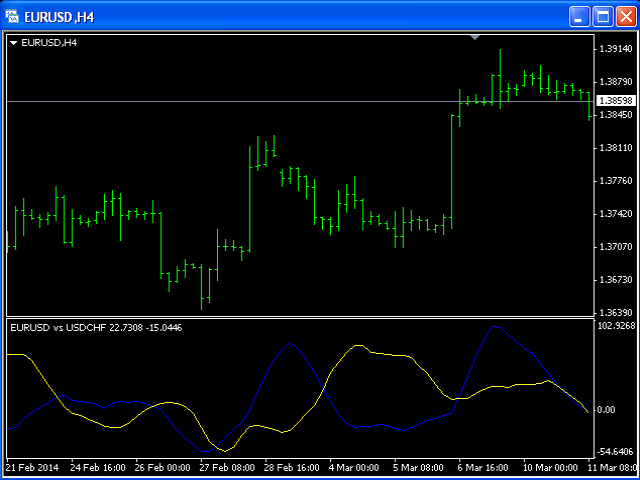
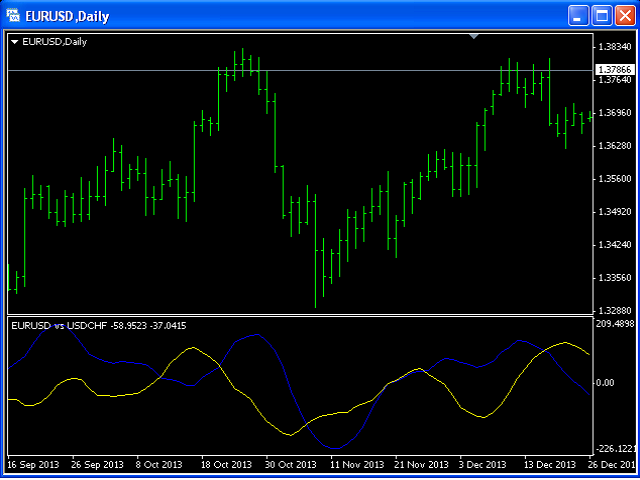
This indicator is developed to show the average movement of any 2 correlated currency pairs of the same TF.

The crossing of 2 lines (in case with "EURUSD" (blue line) and "USDCHF" (yellow line)) is signaling about ascending or descending trend.

Input parameters:

  • symbol1 = EURUSD
  • MAPeriod1 = 13
  • MAMethod1 = 0. Possible values: MODE_SMA = 0, MODE_EMA = 1, MODE_SMMA = 2, MODE_LWMA = 3.
  • MAPrice1 = 1. Possible values: PRICE_CLOSE = 0, PRICE_OPEN = 1, PRICE_HIGH = 2, PRICE_LOW = 3, PRICE_MEDIAN = 4, PRICE_TYPICAL = 5, PRICE_WEIGHTED = 6.
  • MaAvg1 = 5. Smoothing Period.
  • MaMet1 = 0. Smoothing Method: MODE_SMA = 0, MODE_EMA = 1, MODE_SMMA = 2, MODE_LWMA=3.
Önerilen ürünler
VR Cub
Vladimir Pastushak
VR Cub , yüksek kaliteli giriş noktaları elde etmenin bir göstergesidir. Gösterge, matematiksel hesaplamaları kolaylaştırmak ve bir pozisyona giriş noktalarının aranmasını basitleştirmek için geliştirildi. Göstergenin yazıldığı ticaret stratejisi uzun yıllardan beri etkinliğini kanıtlamaktadır. Ticaret stratejisinin basitliği, acemi yatırımcıların bile başarılı bir şekilde ticaret yapmasına olanak tanıyan büyük avantajıdır. VR Cub, pozisyon açılış noktalarını ve Kâr Al ve Zararı Durdur hedef sev
Market Structure Zig Zag
Lesedi Oliver Seilane
4.65 (26)
Free Market structure zig zag to assist in price action trading the screenshots describe how to use and how to spot patterns new version comes with alerts, email alert and  push notification alert can be used on all pairs  can be used on all timeframes  you can add additional confirmation indicators the indicator shows you your higher high and low highs as well as your lower lows and lower highs  the indication makes price action analysis easier to spot.
FREE
GeoWprPro
Georgij Komarov
WPR by Profile, or WPR for Professionals Geo_WprPro is one of the well-known currency profile indicators. It simultaneously displays two WPR indicators with different parameters in the matrix form on all timeframes of multiple currency pairs forming the currency profile . As follows from the description, " WPR is a leading indicator that often goes ahead of the price chart. The oscillator frequently reaches extreme values before the price reversal as if anticipating that event: it almost always
Black series MT4
Dmitriy Kashevich
1 (1)
Black series MT4 - The indicator is designed for trading on binary options with Timeframe M1-M5-M15 Multicurrency (Works on cryptocurrency and currency pairs) The signal appears when the candle opens Up to 90% correct signals There is no signal redrawing at all Can be used with other indicators. Good for scalping! In Settings there is: -Indicator working methods -I Allert Arrow color Red signal down Blue signal up Also watch the video how the indicator works and signals
Sto Signal AM
Andriy Matviyevs'kyy
This indicator displays Stochastic osc signals on the price chart and allows the user to receive notifications of such signals. The Stochastic indicator is a classic and proven indicator of the technical analysis of the markets. Despite its age, it is still relevant today. Depending on the settings, the indicator allows you to work effectively on various TFs and any markets. Signals are given on fully formed bars and are not redrawn. Custom Parameters: Stochastic_Price (0-1) - The applied pric
FREE
Infinity Trend Pro
Yaroslav Varankin
1 (1)
This is a trend indicator without redrawing Developed instead of the binary options strategy (by the color of the Martingale candlestick) Also works well in forex trading When to open trades (binary options) A signal will appear in the place with a candle signaling the current candle It is recommended to open a deal for one candle of the current timeframe M1 and M5 When a blue dot appears, open a deal up When a red dot appears, open a trade down. How to open trades on Forex. When a signal is rec
The Th3Eng PipFinite indicator is based on a very excellent analysis of the right trend direction with perfect custom algorithms. It show the true direction and the best point to start trading. With StopLoss point and Three Take Profit points. Also it show the right pivot of the price and small points to order to replace the dynamic support and resistance channel, Which surrounds the price. And Finally it draws a very helpful Box on the left side on the chart includes (take profits and Stop loss
PABT Pattern Indicator - it's classical system one of the signal patterns. Indicator logic - the Hi & Lo of the bar is fully within the range of the preceding bar, look to trade them as pullback in trend. In the way if indicator found PABT pattern it's drawing two lines and arrow what showing trend way.  - First line - it's entry point and drawing at: 1. On the high of signal bar or on middle of the signal bar (depending from indicator mode) for buy; 2. On the low of signal bar or on middle of t
Stratos Pali Indicator   is a revolutionary tool designed to enhance your trading strategy by accurately identifying market trends. This sophisticated indicator uses a unique algorithm to generate a complete histogram, which records when the trend is Long or Short. When a trend reversal occurs, an arrow appears, indicating the new direction of the trend. Important Information Revealed Leave a review and contact me via mql5 message to receive My Top 5 set files for Stratos Pali at no cost! D
Noize Absorption Index MT4
Ekaterina Saltykova
5 (1)
Noize Absorption Index - is the manual trading system that measures the difference of pressure between bears forces and bulls forces. Green line - is a noize free index that showing curent situation. Zero value of index shows totally choppy/flat market.Values above zero level shows how powerfull bullish wave is and values below zero measures bearish forces.Up arrow appears on bearish market when it's ready to reverse, dn arrow appears on weak bullish market, as a result of reverse expectation. S
SRP Pro
Farhad Kia
5 (1)
Strong Retracement Points Pro edition! SRP (Strong Retracement/Reversal Points) is a powerful and unique support and resistance indicator. It displays the closest important levels which we expect the price retracement/reversal! If all level are broken from one side, it recalculates and draws new support and resistance levels, so the levels might be valid for several days depending on the market! If you are still hesitating to start using this wonderful tool, you can check this link to see how ef
Master Scalping M1 , trendi hızlı ve doğru bir şekilde belirlemek için bir algoritma kullanan yenilikçi bir göstergedir. Gösterge, pozisyonların açılış ve kapanış zamanını hesaplar, gösterge algoritmaları, bir ticarete girmek (bir varlık satın almak veya satmak) için ideal anları bulmanızı sağlar, bu da çoğu tüccar için işlemlerin başarısını artırır. Göstergenin faydaları: Kullanımı kolaydır, çizelgeyi gereksiz bilgilerle aşırı yüklemez. Herhangi bir strateji için bir filtre olarak kullanılabili
Indicator for binary options arrow is easy to use and does not require configuration works on all currency pairs, cryptocurrencies buy signal blue up arrow sell signal red down arrow tips do not trade during news and 15-30 minutes before their release, as the market is too volatile and there is a lot of noise it is worth entering trades one or two candles from the current period (recommended for 1 candle) timeframe up to m 15 recommended money management fixed lot or fixed percentage of the depo
Strong Retracement Points Pro demo edition! SRP (Strong Retracement/Reversal Points) is a powerful and unique support and resistance indicator. It displays the closest important levels which we expect the price retracement/reversal! If all level are broken from one side, it recalculates and draws new support and resistance levels, so the levels might be valid for several days depending on the market! If you are still hesitating to start using this wonderful tool, you can check this link to see h
This indicator is another variant of the famous powerful indicator Fibonacci-SS https://www.mql5.com/en/market/product/10136 but has different behaviour in placing Pending Order and TP Line. Automatically places Fibonacci retracement lines from the last highest and lowest visible bars on the chart with: An auto Pending Order (Buy/Sell). Taking Profit 1, Taking Profit 2 is pivot point and Taking Profit 3 for extended reward opportunity. The best risk and reward ratio. Simple and powerful indica
Owl smart levels
Sergey Ermolov
4.34 (35)
MT5 versiyonu  |  FAQ Owl Smart Levels Indicator ,   Bill Williams'ın gelişmiş fraktalları , piyasanın doğru dalga yapısını oluşturan Valable ZigZag ve kesin giriş seviyelerini gösteren   Fibonacci seviyeleri   gibi popüler piyasa analiz araçlarını içeren tek gösterge içinde eksiksiz bir ticaret sistemidir. pazara ve kar elde edilecek yerlere. Stratejinin ayrıntılı açıklaması Gösterge ile çalışma talimatı Baykuş Yardımcısı ticaretinde Danışman Yardımcısı Kullanıcıların özel sohbeti -> Satın ald
The GGP Squeeze Momentum  MT4 Indicator is a volatility and momentum tool designed to help traders optimize their trading performance and providing traders with actionable insights to make well-informed trading decisions. This indicator is MT4 conversion of the Squeeze Momentum Indicator by “LazyBear “ in Trading View website and some alert methods are added to provide real-time alerts when a trading signal is generated, in order to allow traders to act quickly and efficiently. For MT5 version p
Indicator for determining flat and trend. If the price is below any of the two histograms and two lines (red and blue), this is a sell zone. When purchasing this version of the indicator, MT5 version for one real and one demo account - as a gift (to receive, write me a private message)! If the price is above any of the two histograms and two lines (red and blue), this is a buy zone. MT5 version:  https://www.mql5.com/en/market/product/70409 If the price is between two lines or in the zone
Forex Gump
Andrey Kozak
2.4 (5)
Forex Gump is a fully finished semi-automatic trading system. In the form of arrows, signals are displayed on the screen for opening and closing deals. All you need is to follow the instructions of the indicator. When the indicator shows a blue arrow, you need to open a buy order. When the indicator shows a red arrow, you need to open a sell order. Close orders when the indicator draws a yellow cross. In order to get the most effective result, we recommend using the timeframes H1, H4, D1. There
Basic Support and Resistance Göstergimiz, teknik analizinizi artırmak için ihtiyacınız olan çözümdür.Bu gösterge, destek ve direnç seviyelerini grafikte yansıtmanıza olanak tanır/ MT5 sürümü Özellikler Fibonacci seviyelerinin entegrasyonu: Fibonacci seviyelerini destek ve direnç seviyelerinin yanı sıra görüntüleme seçeneğiyle, göstergemiz size piyasa davranışı ve olası tersine dönme alanları hakkında daha derin bir fikir verir. Performans Optimizasyonu: Genişletilmiş satırları yalnızca he
Trend Monitor
Pavel Zamoshnikov
4 (4)
The indicator generates early signals basing on ADX reading data combined with elements of price patterns. Works on all symbols and timeframes. The indicator does not redraw its signals. You see the same things on history and in real time. For better visual perception signals are displayed as arrows (in order not to overload the chart). Features Easy to use. Filter configuration only requires selection of sensitivity in the " Sensitivity of the indicator " input. Signals can be filtered usin
FXC iMACD-DivergencE MT4 Indicator This is an advanced MACD indicator that finds trend-turn divergences on the current symbol. The indicator detects divergence between the MACD and the price movements as a strong trend-turn pattern. Main features: Advanced divergence settings Price based on Close, Open or High/Low prices Give Buy/Sell open signals PUSH notifications E-mail sending Pop-up alert Customizeable Information panel Input parameters: MACD Fast-EMA: The Fast-EMA variable of the MACD
This product is a part of  ON Trade Waves Patterns Harmonic Elliot Wolfe you can test free version on EURJPY from this link  Wolf Waves Indicator Kurt Dalgalarını Keşfedin - En İyi Ticaret Aracınız! Herhangi bir zaman diliminde Kurt Dalgalarını kolayca tespit etmek için güçlü bir araç mı arıyorsunuz? Daha fazla aramayın! Kurt Dalgaları göstergemiz bu işi zahmetsizce halleder. İşte neden sizin için mükemmel olduğunu anlatıyoruz: Ana Özellikler: Otomatik Algılama:   Kurt Dalgaları göstergemiz
[ZhiBiCCI] indicators are suitable for all cycle use, and are also suitable for all market varieties. [ZhiBiCCI] Green solid line is a reversal of bullish divergence. The green dotted line is a classic bullish divergence. [ZhiBiCCI] The solid line to the red is a reverse bearish divergence. The red dotted line is a classical bearish divergence. [ZhiBiCCI] can be set in the parameters (Alert, Send mail, Send notification), set to (true) to send instant signals to the alarm window, email, in
LordAutoFibonnaci
Igor Pereira Calil
5 (1)
Lord Auto Fibonnaci is a free indicator for Meta Trader, in order to show the most famous chart in the financial market known as "Fibonnaci". As we can see in the images below, the fibonnaci table will automatically analyze the graph for you, with trend factors through percentage, almost infallible use, you can always work when the percentage is low or high, start shopping and sales on time, great for analyzing entries! In the images below we can see an example in gold in H4, where we are a
FREE
TWO PAIRS SQUARE HEDGE METER INDICATOR Try this brilliant 2 pairs square indicator It draws a square wave of the relation between your two inputs symbols when square wave indicates -1 then it is very great opportunity to SELL pair1 and BUY Pair2 when square wave indicates +1 then it is very great opportunity to BUY pair1 and SELL Pair2 the inputs are : 2 pairs of symbols         then index value : i use 20 for M30 charts ( you can try other values : 40/50 for M15 , : 30 for M30 , : 10 for H1 ,
The indicator displays the data of the Stochastic oscillator from a higher timeframe on the chart. The main and signal lines are displayed in a separate window. The stepped response is not smoothed. The indicator is useful for practicing "manual" forex trading strategies, which use the data from several screens with different timeframes of a single symbol. The indicator uses the settings that are identical to the standard ones, and a drop-down list for selecting the timeframe. Indicator Parame
The trading statistics indicator notifies the trader of the aggregate income of the trading account for different time intervals. The indicator has wide display settings on the graph. There is a choice of one of the two display languages on the chart- English and Russian. Settings Indicator language (ENG, RUS) - Select the language to display on the chart; To control the magic (-1: any magic) - Entering the Magic for control (-1: any Magic); Angle of indicator tie - Selecting the angle of the
MYEwo
Ahmet Metin Yilmaz
MYEWO göstergesi, grafiğinizdeki kısa vade yönünü bulmanıza yardımcı olan bir araçtır. Varsayılan giriş değerleri bu göstergedeki sık kullanılan değerlerdir. Kendi değerlerinizi kendi trend algılamaya ve çiftlerinize göre bulabilir ve kullanabilirsiniz. Tavsiyem, ana grafikteki uzun vadeye olan trendini (200 ve daha yüksek uygun olabilir) anlamak için hareketli bir ortalama kullanmaktır. M5 grafikleri, kullanacağınız scalping tarzı ticaret işlemlerini basitleştirecektir. Genellikle MYEWO göster
HMA Trend Professional MT4
Pavel Zamoshnikov
4.57 (7)
Improved version of the free HMA Trend indicator (for MetaTrader 4) with statistical analysis. HMA Trend is a trend indicator based on the Hull Moving Average (HMA) with two periods. HMA with a slow period identifies the trend, while HMA with a fast period determines the short-term movements and signals in the trend direction. The main differences from the free version: Ability to predict the probability of a trend reversal using analysis of history data. Plotting statistical charts for analyz
Bu ürünün alıcıları ayrıca şunları da satın alıyor
Gann Made Easy
Oleg Rodin
4.85 (82)
Gann Made Easy , bay teorisini kullanarak ticaretin en iyi ilkelerine dayanan, profesyonel ve kullanımı kolay bir Forex ticaret sistemidir. WD Gann. Gösterge, Zararı Durdur ve Kâr Al Seviyeleri dahil olmak üzere doğru SATIN AL ve SAT sinyalleri sağlar. PUSH bildirimlerini kullanarak hareket halindeyken bile işlem yapabilirsiniz. Lütfen satın aldıktan sonra benimle iletişime geçin! Alım satım ipuçlarımı ve harika bonus göstergelerini ücretsiz olarak sizinle paylaşacağım! Muhtemelen Gann ticaret y
TPSpro RFI Levels
Roman Podpora
4.82 (22)
Reversal First Impulse levels (RFI)    INSTRUCTIONS        RUS       -       ENG              R ecommended to use with an indicator   -   TPSpro  TREND PRO -  Version MT5 A key element in trading is zones or levels from which decisions to buy or sell a trading instrument are made. Despite attempts by major players to conceal their presence in the market, they inevitably leave traces. Our task was to learn how to identify these traces and interpret them correctly. Main functions: Displaying activ
Atomic Analyst
Issam Kassas
5 (2)
Öncelikle belirtmek gerekir ki bu Ticaret Göstergesi Yeniden Çizim Yapmaz, Gecikmez ve Gecikme Göstermez, bu da hem manuel hem de robot ticareti için ideal hale getirir. Kullanıcı kılavuzu: ayarlar, girişler ve strateji. Atom Analisti, Piyasada Daha İyi Bir Avantaj Bulmak İçin Fiyatın Gücünü ve Momentumunu Kullanan PA Fiyat Hareketi Göstergesidir. Gürültüleri ve Yanlış Sinyalleri Kaldırmaya ve Ticaret Potansiyelini Artırmaya Yardımcı Olan Gelişmiş Filtrelerle Donatılmıştır. Birden fazla katma
Trend Punch
Mohamed Hassan
4.95 (19)
This indicator is unstoppable when combined with our other indicator called  Support & Resistance . After purchase, send us a message and you will get it   for  FREE as a BONUS! Introducing Trend Punch , the revolutionary forex trend indicator that will transform the way you trade! Trend Punch is uniquely designed to provide precise buy and sell arrows during strong market trends, making your trading decisions clearer and more confident. Whether you're trading major currency pairs or exotic sym
TPSproTREND PrO
Roman Podpora
4.79 (19)
TPSpro TREND PRO,   piyasayı otomatik olarak analiz eden, trend ve değişimlerinin her biri hakkında bilgi sağlayan, ayrıca yeniden çizmeden işlemlere girme sinyalleri veren bir trend göstergesidir! Gösterge her mumu ayrı ayrı analiz ederek kullanır. farklı dürtülere atıfta bulunur - yukarı veya aşağı dürtü. Para birimleri, kripto paralar, metaller, hisse senetleri ve endeksler için işlemlere tam giriş noktaları! Sürüm MT5                   GÖSTERGENİN TAM AÇIKLAMASI       Bunu -   RFI SEVİYELER
Scalper Inside PRO
Alexey Minkov
4.73 (56)
An exclusive indicator that utilizes an innovative algorithm to swiftly and accurately determine the market trend. The indicator automatically calculates opening, closing, and profit levels, providing detailed trading statistics. With these features, you can choose the most appropriate trading instrument for the current market conditions. Additionally, you can easily integrate your own arrow indicators into Scalper Inside Pro to quickly evaluate their statistics and profitability. Scalper Inside
FX Power MT4 NG
Daniel Stein
5 (12)
Sabah Brifingimiz burada mql5 ve on Telegram! FX Power MT4 NG , uzun zamandır çok popüler olan döviz gücü ölçerimiz FX Power'ın yeni neslidir. Peki bu yeni nesil güç ölçer ne sunuyor? Orijinal FX Power hakkında sevdiğiniz her şey PLUS GOLD/XAU güç analizi Daha da hassas hesaplama sonuçları Ayrı ayrı yapılandırılabilir analiz dönemleri Daha da iyi performans için özelleştirilebilir hesaplama limiti Özel çokluDaha fazlasını görmek isteyenler için örnek ayarlar Her grafikte en sevdiğiniz renkler i
Şu anda %20 İNDİRİMLİ! Herhangi bir Acemi veya Uzman Tüccar için En İyi Çözüm! Bu gösterge paneli yazılımı 28 döviz çifti üzerinde çalışıyor. Ana göstergelerimizden 2'sine (Gelişmiş Para Birimi Gücü 28 ve Gelişmiş Para Birimi Dürtüsü) dayanmaktadır. Tüm Forex piyasasına harika bir genel bakış sağlar. Gelişmiş Para Birimi Gücü değerlerini, para birimi hareket hızını ve tüm (9) zaman dilimlerinde 28 Forex çifti için sinyalleri gösterir. Trendleri ve / veya scalping fırsatlarını belirlemek içi
FX Volume
Daniel Stein
4.58 (33)
Sabah Brifingimiz aracılığıyla ayrıntılar ve ekran görüntüleri ile günlük piyasa güncellemenizi alın burada mql5 ve on Telegram ! FX Volume, bir brokerin bakış açısından piyasa duyarlılığı hakkında GERÇEK bir fikir veren İLK ve TEK hacim göstergesidir. COT raporlarından çok daha hızlı bir şekilde, brokerlar gibi kurumsal piyasa katılımcılarının Forex piyasasında nasıl konumlandıklarına dair harika bilgiler sağlar. Bu bilgileri doğrudan grafiğinizde görmek, ticaretiniz için gerçek oyun değiştir
ŞU ANDA %31 INDIRIMLI !!! Yeni Başlayanlar veya Uzman Tüccarlar için En İyi Çözüm! Bu gösterge benzersiz, yüksek kaliteli ve uygun fiyatlı bir ticaret aracıdır çünkü bir dizi tescilli özellik ve gizli bir formül ekledik. Yalnızca BİR grafikle 28 döviz çiftinin tümü için Uyarılar verir. Yeni bir trendin veya scalping fırsatının tam tetik noktasını belirleyebildiğiniz için ticaretinizin nasıl gelişeceğini hayal edin! Yeni temel algoritmalar üzerine inşa edilen bu sistem, potansiyel işlemler
Enigmera
Ivan Stefanov
5 (3)
ENIGMERA: Pazarın çekirdeği https://www.enigmera.com Giriş Bu gösterge ve ticaret sistemi, finansal piyasalar için dikkate değer bir yaklaşımdır. ENIGMERA, destek ve direnç seviyelerini doğru bir şekilde hesaplamak için fraktal döngüleri kullanır. Gerçek birikim aşamasını gösterir ve yön ve hedefler verir.  İster bir trendde ister bir düzeltmede olalım çalışan bir sistem.  Nasıl çalışır? ENIGMERA üç çizgiden oluşur: destek/direnç çizgisi, hedef çizgisi ve sapma çizgisi. Sistem, geçmiş veril
ŞU ANDA %26 INDIRIMLI Yeni Başlayanlar veya Uzman Tüccarlar için En İyi Çözüm! Bu Gösterge benzersiz, yüksek kaliteli ve uygun fiyatlı bir ticaret aracıdır çünkü bir dizi tescilli özellik ve yeni bir formül ekledik. Sadece BİR grafik ile 28 Forex çifti için Döviz Gücünü okuyabilirsiniz! Yeni bir trendin veya scalping fırsatının tam tetik noktasını belirleyebildiğiniz için ticaretinizin nasıl gelişeceğini hayal edin? Kullanım kılavuzu: buraya tıklayın Bu ilk olan, orijinal! Değersiz bir
Bomb Bank Signal
Igor Pereira Calil
5 (1)
Bomb Bank Signal: Your Trusted Indicator for MetaTrader 4 The Bomb Bank Signal is a powerful indicator for MetaTrader 4, designed to identify the most relevant trends in the financial market. If you are looking for a tool that accurately anticipates movements, Bomb Bank is the ally you need. How it Works: This indicator combines three distinct methods – volume analysis, candle closes and symmetrical trend – to detect and signal buying and selling opportunities. Bomb Bank is like a "bomb"
Trend Cutter
Oleg Rodin
5 (2)
Trend Cutter, M1 ve M5 gibi daha düşük zaman dilimleri de dahil olmak üzere herhangi bir zaman diliminde kullanılabilen bir trend göstergesidir. Gösterge, gün içi ticareti tercih eden yatırımcılar için idealdir ve uzun vadeli ticareti tercih edenlere de yardımcı olacaktır. Bu göstergeyi ticaret sisteminiz için bir temel olarak veya bağımsız bir ticaret çözümü olarak kullanabilirsiniz. Gösterge, PUSH bildirimleri de dahil olmak üzere her türlü uyarıyı sağlar. Göstergenin kullanımı çok kolaydır. S
TakePropips Donchian Trend Pro
Eric John Pajarillaga Aldana
4.44 (16)
TakePropips Donchian Trend Pro   (MT4), Donchian Kanalı'nı kullanarak trendin yönünü otomatik olarak tespit eden ve size ticarete giriş ve çıkış sinyalleri sağlayan güçlü ve etkili bir araçtır! Bu çok işlevli gösterge, bir trend tarayıcı, ticaret sinyalleri, istatistiksel panel, tarayıcı, ticaret oturumları ve uyarı geçmişi panosu içerir. Size ticaret sinyalleri sağlamak ve çizelgeleri analiz ederek saatlerce tasarruf etmenizi sağlamak için tasarlanmıştır! Kullanım kılavuzunu ve kurulum kılavuzu
Gold Channel is a volatility-based indicator, developed with a specific timing algorithm for the XAUUSD pair, which consists of finding possible corrections in the market. This indicator shows two outer lines, an inner line (retracement line) and an arrow sign, where the theory of the channel is to help identify overbought and oversold conditions in the market. The market price will generally fall between the boundaries of the channel. If prices touch or move outside the channel it is a tra
Advanced Supply Demand
Bernhard Schweigert
4.91 (294)
CURRENTLY 26% OFF !! Best Solution for any Newbie or Expert Trader! This indicator is a unique, high quality and affordable trading tool because we have incorporated a number of proprietary features and a new formula. With this update, you will be able to show double timeframe zones. You will not only be able to show a higher TF but to show both, the chart TF, PLUS the higher TF: SHOWING NESTED ZONES. All Supply Demand traders will love it. :) Important Information Revealed Maximize the potenti
Currency Strength Wizard , başarılı ticaret için size hepsi bir arada çözüm sağlayan çok güçlü bir göstergedir. Gösterge, birden çok zaman dilimindeki tüm para birimlerinin verilerini kullanarak şu veya bu forex çiftinin gücünü hesaplar. Bu veriler, şu veya bu para biriminin gücünü görmek için kullanabileceğiniz, kullanımı kolay para birimi endeksi ve para birimi güç hatları biçiminde temsil edilir. İhtiyacınız olan tek şey, işlem yapmak istediğiniz tabloya göstergeyi eklemektir ve gösterge size
Order Block Hunter
Noha Mohamed Fathy Younes Badr
5 (4)
Order block hunter indicator is the best indicator for  hunt the order blocks that area where there has been a large concentration of limit orders waiting to be executed Order blocks are identified on a chart by observing previous price action and looking for areas where the price experienced significant movement or sudden changes in direction .This indicator does that for you by using very complicated codes and helps you to take the best areas To buy and sell because it make marks at the best a
PRO Renko Sistemi, RENKO grafikleri ticareti için özel olarak tasarlanmış son derece hassas bir ticaret sistemidir. Bu, çeşitli ticaret araçlarına uygulanabilen evrensel bir sistemdir. Sistemi etkin piyasa sana doğru ters sinyallerine erişim hakkı denilen ses nötralize eder. Göstergenin kullanımı çok kolaydır ve sinyal üretiminden sorumlu tek bir parametreye sahiptir. Aracı, seçtiğiniz herhangi bir ticaret aracına ve renko çubuğunun boyutuna kolayca uyarlayabilirsiniz. Yazılımımla karlı b
Trend Pulse
Mohamed Hassan
5 (4)
Please contact me after purchase to immediately get your PDF strategy + documentation for Trend Pulse !  Introducing Trend Pulse , a unique and robust indicator capable of detecting bullish, bearish, and even ranging trends! Trend Pulse uses a special algorithm to filter out market noise with real precision. If the current symbol is moving sideways, Trend Pulse will send you a ranging signal, letting you know that it's not a good time to enter a trade. This excellent system makes Trend Pulse
Öncelikle, bu Ticaret Aracının Non-Repainting, Non-Redrawing ve Non-Lagging Gösterge olduğunu vurgulamakta fayda var, bu da onu profesyonel ticaret için ideal hale getiriyor. Çevrimiçi kurs, kullanıcı kılavuzu ve demo. Akıllı Fiyat Hareketi Kavramları Göstergesi, hem yeni hem de deneyimli tüccarlar için çok güçlü bir araçtır. İleri ticaret fikirlerini, Inner Circle Trader Analizi ve Smart Money Concepts Ticaret Stratejileri gibi 20'den fazla kullanışlı göstergeyi bir araya getirerek bir araya g
M1 Arrow
Oleg Rodin
4.73 (15)
Piyasanın iki temel ilkesine dayanan bir gün içi stratejisi. Algoritma, ek filtreler kullanarak hacimlerin ve fiyat dalgalarının analizine dayanmaktadır. Göstergenin akıllı algoritması, yalnızca iki piyasa faktörü bir araya geldiğinde bir sinyal verir. Gösterge, daha yüksek zaman çerçevesinin verilerini kullanarak M1 grafiğinde belirli bir aralıktaki dalgaları hesaplar. Ve dalgayı doğrulamak için gösterge, hacme göre analizi kullanır. Bu gösterge hazır bir ticaret sistemidir. Bir tüccarın ihtiya
PZ Day Trading
PZ TRADING SLU
3.67 (3)
Effortless trading: non-repainting indicator for accurate price reversals Special Offer: Purchase now to receive free bonuses worth $90! (Read more for details) This indicator detects price reversals in a zig-zag fashion, using only price action analysis and a donchian channel. It has been specifically designed for short-term trading, without repainting or backpainting at all. It is a fantastic tool for shrewd traders aiming to increase the timing of their operations. [ Installation Guide | Upd
Supply and Demand Dashboard PRO
Bernhard Schweigert
4.8 (20)
Şu anda %20 İNDİRİMLİ! Bu gösterge paneli, birden fazla sembol ve 9 zaman dilimine kadar çalışan çok güçlü bir yazılım parçasıdır. Ana göstergemize dayanmaktadır (En iyi yorumlar: Advanced Supply Demand ).     Gösterge paneli harika bir genel bakış sağlar. Gösterir:    Bölge mukavemet derecesi dahil filtrelenmiş Arz ve Talep değerleri, Bölgelere/ve bölgeler içindeki pip mesafeleri, İç içe geçmiş bölgeleri vurgular, Tüm (9) zaman dilimlerinde seçilen semboller için 4 çeşit uyarı verir. Kişis
True Direction Oscillator
Muhammad Elbermawi
4.86 (362)
Veya "Saf Momentum " ilkesini kullanarak fiyat değişim oranını ölçen bir endeks olan (TDO). Bir menkul kıymet fiyatı 10'dan 15'e yükseldiğinde, fiyat değişim oranı %150'dir, ancak 15'ten 10'a düştüğünde, fiyat değişim oranı sadece %33.3'tür. Bu nedenle, "Fiyat Değişim Oranı" (ROC) veya "Momentum" gibi teknik analiz göstergeleri, artan fiyat hareketleri için azalan hareketlere göre daha yüksek değerler verir. TDO, yatırımcıların momentumu doğru okumalarına yardımcı olmak için bu sorunu düzeltir
Özel MT4 göstergemizle başarılı forex ticaretinin sırrını keşfedin! Forex piyasasında nasıl başarıya ulaşacağınızı hiç merak ettiniz, riski en aza indirirken sürekli olarak kar kazandınız mı? İşte aradığınız cevap! Ticaret yaklaşımınızda devrim yaratacak tescilli MT4 göstergimizi tanıtmamıza izin verin. Benzersiz çok yönlülük Göstergemiz, Renko ve RangeBar Mum oluşumlarını tercih eden kullanıcılar için özel olarak tasarlanmıştır. Bu grafik türlerinin birçok deneyimli tüccar tarafından ter
ÜRÜNÜ SATIN ALMADAN ÖNCE LÜTFEN AŞAĞIDAKİ BİLGİLERİ OKUYUNUZ! Apollo Pips PLUS SP benzersiz bir üründür! YENİ "APOLLO PIPS" GÖSTERGEMİ ARTI TÜM İŞLEM GÖSTERGELERİME ERİŞİM İLE "SÜPER PAKET" BONUSUNU ALMAK İSTEYENLER İÇİN! Apollo Pips PLUS SP ürününü satın alarak aslında Apollo Pips göstergemin tamamen yeni bir versiyonunu satın almış oluyorsunuz. Göstergenin bu sürümü, geliştirilmiş bir algoritmaya ve kullanımı kolay bir parametreye sahiptir; bu, size göstergeyi herhangi bir piyasada ve herhangi
Currency Strength Exotics
Bernhard Schweigert
4.87 (30)
ŞU ANDA %20 INDIRIMLI! Herhangi bir Acemi veya Uzman Tüccar için En İyi Çözüm! Bu Gösterge, Egzotik Çiftler Emtialar, Endeksler veya Vadeli İşlemler gibi herhangi bir sembol için para birimi gücünü göstermek için uzmanlaşmıştır. Türünün ilk örneğidir, Altın, Gümüş, Petrol, DAX, US30, MXN, TRY, CNH vb. gerçek para birimi gücünü göstermek için 9. satıra herhangi bir sembol eklenebilir. Bu benzersiz, yüksek kaliteli ve uygun fiyatlı bir ticaret aracıdır çünkü bir dizi tescilli özelliği ve yeni
Bu gösterge paneli, seçilen semboller için mevcut en son harmonik kalıpları gösterir, böylece zamandan tasarruf edersiniz ve daha verimli olursunuz / MT5 sürümü . Ücretsiz Gösterge: Basic Harmonic Pattern Gösterge sütunları Symbol : seçilen semboller görünecektir Trend: yükseliş veya düşüş Pattern : desen türü (gartley, kelebek, yarasa, yengeç, köpekbalığı, cypher veya ABCD) Entry : giriş fiyatı SL: zararı durdur fiyatı TP1: 1. kar alma fiyatı TP2: 2. kar alma fiyatı TP3: 3. kar alma fiya
Yazarın diğer ürünleri
This indicator is designed for M1 timeframe and shows: Sum of points when the price goes up (Green Histogram). Sum of points when the price goes down (Red Histogram).  In other words, by the number and ratio of bullish points to bearish ones, you can do a technical analysis of the state of the market. If the green histogram prevails over the red one, you can conclude that at the moment the buyers are stronger than the sellers, and vice versa, if the red histogram prevails over the green, the s
A flat market can refer to a   trade in which the currency pair has not moved significantly up or down   and, therefore, has no large gain or loss attributed to the forex trading position. Usually traders not trading when the market is flat. This is a self-explanatory indicator - do nothing when the current price in a "cloud". The input parameters  nPeriod  and nMethod are used for calculating aqua clouds.
This Multi TimeFrame indicator is based on the "Fractals" classical indicator. 2 Inputs: TimeFrame1; TimeFrame2; You can put any available TimeFrame values (from M1 (Period_M1) to MN1 (Period_MN1)) equal or greater ( >= ) than the Period of the current Time Frame. The last Fractals will shown as color lines (Dots Line) of Support and Resistance for the Price moving.
This is a Multi-Time indicator which allows to display RSI and Stochastic indicators from upper timeframes on a single chart. As an example: a single chart EURUSD M5 and RSI (blue line) and Stochastic (yellow line) from H1. Red Histogram is representing Lower trend and Green Histogram is representing Upper trend.
When you put this Multi TimeFrame Parabolic SAR indicator on the chart it will automatically use Parabolic SAR from next available 3 timeframes. Green arrow will show the beginning of Up trend and Red arrow will show the beginning of Down trend. If AlertsEnabled = true, the indicator will show the Alert (message window) with a text like this: "Price going Down on ", Symbol(), " - ", Period(), " min", " price = ", Bid; If eMailEnabled = true the Indicator will send you an eMail with the same text
The zero line is characterized the Flat trend. V-shaped impulse indicates the entrance to the opposite direction. U-shaped impulse = entry orders in the same direction. If AlertsEnabled = true, the indicator will show the Alert (message window) with a text like this: "Price going Down on ", Symbol(), " - ", Period(), " min", " price = ", Bid; If eMailEnabled = true the indicator will send you an eMail with the same text an Alert message with subject: "Trinity-Impolse" (of course you have to
The indicator displays the usual Moving Average with input parameters: maPeriod_1; maMethod_1; maAppPrice_1. Then it calculates and displays MA on MA1 with input parameters: maPeriod_2; maMethod_2. Then it calculates and displays MA on MA2 with input parameters: maPeriod_3; maMethod_3. If AlertsEnabled = true the Indicator will show the Alert (message window) with a text like this: "Price going Down on ", Symbol(), " - ", Period(), " min", " price = ", Bid; If eMailEnabled = true the Indicator w
Multi TimeFrame Indicator "MTF CCI Trigger" based on the Commodity Channel Index from the upper TF (input parameter "TimeFrame") yellow line. Aqua line is representing ATR envelopes from the current TF. Green and Red arrows is triggered by CCI and represented UP and DOWN trends accordingly.
The BBImpulse indicator is based on the standard Moving Average indicator. You have MA input parameters: maPeriod - Moving Average period; maMODE - Moving Average mode (0 = MODE_SMA; 1 = MODE_EMA; 2 = MODE_SMMA; 3 = MODE_LWMA); maPRICE - Applied price (0=PRICE_CLOSE; 1=PRICE_OPEN; 2=PRICE_HIGH; 3=PRICE_LOW; 4=PRICE_MEDIAN; 5=PRICE_TYPICAL; 6=PRICE_WEIGHTED). Green Histogram is representing an UP-trend, Red Histogram is representing a Down-trend.
Multi TimeFrame indicator MTF ADX with Histogram shows ADX indicator data from the TF by your choice. You may choose a TimeFrame equal or greater than current TF. Yellow line is representing a price trend from the upper TF. Green line is representing +DI from the upper TF. Red line is representing -DI from the upper TF. Green histogram is displaying an Up-trend. Red histogram is displaying a Down-trend.
This Indicator creates 2 white lines based on Exponential Moving Averag e of High and Low prices. You can regulate how many bars will be involved in the calculation with input parameter HL_Period. Red and Blue arrows are displaying the moment to go Short and Long trades accordingly.
The most common way to interpreting the price Moving Average is to compare its dynamics to the price action. When the instrument price rises above its Moving Average, a buy signal appears, if the price falls below its moving average, what we have is a sell signal. To avoid a spontaneous entries one may use this update from Moving Average Indicator = Stepper-MA.
Envelopes technical Indicator is formed with two Moving Averages one of which is shifted upward and another one is shifted downward. Envelopes define the upper and the lower margins of the price range. Signal to sell appears when the price reaches the upper margin of the band; signal to buy appears when the price reaches the lower margin. To avoid a spontaneous entries one may use this update from Envelopes Indicator = Envelopes-Stepper.
The interpretation of the Bollinger Bands is based on the fact that the prices tend to remain in between the top and the bottom line of the bands. Abrupt changes in prices tend to happen after the band has contracted due to decrease of volatility; If prices break through the upper band, a continuation of the current trend is to be expected; If the pikes and hollows outside the band are followed by pikes and hollows inside the band, a reverse of trend may occur; The price movement that has sta
Fibonacci sequence is defined by integer sequence: 0, 1, 1, 2, 3, 5, 8, 13, 34, 55, 89, 144, ... By definition, it starts from 0 and 1, the next number is calculated as a sum of two previous numbers. Instead of the standard moving average, the indicator uses the caluclation of average price in form: Bar0 + Bar1 + Bar2 + Bar3 + Bar5 + Bar8 + Bar13 +... Input parameters:  FiboNumPeriod (15) - Fibonacci period; nAppliedPrice (0) - applied price (PRICE_CLOSE=0; PRICE_OPEN=1; PRICE_HIGH=2; PRICE_LOW
This indicator present a main Moving Average line with input parameters maPeriod_1, maMethod_1 and maAppPrice_1. The second line will be a calculation of the Moving Average data of a first line with input parameters maPeriod_2, maMethod_2. The third line will be a calculation of the Moving Average data of a second line with input parameters maPeriod_3, maMethod_3. To avoid a spontaneous entries one may use this indicator-stepper.
This indicator (as almost all others) is based on classical Moving Averages. It shows the Average Bar under the current bar colored in aqua or over the current bar colored in orange. Input Parameters: ma_Period and ma_Method. The Average Bar maybe helpful to predict where the price will move in the nearest future. Of course, this "near future" depends of the current time frame.
Buy when the market is falling and sell when the market is rising. When the market is moving down you start observing and looking for buy signals. When the market is moving up you start looking for sell signals. This indicator points to the moments to Buy (Blue arrow) and to Sell (Orange arrow). Two input parameters: barsNumber and step for optimization (depending on symbol and Time Frame).
This indicator shows: A green light in case the price goes up; A red light in case the price goes down; A yellow light in case there are a sideways trend. A sideways trend is the horizontal price movement that occurs when the forces of supply and demand are nearly equal. This typically occurs during a period of consolidation before the price continues a prior trend or reverses into a new trend
This indicator is created for M1 timeframe. It shows how many ticks has occurred during current minute and ( after the slash) the sum of points Up (aqua color) and Down (orange color). In times of a high trading activity a grow up number of ticks Up and Down will signal of a big move of the price in the near future. In times of a high trading activity a grow up number of sum of points Up and Down will signal of a big move of the price in the near future too.
Two yellow lines. This is similar to classical Envelopes but with automatic deviation. The Envelopes indicator is   a tool that attempts to identify the upper and lower bands of a trading range. Aqua line. This is a classical Commodity Channel Index added to the Envelopes on the chart, not in a separate window. The Commodity Channel Index ( CCI ) is a technical   indicator   that measures the difference between the current price and the historical average price.
Probability deals with the likelihood of an event happening.   Forex   probability indicates a possibility at a specific time. This is because the forex market is highly volatile, and predicting future events affecting it is impossible. This indicator will show a positive number above the current High or negative number under the current Low as a probability of the trend. Higher time frames usually show a higher probability, even more then 100%.
Envelopes is an excellent indicator when the market is trending. Open Long position when the ClosePrice crossed the upper Aqua band. Close Long position when the Price crossed the upper Yellow band moving down. Open Short position when the ClosePrice crossed the lower Aqua band. Close Short position when the Price crossed the lower Yellow band moving up.
Moving Average Bars is a self-explanatory indicator with one input parameter: nPeriod. When the previous Price Close is above the previous indicator Bar, the probability to go Long is very high.   When the previous Price Close is under the previous indicator Bar, the probability to go Short is very high.
This indicator is based on the same idea as https://www.mql5.com/en/market/product/2406 , but instead of Average Bars it uses series or Fibonacci sequence. When the previous Price Close is above the previous indicator Bar, the probability to go Long is very high. When the previous Price Close is under the previous indicator Bar, the probability to go Short is very high.
This indicator is based on two ideas: Correlations between 5 main currency pairs: EURUSD, GBPUSD, USDCHF, USDJPY, USDCAD; US Dollar Index = the value of the United States dollar relative to a basket of foreign currencies. The use of the indicator is the same as classical  Commodity Channel Index  (CCI) indicator. CCI is calculated with the following formula:  (Typical Price - Simple Moving Average) / (0.015 x Mean Deviation) (Typical Price - Simple Moving Average) / (0.015 x Mean Deviation)
A  tick  is a measure of the minimum upward or downward movement in the  price  of a security. A  tick  can also refer to the change in the  price  of a security from one trade to the next trade.  This indicator will show amounts of ticks when the price goes up and down. This indicator is designed for M1 time frame and shows: Sum of points when the price goes up (Green Histogram). Sum of points when the price goes down (Red Histogram). 
This indicator is a combination of 2 classical indicators MA and RVI. The Relative Vigor Index (RVI) is a momentum indicator used in technical analysis that measures the strength of a trend by comparing a security's closing price to its trading range while smoothing the results using a simple moving average   The input parameter  counted_bars  determines how many bars the indicator's lines will be visible. The input parameter MaRviPeriod  is used for MA and RVI calculation.
This indicator is a combination of 2 classical indicators: MA and Force Index. The input parameter  counted_bars  determines on how many bars the indicator lines will be visible. The input parameter  MaForcePeriod  is used for MA and Force calculation. You may go Long if the current price crossed Up the Ribbon (HISTOGRAM)  and you may go Short if the current price crossed Down the Ribbon (HISTOGRAM)
This indicator is a combination of 2 classical indicators: MA and CCI. Two moving averages form Upper and Lower bands. The input parameter  counted_bars  determines on how many bars the indicator's lines will be visible. The input parameter  barsNum  is used for MA and CCI calculation.
Filtrele:
twatanabe
306
twatanabe 2016.04.24 08:41 
 

Kullanıcı incelemeye herhangi bir yorum bırakmadı

Vadim Strelkov
7710
Vadim Strelkov 2014.05.06 15:11 
 

Kullanıcı incelemeye herhangi bir yorum bırakmadı

İncelemeye yanıt
Sürüm 2.5 2023.07.05
Updated by client request
Sürüm 2.4 2020.04.20
A new version, compiled by the latest MetaEditor build.