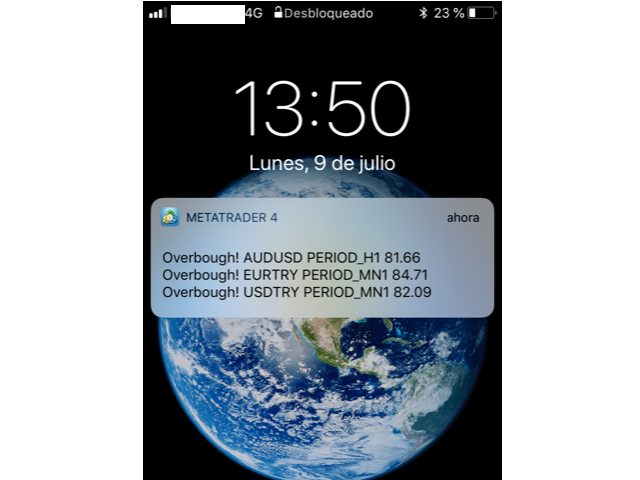
Email Mobile RSI Alert
- Göstergeler
- Jose Luis Lominchar
- Sürüm: 2.0
- Etkinleştirmeler: 5
- Simple indicator designed to send alerts to email and/or mobile (push notifications) if the RSI exceeds the overbought/oversold limits configured.
- Explore a series of timeframes and preset FOREX symbols, take note on those crosses where limits are exceeded, and send grouped notifications with the following customizable look:
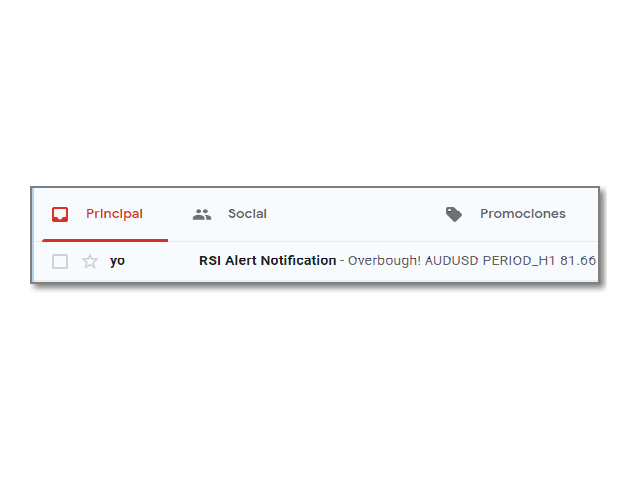
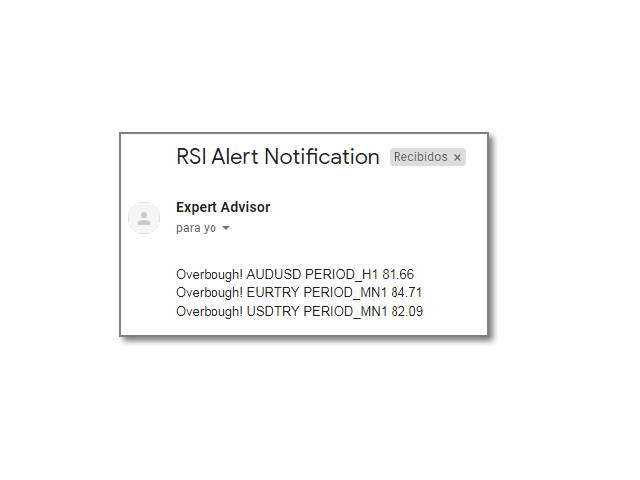
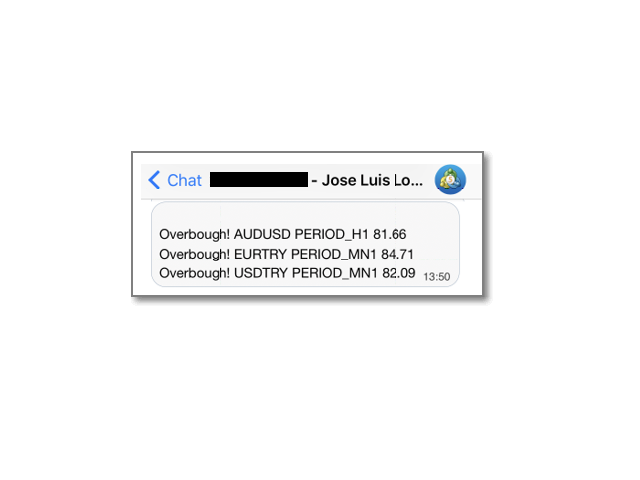
RSI Alert Notification
Oversoldl! EURUSD PERIOD_M15 14.71
Overbought! EURTRY PERIOD_MN1 84.71
Overbought! USDTRY PERIOD_MN1 82.09
- Works for the following periods:
- M15, M30, H1, H4, D1, W1, MN1
- Works for the following symbols:
- AUDCAD, AUDCHF, AUDJPY, AUDNZD, AUDUSD, CADCHF, CADJPY, CHFJPY,
- EURAUD, EURCAD, EURCHF, EURGBP, EURJPY, EURMXN, EURNOK, EURNZD, EURSEK, EURTRY, EURUSD,
- GBPAUD, GBPCAD, GBPCHF, GBPJPY, GBPMXN, GBPNOK, GBPNZD, GBPTRY, GBPUSD,
- NZDCAD, NZDCHF, NZDJPY, NZDUSD,
- USDCAD, USDCHF, USDJPY, USDMXN, USDNOK, USDSEK, USDSGD, USDTRY
Requirements
- In some versions of MetaTrader 4, it will be necessary to have downloaded the historical data for symbols. From Tools / History Center.
- It will be necessary from MetaTrader 4 to have mail reception enabled. From Tools / Options / Email.
- It will be necessary from MetaTrader 4 to have the reception of push notifications associated to our MetaQuotes ID enabled. From Tools / Options / Notifications.
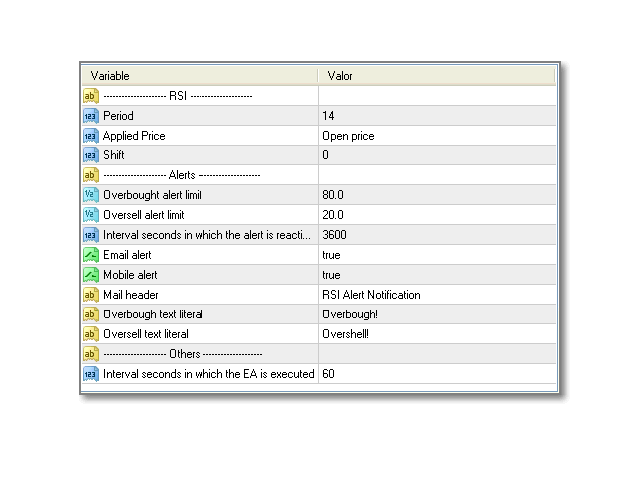
Parameters
- RSI:
- Period - Parameter 'Period' with which the iRsi is calculated. Normally 14 candles.
- Applied Price - Parameter 'Applied Price' with which the iRsi is calculated. It can be any of the following: price at candle opening, price at candle closing, etc.
- Shift - Parameter 'Shift' with which the iRsi is calculated. Where 0 is the current candle, 1 is the previous one, etc.
- Alerts:
- Overbought alert limit - Warning limit overbought once exceeded above is sent the overbought warning. Normally 70, 80, 85, etc.
- Oversold alert limit - Alert limit on overselling once exceeded below is sent oversold notice. Normally 30, 20, 15, etc.
- Interval seconds in which the alert is reactivated - Interval seconds in which alert is reactivated, so that the same notification is not repeated many times.
- Email alert - activate/deactivate notifications to the email.
- Mobile alert - activate/deactivate push notifications to the mobile.
- Mail header - Email header text that will be put in the subject of the email.
- Overbought text literal - Text that will appear in the overbought message.
- Oversold text literal - Text that will appear in the oversold message.
- Others:
- Interval seconds in which the EA is executed - To avoid stressing excessively the CPU of the computer in which the robot is running, it is possible to establish by means of this parameters the interval of seconds in which it remains inactive.