• Genel bakış
  • İncelemeler
  • Yorumlar
  • Yenilikler

M15 Indicator

Since a flat price stays within the same range and hardly moves, a horizontal or sideways trend can negatively affect the trade position

flat can also refer to a trade in which the currency pair has not moved significantly up or down and, therefore, has no large gain or loss attributed to the forex trading position.

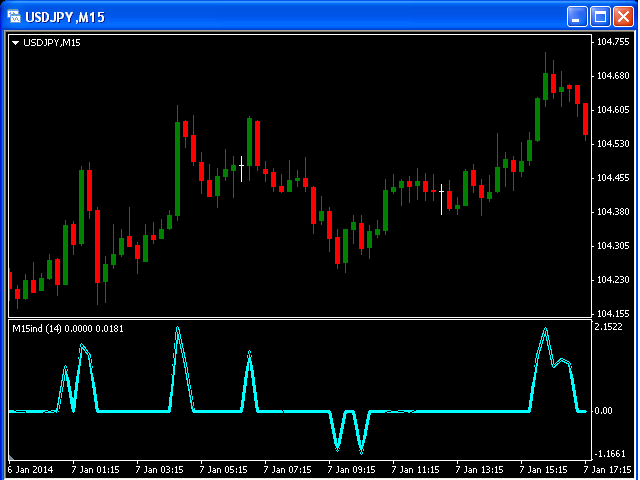
This Indicator is created for a M15 time frame.
The Zero-Line means a flat market. 
The positive and negative impulses indicate the Long and Short movements accordingly.

Önerilen ürünler
Trend PA
Mikhail Nazarenko
5 (3)
The Trend PA indicator uses   Price Action   and its own filtering algorithm to determine the trend. This approach helps to accurately determine entry points and the current trend on any timeframe. The indicator uses its own algorithm for analyzing price changes and Price Action. Which gives you the advantage of recognizing, without delay, a new nascent trend with fewer false positives. Trend filtering conditions can be selected in the settings individually for your trading style. The indicator
VR Cub
Vladimir Pastushak
VR Cub , yüksek kaliteli giriş noktaları elde etmenin bir göstergesidir. Gösterge, matematiksel hesaplamaları kolaylaştırmak ve bir pozisyona giriş noktalarının aranmasını basitleştirmek için geliştirildi. Göstergenin yazıldığı ticaret stratejisi uzun yıllardan beri etkinliğini kanıtlamaktadır. Ticaret stratejisinin basitliği, acemi yatırımcıların bile başarılı bir şekilde ticaret yapmasına olanak tanıyan büyük avantajıdır. VR Cub, pozisyon açılış noktalarını ve Kâr Al ve Zararı Durdur hedef sev
Gold Level MT4
Aleksandr Makarov
Gold Level MT4 A great helper for trading Gold. Levels do not repaint and do not change their data Levels are built every day, so you will trade every day with the indicator. Gold Level. Price markups are shown on the chart, after reaching TP1 or SL1, close half of the position, and the rest is transferred to breakeven. Any questions? Need help?, I am always happy to help, write me in private messages or in telegram.
Owl smart levels
Sergey Ermolov
4.63 (54)
MT5 versiyonu  |  FAQ Owl Smart Levels Indicator ,   Bill Williams'ın gelişmiş fraktalları , piyasanın doğru dalga yapısını oluşturan Valable ZigZag ve kesin giriş seviyelerini gösteren   Fibonacci seviyeleri   gibi popüler piyasa analiz araçlarını içeren tek gösterge içinde eksiksiz bir ticaret sistemidir. pazara ve kar elde edilecek yerlere. Stratejinin ayrıntılı açıklaması Gösterge ile çalışma talimatı Baykuş Yardımcısı ticaretinde Danışman Yardımcısı Kullanıcıların özel sohbeti -> Satın ald
The indicator detects and displays Shark harmonic pattern (see the screenshot). The pattern is plotted by the extreme values of the ZigZag indicator (included in the resources, no need to install). After detecting the pattern, the indicator notifies of that by a pop-up window, a mobile notification and an email. The indicator highlights the process of the pattern formation and not just the complete pattern. In the former case, it is displayed in the contour triangles. After the pattern is comple
Combined MT4
Ahmed Alaaeldin Abdulrahman Ahmed Elherzawi
Welcome to Investment Castle products   This product is exclusively available in the MQL5 market and is not available and will not be available anywehere else. The Combined indicator is a multi-time frame indicator and it is built using 3 indicators: Bands indicator which draws the support and resistance key levels   using up to 5 different time frames Patterns indicator which draws the chart patterns using up to 6 different time frames Spots indicator which shows the common candlestick pattern
Gösterge, tarihsel olanlarla karşılaştırılabilecek güncel teklifler oluşturur ve bu temelde bir fiyat hareketi tahmini yapar. Gösterge, istenen tarihe hızlı navigasyon için bir metin alanına sahiptir. Seçenekler: Sembol - göstergenin göstereceği sembolün seçimi; SymbolPeriod - göstergenin veri alacağı dönemin seçimi; GöstergeRenk - gösterge rengi; Ters - doğru tırnakları tersine çevirir, yanlış - orijinal görünüm; Sonraki, tarihi girebileceğiniz ve 'enter' tuşuna basa
The indicator displays the data of the Stochastic oscillator from a higher timeframe on the chart. The main and signal lines are displayed in a separate window. The stepped response is not smoothed. The indicator is useful for practicing "manual" forex trading strategies, which use the data from several screens with different timeframes of a single symbol. The indicator uses the settings that are identical to the standard ones, and a drop-down list for selecting the timeframe. Indicator Parame
The indicator detects and displays 3 Drives harmonic pattern (see the screenshot). The pattern is plotted by the extreme values of the ZigZag indicator (included in the resources, no need to install). After detecting the pattern, the indicator notifies of that by a pop-up window, a mobile notification and an email. The indicator highlights the process of the pattern formation and not just the complete pattern. In the former case, it is displayed in the contour triangles. After the pattern is com
Power Renko is an indicator which plots Renko bricks underneath the chart using a histogram. You can select the brick size and the timeframe of the Renko bricks as well as whether or not to use the close price or the high/low price of the candles. Renko bricks are based on price alone, not time, therefor the Renko bricks will not be aligned with the chart's time. They are extremely useful for trend trading and many different strategies can be formed from them. Buffers are provided allowing you t
Nice Trade Point
Muhammed Emin Ugur
This    Nice Trade Point     indicator is designed for signal trading. This indicator generates trend signals. It uses many algorithms and indicators to generate this signal. It tries to generate a signal from the points with the highest trend potential. This indicator is a complete trading product. This indicator does not need any additional indicators. The indicator certainly does not repaint. The point at which the signal is given does not change.     Features and Suggestions Time
Forex Indicator HTF Ichimoku for MT4 Ichimoku indicator is   one of the most powerful trend indicators .  H TF means -   H igher Time Frame This indicator is excellent for Trend Traders as well as combination with Price Action entries. HTF Ichimoku  Indicator allows you to attach Ichimoku from Higher time frame to your current chart. Up trend   - red line above blue one (and both lines are above cloud) /   Down trend   - red line below blue one  (and both lines are below cloud) Open BUY orders
Trend Ray
Andriy Sydoruk
The indicator shows the potential trend direction by cyclical-wave dependence. Thus, all the rays of the intersection will be optimal rays, in the direction of which the price is expected to move, taking into account the indicator period. Rays can be used as a direction for potential market movement. But we must not forget that the approach must be comprehensive, the indicator signals require additional information to enter the market.
Download the free version   here. Divergence Divergence refers to when the price of a currency pair moves in one direction while the trend indicator is moving in the opposite direction. With divergence, there can be positive and negative signals. Divergences in Forex trading are quite common signals of technical analysis. These are basic early Forex signals indicating the trend reversal and filter false signals. Application of this indicator It is usually not easy to detect divergences by the t
ZhiBiCCI MT4
Qiuyang Zheng
5 (1)
[ZhiBiCCI] indicators are suitable for all cycle use, and are also suitable for all market varieties. [ZhiBiCCI] Green solid line is a reversal of bullish divergence. The green dotted line is a classic bullish divergence. [ZhiBiCCI] The solid line to the red is a reverse bearish divergence. The red dotted line is a classical bearish divergence. [ZhiBiCCI] can be set in the parameters (Alert, Send mail, Send notification), set to (true) to send instant signals to the alarm window, email, in
Based on MACD indicator waves with standard parameters Applies Fibonacci levels to the last two MACD waves, positive and negative respectively, if at the moment the MACD indicator runs out of negative Wave - the color is green, if at the moment the MACD indicator runs out of positive Wave - the color is red. The Wave termination criterion is two ticks with a different MACD sign. Applies trend lines on the last four MACD Waves. Works well with the expert Figures MACD   https://www.mql5.com/ru/mar
Magic Balance
Daniil Evstratenko
The indicator shows which trading pairs, strategies, robots and signals that you use are profitable and which are not. The statistic of trades and balance graph are displayed in the account currency and pips - to switch simply click on the graph. button "$"(top left) - minimize/expand and move the indicator panel button ">"(bottom right) - stretching and resetting to the original size Statistic of trades 1 line - account balance, current profit and lot of open trades; 2 line - the number of al
"Adjustable Fractals" - is an advanced version of fractal indicator, very useful trading tool! As we know   Standard fractals mt4 indicator does not have settings at all   - this is very inconvenient for traders Adjustable Fractals has resolved that issue - it has all necessary settings: Adjustable period   of indicator (recommended values - above 7) Adjustable distance   from Highs/Lows of price Adjustable design   af fractal arrows // More great Expert Advisors and Indicators are available he
The indicator detects and displays М. Gartley's Butterfly pattern. The pattern is plotted by the extreme values of the ZigZag indicator (included in the resources, no need to install). After detecting the pattern, the indicator notifies of that by the pop-up window, a mobile notification and an email. The pattern and wave parameters are displayed on the screenshots. The default parameters are used for demonstration purposes only in order to increase the amount of detected patterns. Parameters
This indicator is the undisputed leader among the indicators. And for this statement there is a good reason. The indicator builds a very high quality channel in which it generates signals to enter! What is the ideal strategy for the trader, since the trader always hesitates when choosing a strategy for the job. That is, this indicator will allow you to solve the dilemma of choosing a job by trend or to the channel, since it combines these two basic concepts. Working with the indicator is very
RSX Signal 2 AM
Andriy Matviyevs'kyy
The indicator displays the signals of the RSX oscillator on the price chart. (To display these signals in a separate window, along with the oscillator, another indicator is used -  RSX Osc 4 AM ). It is optimal to use the indicator signals as signals to open a trade when the price overcomes the maximum or minimum of the bar at which the signal was given. An opposite signal cancels the previous signal. Settings: Data period for indicator calculation - data period for indicator calculation; Data
FREE
LordChannel
Igor Pereira Calil
LordChannel is an indicator for META TRADER 4 for all forex pairs and financial market metals. The indicator is used to make detections of high/low channels, implementing a technical analysis on possible breakouts and making correct order entries. LordChannel sends signals such as buy and sell in the graphical analysis, it is important to emphasize that the importance of these signals are safe in TIME FRAMES M30, H1, H4. The indicator was created for using bullish/downtrend channels to co
The main idea of this indicator is rates analysis and prediction by Fourier transform. Indicator decomposes exchange rates into main harmonics and calculates their product in future. You may use the indicator as a standalone product, but for better prediction accuracy there is another related indicator - FreqoMaster - which uses FreqoMeterForecast as a backend engine and combines several instances of FreqoMeterForecast for different frequency bands. Parameters: iPeriod - number of bars in the ma
COG LR Osc AM
Andriy Matviyevs'kyy
The presented indicator allows you to determine potential entry points into the market and set protective orders at reasonable levels. This product can be useful for both beginners and experienced traders. The indicator is based on calculation methods proven by time and practicing traders. The indicator is calculated in two stages: At the first stage, linear regression (LR) of the selected price type is determined for a given number of chart periods. At the second stage, the obtained data is p
Trendiness Index
Libertas LLC
5 (3)
"The trend is your friend" is one of the best known sayings in investing, because capturing large trendy price movements can be extremely profitable. However, trading with the trend is often easier said than done, because many indicators are based on price reversals not trends. These aren't very effective at identifying trendy periods, or predicting whether trends will continue. We developed the Trendiness Index to help address this problem by indicating the strength and direction of price trend
Forex scalping indicator that does not redraw its arrows. It works best on M5, M15, M30, H1 timeframes. The default settings are for M5 timeframe. The picture below shows an example of working on the H1 chart with the "period=0.35" parameter value. You can download the demo version and test it yourself. Now we use the signals of this indicator in almost all of our scalping strategies. According to our calculations, the accuracy of its signals is about 95% depending on the timeframe. The indicato
Trend Scanner
Vladimir Kalendzhyan
4.38 (8)
By purchasing this indicator, you have the right to receive a free copy of one of   my other indicator's or advisor’s!  (All future updates are included. No limits) . To get it , please contact me by  mql5 message ! The Trend Scanner trend line indicator displays the trend direction and its changes. The indicator works on all currency pairs and  timeframes. The indicator simultaneously displays multiple readings on the price chart: the support and resistance lines of the currency pair, the exist
The Divergent Accuracy indicator is designed to identify discrepancies on the price chart of a currency pair. The Divergent Accuracy indicator recognizes bullish and bearish divergences, and can also output a signal that a divergence has been detected... In addition to identifying divergences, the indicator works with overbought and oversold levels, and also shows arrows to enter the market...
TrendPlus
Sivakumar Subbaiya
4.21 (14)
Trend Plus   Trendplus  Indicator   Time Frame: Suitable for any time frame.  Purpose: Trend Prediction. Blue and red candle indicate the buy and sell call respectively. Buy: When the blue candle is formed buy call is initiated. close the buy trades when the next red candle will formed.   Sell: When the Red candle is formed Sell call is initiated. close the Sell trades when the next blue candle will formed.   Happy trade!!
FREE
Colored trend indicator advanced is a trend indicator that is based on Fast Moving Average and Slow Moving Average and also uses RSI and Momentum to give a trend strength in percent. It is aimed to find more healthy trends with this indicator. This indicator can be used alone as a trend indicator. Colors (Default) Green = Uptrend (Default) Red = Downtrend No color = No trend, no good trend Indicator Parameters WarnPosTrendchange: Warns you when the trend may change. FullColor: See screenshot
Bu ürünün alıcıları ayrıca şunları da satın alıyor
Gann Made Easy
Oleg Rodin
4.96 (47)
Gann Made Easy , bay teorisini kullanarak ticaretin en iyi ilkelerine dayanan, profesyonel ve kullanımı kolay bir Forex ticaret sistemidir. WD Gann. Gösterge, Zararı Durdur ve Kâr Al Seviyeleri dahil olmak üzere doğru SATIN AL ve SAT sinyalleri sağlar. PUSH bildirimlerini kullanarak hareket halindeyken bile işlem yapabilirsiniz. Lütfen satın aldıktan sonra benimle iletişime geçin! Alım satım ipuçlarımı ve harika bonus göstergelerini ücretsiz olarak sizinle paylaşacağım! Muhtemelen Gann ticaret y
Atomic Analyst
Issam Kassas
5 (1)
Öncelikle belirtmek gerekir ki bu Ticaret Göstergesi Yeniden Çizim Yapmaz, Gecikmez ve Gecikme Göstermez, bu da hem manuel hem de robot ticareti için ideal hale getirir. Atom Analisti, Piyasada Daha İyi Bir Avantaj Bulmak İçin Fiyatın Gücünü ve Momentumunu Kullanan PA Fiyat Hareketi Göstergesidir. Gürültüleri ve Yanlış Sinyalleri Kaldırmaya ve Ticaret Potansiyelini Artırmaya Yardımcı Olan Gelişmiş Filtrelerle Donatılmıştır. Birden fazla katmanlı karmaşık göstergeler kullanarak, Atom Analisti
ŞU ANDA %26 INDIRIMLI Yeni Başlayanlar veya Uzman Tüccarlar için En İyi Çözüm! Bu Gösterge benzersiz, yüksek kaliteli ve uygun fiyatlı bir ticaret aracıdır çünkü bir dizi tescilli özellik ve yeni bir formül ekledik. Sadece BİR grafik ile 28 Forex çifti için Döviz Gücünü okuyabilirsiniz! Yeni bir trendin veya scalping fırsatının tam tetik noktasını belirleyebildiğiniz için ticaretinizin nasıl gelişeceğini hayal edin? Kullanım kılavuzu: buraya tıklayın Bu ilk olan, orijinal! Değersiz bir
Öncelikle, bu Ticaret Aracının Non-Repainting, Non-Redrawing ve Non-Lagging Gösterge olduğunu vurgulamakta fayda var, bu da onu profesyonel ticaret için ideal hale getiriyor. Akıllı Fiyat Hareketi Kavramları Göstergesi, hem yeni hem de deneyimli tüccarlar için çok güçlü bir araçtır. İleri ticaret fikirlerini, Inner Circle Trader Analizi ve Smart Money Concepts Ticaret Stratejileri gibi 20'den fazla kullanışlı göstergeyi bir araya getirerek bir araya getirir. Bu gösterge, büyük kurumların tica
Scalper Vault
Oleg Rodin
5 (27)
Scalper Vault , başarılı bir scalping için ihtiyacınız olan her şeyi size sağlayan profesyonel bir scalping sistemidir. Bu gösterge, forex ve ikili opsiyon tüccarları tarafından kullanılabilecek eksiksiz bir ticaret sistemidir. Önerilen zaman çerçevesi M5'tir. Sistem size trend yönünde doğru ok sinyalleri sağlar. Ayrıca size üst ve alt sinyaller ve Gann piyasa seviyeleri sağlar. Göstergeler, PUSH bildirimleri dahil her türlü uyarıyı sağlar. Göstergeyi satın aldıktan sonra lütfen benimle iletişim
TPSproTREND PrO
Roman Podpora
5 (15)
TPSpro TRENDPRO  - is a trend indicator that automatically analyzes the market and provides information about the trend and each of its changes, as well as giving signals for entering trades without redrawing! The indicator uses each candle, analyzing them separately. referring to different impulses - up or down impulse. Exact entry points into transactions for currencies, crypto, metals, stocks, indices!  -  Version MT5               DETAILED DESCRIPTION        /       TRADING SETUPS           
Trend Screener
STE S.S.COMPANY
4.83 (86)
Trend Göstergesi, Trend Alım Satım ve Filtreleme için Çığır Açan Benzersiz Çözüm, Tüm Önemli Trend Özellikleriyle Tek Bir Araç İçinde Yerleştirildi! Forex, emtialar, kripto para birimleri, endeksler ve hisse senetleri gibi tüm sembollerde/araçlarda kullanılabilen %100 yeniden boyamayan çoklu zaman çerçevesi ve Çoklu para birimi göstergesidir. Trend Screener, grafikte noktalarla ok trend sinyalleri sağlayan etkili bir trend trend göstergesidir. Trend analizörü göstergesinde bulunan özellikler: 1.
Şu anda %20 İNDİRİMLİ! Herhangi bir Acemi veya Uzman Tüccar için En İyi Çözüm! Bu gösterge paneli yazılımı 28 döviz çifti üzerinde çalışıyor. Ana göstergelerimizden 2'sine (Gelişmiş Para Birimi Gücü 28 ve Gelişmiş Para Birimi Dürtüsü) dayanmaktadır. Tüm Forex piyasasına harika bir genel bakış sağlar. Gelişmiş Para Birimi Gücü değerlerini, para birimi hareket hızını ve tüm (9) zaman dilimlerinde 28 Forex çifti için sinyalleri gösterir. Trendleri ve / veya scalping fırsatlarını belirlemek içi
Scalper Inside PRO
Alexey Minkov
4.75 (55)
SALE NOW! Limited Time Offer! An exclusive indicator that utilizes an innovative algorithm to swiftly and accurately determine the market trend. The indicator automatically calculates opening, closing, and profit levels, providing detailed trading statistics. With these features, you can choose the most appropriate trading instrument for the current market conditions. Additionally, you can easily integrate your own arrow indicators into Scalper Inside Pro to quickly evaluate their statistics and
Fiyat tersine döndükçe ve geri çekildikçe piyasa yapısından elde edilen kâr değişir. Piyasa yapısını tersine çevirme uyarısı göstergesi, bir trendin veya fiyat hareketinin ne zaman tükenmeye yaklaştığını ve tersine dönmeye hazır olduğunu tanımlar. Genellikle bir geri dönüş veya büyük bir geri çekilme meydana gelmek üzereyken meydana gelen piyasa yapısındaki değişiklikler konusunda sizi uyarır. Gösterge, olası bir tükenme noktasının yakınında her yeni yüksek veya düşük oluştuğunda, başlangıçta
TPSpro RFI Levels
Roman Podpora
5 (13)
A key element in trading is zones or levels from which decisions to buy or sell a trading instrument are made. Despite attempts by major players to conceal their presence in the market, they inevitably leave traces. Our task was to learn how to identify these traces and interpret them correctly. Reversal First Impulse levels (RFI)   -  Version MT5                INSTRUCTIONS                 RUS                 ENG                                       R ecommended to use with an indicator   -  
Tanıtım       Kuantum Trend Keskin Nişancı Göstergesi   , trend tersine dönmeleri belirleme ve ticaret yapma şeklinizi değiştiren çığır açan MQL5 Göstergesi! 13 yılı aşkın ticaret tecrübesine sahip deneyimli tüccarlardan oluşan bir ekip tarafından geliştirilmiştir.       Kuantum Trend Keskin Nişancı Göstergesi       trend dönüşlerini son derece yüksek doğrulukla belirlemenin yenilikçi yolu ile ticaret yolculuğunuzu yeni zirvelere taşımak için tasarlanmıştır. ***Kuantum Trend Keskin Nişancı Gö
Quantum Breakout Indicator PRO
Bogdan Ion Puscasu
4.96 (26)
Tanıtım       Quantum Breakout PRO   , Breakout Bölgeleri ile ticaret yapma şeklinizi değiştiren çığır açan MQL5 Göstergesi! 13 yılı aşkın ticaret deneyimine sahip deneyimli tüccarlardan oluşan bir ekip tarafından geliştirilen   Quantum Breakout PRO   , yenilikçi ve dinamik koparma bölgesi stratejisiyle ticaret yolculuğunuzu yeni zirvelere taşımak için tasarlanmıştır. Kuantum Breakout Göstergesi, size 5 kar hedefi bölgesi ile kırılma bölgelerinde sinyal okları ve kırılma kutusuna dayalı ol
Advanced Supply Demand
Bernhard Schweigert
4.92 (310)
CURRENTLY 26% OFF !! Best Solution for any Newbie or Expert Trader! This indicator is a unique, high quality and affordable trading tool because we have incorporated a number of proprietary features and a new formula. With this update, you will be able to show double timeframe zones. You will not only be able to show a higher TF but to show both, the chart TF, PLUS the higher TF: SHOWING NESTED ZONES. All Supply Demand traders will love it. :) Important Information Revealed Maximize the potenti
Özel MT4 göstergemizle başarılı forex ticaretinin sırrını keşfedin! Forex piyasasında nasıl başarıya ulaşacağınızı hiç merak ettiniz, riski en aza indirirken sürekli olarak kar kazandınız mı? İşte aradığınız cevap! Ticaret yaklaşımınızda devrim yaratacak tescilli MT4 göstergimizi tanıtmamıza izin verin. Benzersiz çok yönlülük Göstergemiz, Renko ve RangeBar Mum oluşumlarını tercih eden kullanıcılar için özel olarak tasarlanmıştır. Bu grafik türlerinin birçok deneyimli tüccar tarafından ter
Mucizevi Forex Göstergesi Tanıtımı: Keskin Ticaretin Gücünü Serbest Bırakın Tüm zaman dilimlerinde gerçekten olağanüstü sonuçlar sunan en iyi Forex göstergesini aramaktan sıkıldınız mı? Artık aramayın! Mucizevi Forex Göstergesi, ticaret deneyiminizi devrimleştirip kazançlarınızı yeni zirvelere taşımak için burada. Gelişmiş teknoloji ve yılların özenli geliştirmesi temelinde Mucizevi Forex Göstergesi, döviz piyasasında güç ve keskinlik açısından doruğa çıkar. Bu olağanüstü araç, tüm seviyelerdeki
Break and Retest
Mohamed Hassan
5 (2)
Break & Retest is unstoppable when combined with our other divergence indicator. After purchase, send us a message and you could get this  2nd indicator  for  FREE  as a  BONUS! ‍You can visually backtest Break & Retest to see how it behaved in the past!    Manual guide:   Click here $59  for the first 25 copies ( 4  left)! Next price is $120 .  After many months of hard work and dedication, we are extremely proud to present you our  Break and Retest price action indicator crea
Entry Points Pro
Yury Orlov
4.7 (225)
Yeniden boyamadan bir ticarete girmek için doğru sinyaller sağlayan MT5 için en iyi gösterge! Herhangi bir finansal varlığa uygulanabilir: forex, kripto para birimleri, metaller, hisse senetleri, endeksler. MT5 versiyonu burada Oldukça doğru alım satım sinyalleri sağlayacak ve bir alım satımı açıp kapatmanın en iyi zamanını size söyleyecektir. Göstergeyi ödeyen yalnızca bir sinyali işleme örneğiyle videoyu (6:22) izleyin! Çoğu tüccar, Giriş Noktaları Pro göstergesinin yardımıyla ilk işl
Currency Strength Wizard , başarılı ticaret için size hepsi bir arada çözüm sağlayan çok güçlü bir göstergedir. Gösterge, birden çok zaman dilimindeki tüm para birimlerinin verilerini kullanarak şu veya bu forex çiftinin gücünü hesaplar. Bu veriler, şu veya bu para biriminin gücünü görmek için kullanabileceğiniz, kullanımı kolay para birimi endeksi ve para birimi güç hatları biçiminde temsil edilir. İhtiyacınız olan tek şey, işlem yapmak istediğiniz tabloya göstergeyi eklemektir ve gösterge size
TrendMaestro
Stefano Frisetti
5 (2)
note: this indicator is for METATRADER4, if you want the version for METATRADER5 this is the link: TRENDMAESTRO recognizes a new TREND in the bud, he never makes mistakes. The certainty of identifying a new TREND is priceless. DESCRIPTION TRENDMAESTRO identifies a new TREND in the bud, this indicator examines the volatility, volumes and momentum to identify the moment in which there is an explosion of one or more of these data and therefore the moment in which prices have strong probability of f
TrendDecoder Premium
Christophe, Pa Trouillas
5 (3)
Aralıkları ve bir sonraki olası hamleleri belirleyin   |  Trendlerin en erken sinyallerini ve gücünü alın   |  Geri dönüşten önce net çıkışlar alın   |  Fiyatın test edeceği Fibo seviyelerini tespit edin Gecikmesiz, takip edilmeyen gösterge - manuel ve otomatik ticaret için ideal - tüm varlıklar ve tüm zaman birimleri için uygun Sınırlı süreli teklif >>   %50 İNDİRİM Satın aldıktan sonra, kişiselleştirilmiş ayarlar için bu kanaldan benimle iletişime geçin . MT5   sürümü:   buraya tıklayın Tam y
ÇOKLU PARA BİRİMİ ve ÇOK ZAMANLI ÇERÇEVE ALIM VE SATIŞ UYARISI. OTOMATİK TAKİP DURDURMA VE RİSK ÖDÜLÜ KÂR AL! GÖSTERGE TARAMALARI VE PİYASAYI ANALİZ ETMEK, YAPACAK BİR ŞEYİNİZ YOK! TÜM PARA BİRİMLERİNİZİ 1 GRAFİKTE İŞLEM YAPIN!   Satın aldıktan sonra lütfen yorum bırakın benimle iletişime geçin, size ticaret asistanı EA'yı göndereceğim. Gösterge, en iyi ONAYLANMIŞ giriş noktalarını bulmak için çeşitli Osilatörler ve ekli filtreler kullanıyor, bu nedenle bu konuda endişelenmenize gerek yok
FX Power MT4 NG
Daniel Stein
5 (8)
Sabah Brifingimiz burada mql5 ve on Telegram! FX Power MT4 NG , uzun zamandır çok popüler olan döviz gücü ölçerimiz FX Power'ın yeni neslidir. Peki bu yeni nesil güç ölçer ne sunuyor? Orijinal FX Power hakkında sevdiğiniz her şey PLUS GOLD/XAU güç analizi Daha da hassas hesaplama sonuçları Ayrı ayrı yapılandırılabilir analiz dönemleri Daha da iyi performans için özelleştirilebilir hesaplama limiti Özel çokluDaha fazlasını görmek isteyenler için örnek ayarlar Her grafikte en sevdiğiniz renkler i
Trend Forecasting
Mohamed Hassan
5 (15)
This indicator is unstoppable when combined with our other indicator called Katana. After purchase, send us a message and you could get Katana for FREE as a BONUS After purchase, send us a private message for your instructions.  MT5 version: click here 3 copies left available at $45. Next price is $99. Don't miss this great deal!  The Trend Forecasting indicator is a very unique & easy tool that is able to make prediction about future price movement based on the signals generated
Price Action Entry Alerts
Stephen Sanjeeve Sahayam
5 (3)
Bu gösterge, alış veya satış baskısı için her çubuğu tarar ve en yüksek hacme sahip 4 tip mum modelini tanımlar. Bu mumlar daha sonra Alış veya Satış sinyallerini göstermek için birkaç doğrusal filtre kullanılarak filtrelenir. Sinyaller, daha yüksek zaman çerçevesi yönüyle bağlantılı olarak ve yüksek hacimli saatlerde alım satım yapıldığında en iyi sonucu verir. Tüm filtreler özelleştirilebilir ve bağımsız çalışır. Bir düğmeyi tıklayarak tek bir yönün sinyallerini görüntüleyebilir. Bu gösterge
ŞU ANDA %31 INDIRIMLI !!! Yeni Başlayanlar veya Uzman Tüccarlar için En İyi Çözüm! Bu gösterge benzersiz, yüksek kaliteli ve uygun fiyatlı bir ticaret aracıdır çünkü bir dizi tescilli özellik ve gizli bir formül ekledik. Yalnızca BİR grafikle 28 döviz çiftinin tümü için Uyarılar verir. Yeni bir trendin veya scalping fırsatının tam tetik noktasını belirleyebildiğiniz için ticaretinizin nasıl gelişeceğini hayal edin! Yeni temel algoritmalar üzerine inşa edilen bu sistem, potansiyel işlemler
FX Volume
Daniel Stein
4.6 (35)
Sabah Brifingimiz aracılığıyla ayrıntılar ve ekran görüntüleri ile günlük piyasa güncellemenizi alın burada mql5 ve on Telegram ! FX Volume, bir brokerin bakış açısından piyasa duyarlılığı hakkında GERÇEK bir fikir veren İLK ve TEK hacim göstergesidir. COT raporlarından çok daha hızlı bir şekilde, brokerlar gibi kurumsal piyasa katılımcılarının Forex piyasasında nasıl konumlandıklarına dair harika bilgiler sağlar. Bu bilgileri doğrudan grafiğinizde görmek, ticaretiniz için gerçek oyun değiştir
Up down v6T
Guner Koca
5 (1)
Thise indicator is up down v6  comes with tradingwiev version. purchased people, after installed on terminal ,contact me on mql5  to get BONUS  TradingView version. up-down indicator is no repaint and works all pairs and lower than weekly time frames charts. it is suitable also 1 m charts for all pairs. and hold long way to signal. dont gives too many signals. when red histogram cross trigger line that is up signal.and price probably will down when blue histogram cross trigger line that is dow
Grafiğinizde otomatik olarak destek ve direnç seviyeleri PLUS itici mum boşlukları çizin, böylece fiyatın nereye gidebileceğini ve / veya potansiyel olarak tersine dönebileceğini görebilirsiniz. Bu gösterge, web sitemde (The Market Structure Trader) öğretilen pozisyon ticareti metodolojisinin bir parçası olarak kullanılmak üzere tasarlanmıştır ve hedefleme ve potansiyel girişler için temel bilgileri görüntüler. Göstergede 2 TEMEL özellik ve 4 ek özellik bulunmaktadır: TEMEL ÖZELLİK 1 - Günl
How to use Pair Trading Station Pair Trading Station is recommended for H1 time frame and you can use it for any currency pairs. To generate buy and sell signal, follow few steps below to apply Pair Trading Station to your MetaTrader terminal. When you load Pair Trading Station on your chart, Pair Trading station will assess available historical data in your MetaTrader platforms for each currency pair. On your chart, the amount of historical data available will be displayed for each currency pai
Yazarın diğer ürünleri
This indicator is based on a classic Commodity Channel Index (CCI) indicator. Multi TimeFrame indicator MTF-CCI shows CCI data from the 4 timeframes by your choice. By default this indicator has external parameters: TF1 = 1; TimeFrame2b = true; TF2 = 5; TimeFrame3b = true; TF3 = 15; TimeFrame4b = true; TF4 = 60; InpPeriod = 13; InpPRICE = 5; You can change TF1-TF4 in the next limits: TF1 from M1 (1) to H4 (240) TF2 from M5 (5) to D1 (1440) TF3 from M15 (15) to W1 (10080) TF4 from M30 (30) to MN1
This Multi TimeFrame indicator is based on the "Fractals" classical indicator. 2 Inputs: TimeFrame1; TimeFrame2; You can put any available TimeFrame values (from M1 (Period_M1) to MN1 (Period_MN1)) equal or greater ( >= ) than the Period of the current Time Frame. The last Fractals will shown as color lines (Dots Line) of Support and Resistance for the Price moving.
This is a Multi-Time indicator which allows to display RSI and Stochastic indicators from upper timeframes on a single chart. As an example: a single chart EURUSD M5 and RSI (blue line) and Stochastic (yellow line) from H1. Red Histogram is representing Lower trend and Green Histogram is representing Upper trend.
When you put this Multi TimeFrame Parabolic SAR indicator on the chart it will automatically use Parabolic SAR from next available 3 timeframes. Green arrow will show the beginning of Up trend and Red arrow will show the beginning of Down trend. If AlertsEnabled = true, the indicator will show the Alert (message window) with a text like this: "Price going Down on ", Symbol(), " - ", Period(), " min", " price = ", Bid; If eMailEnabled = true the Indicator will send you an eMail with the same text
The zero line is characterized the Flat trend. V-shaped impulse indicates the entrance to the opposite direction. U-shaped impulse = entry orders in the same direction. If AlertsEnabled = true, the indicator will show the Alert (message window) with a text like this: "Price going Down on ", Symbol(), " - ", Period(), " min", " price = ", Bid; If eMailEnabled = true the indicator will send you an eMail with the same text an Alert message with subject: "Trinity-Impolse" (of course you have to
The indicator displays the usual Moving Average with input parameters: maPeriod_1; maMethod_1; maAppPrice_1. Then it calculates and displays MA on MA1 with input parameters: maPeriod_2; maMethod_2. Then it calculates and displays MA on MA2 with input parameters: maPeriod_3; maMethod_3. If AlertsEnabled = true the Indicator will show the Alert (message window) with a text like this: "Price going Down on ", Symbol(), " - ", Period(), " min", " price = ", Bid; If eMailEnabled = true the Indicator w
Multi TimeFrame Indicator "MTF CCI Trigger" based on the Commodity Channel Index from the upper TF (input parameter "TimeFrame") yellow line. Aqua line is representing ATR envelopes from the current TF. Green and Red arrows is triggered by CCI and represented UP and DOWN trends accordingly.
The BBImpulse indicator is based on the standard Moving Average indicator. You have MA input parameters: maPeriod - Moving Average period; maMODE - Moving Average mode (0 = MODE_SMA; 1 = MODE_EMA; 2 = MODE_SMMA; 3 = MODE_LWMA); maPRICE - Applied price (0=PRICE_CLOSE; 1=PRICE_OPEN; 2=PRICE_HIGH; 3=PRICE_LOW; 4=PRICE_MEDIAN; 5=PRICE_TYPICAL; 6=PRICE_WEIGHTED). Green Histogram is representing an UP-trend, Red Histogram is representing a Down-trend.
Multi TimeFrame indicator MTF ADX with Histogram shows ADX indicator data from the TF by your choice. You may choose a TimeFrame equal or greater than current TF. Yellow line is representing a price trend from the upper TF. Green line is representing +DI from the upper TF. Red line is representing -DI from the upper TF. Green histogram is displaying an Up-trend. Red histogram is displaying a Down-trend.
This Indicator creates 2 white lines based on Exponential Moving Averag e of High and Low prices. You can regulate how many bars will be involved in the calculation with input parameter HL_Period. Red and Blue arrows are displaying the moment to go Short and Long trades accordingly.
The most common way to interpreting the price Moving Average is to compare its dynamics to the price action. When the instrument price rises above its Moving Average, a buy signal appears, if the price falls below its moving average, what we have is a sell signal. To avoid a spontaneous entries one may use this update from Moving Average Indicator = Stepper-MA.
Envelopes technical Indicator is formed with two Moving Averages one of which is shifted upward and another one is shifted downward. Envelopes define the upper and the lower margins of the price range. Signal to sell appears when the price reaches the upper margin of the band; signal to buy appears when the price reaches the lower margin. To avoid a spontaneous entries one may use this update from Envelopes Indicator = Envelopes-Stepper.
The interpretation of the Bollinger Bands is based on the fact that the prices tend to remain in between the top and the bottom line of the bands. Abrupt changes in prices tend to happen after the band has contracted due to decrease of volatility; If prices break through the upper band, a continuation of the current trend is to be expected; If the pikes and hollows outside the band are followed by pikes and hollows inside the band, a reverse of trend may occur; The price movement that has sta
Fibonacci sequence is defined by integer sequence: 0, 1, 1, 2, 3, 5, 8, 13, 34, 55, 89, 144, ... By definition, it starts from 0 and 1, the next number is calculated as a sum of two previous numbers. Instead of the standard moving average, the indicator uses the caluclation of average price in form: Bar0 + Bar1 + Bar2 + Bar3 + Bar5 + Bar8 + Bar13 +... Input parameters:  FiboNumPeriod (15) - Fibonacci period; nAppliedPrice (0) - applied price (PRICE_CLOSE=0; PRICE_OPEN=1; PRICE_HIGH=2; PRICE_LOW
This indicator present a main Moving Average line with input parameters maPeriod_1, maMethod_1 and maAppPrice_1. The second line will be a calculation of the Moving Average data of a first line with input parameters maPeriod_2, maMethod_2. The third line will be a calculation of the Moving Average data of a second line with input parameters maPeriod_3, maMethod_3. To avoid a spontaneous entries one may use this indicator-stepper.
This indicator (as almost all others) is based on classical Moving Averages. It shows the Average Bar under the current bar colored in aqua or over the current bar colored in orange. Input Parameters: ma_Period and ma_Method. The Average Bar maybe helpful to predict where the price will move in the nearest future. Of course, this "near future" depends of the current time frame.
Buy when the market is falling and sell when the market is rising. When the market is moving down you start observing and looking for buy signals. When the market is moving up you start looking for sell signals. This indicator points to the moments to Buy (Blue arrow) and to Sell (Orange arrow). Two input parameters: barsNumber and step for optimization (depending on symbol and Time Frame).
This indicator shows: A green light in case the price goes up; A red light in case the price goes down; A yellow light in case there are a sideways trend. A sideways trend is the horizontal price movement that occurs when the forces of supply and demand are nearly equal. This typically occurs during a period of consolidation before the price continues a prior trend or reverses into a new trend
This indicator is created for M1 timeframe. It shows how many ticks has occurred during current minute and ( after the slash) the sum of points Up (aqua color) and Down (orange color). In times of a high trading activity a grow up number of ticks Up and Down will signal of a big move of the price in the near future. In times of a high trading activity a grow up number of sum of points Up and Down will signal of a big move of the price in the near future too.
Two yellow lines. This is similar to classical Envelopes but with automatic deviation. The Envelopes indicator is   a tool that attempts to identify the upper and lower bands of a trading range. Aqua line. This is a classical Commodity Channel Index added to the Envelopes on the chart, not in a separate window. The Commodity Channel Index ( CCI ) is a technical   indicator   that measures the difference between the current price and the historical average price.
Probability deals with the likelihood of an event happening.   Forex   probability indicates a possibility at a specific time. This is because the forex market is highly volatile, and predicting future events affecting it is impossible. This indicator will show a positive number above the current High or negative number under the current Low as a probability of the trend. Higher time frames usually show a higher probability, even more then 100%.
Envelopes is an excellent indicator when the market is trending. Open Long position when the ClosePrice crossed the upper Aqua band. Close Long position when the Price crossed the upper Yellow band moving down. Open Short position when the ClosePrice crossed the lower Aqua band. Close Short position when the Price crossed the lower Yellow band moving up.
Moving Average Bars is a self-explanatory indicator with one input parameter: nPeriod. When the previous Price Close is above the previous indicator Bar, the probability to go Long is very high.   When the previous Price Close is under the previous indicator Bar, the probability to go Short is very high.
This indicator is based on the same idea as https://www.mql5.com/en/market/product/2406 , but instead of Average Bars it uses series or Fibonacci sequence. When the previous Price Close is above the previous indicator Bar, the probability to go Long is very high. When the previous Price Close is under the previous indicator Bar, the probability to go Short is very high.
This indicator is based on two ideas: Correlations between 5 main currency pairs: EURUSD, GBPUSD, USDCHF, USDJPY, USDCAD; US Dollar Index = the value of the United States dollar relative to a basket of foreign currencies. The use of the indicator is the same as classical  Commodity Channel Index  (CCI) indicator. CCI is calculated with the following formula:  (Typical Price - Simple Moving Average) / (0.015 x Mean Deviation) (Typical Price - Simple Moving Average) / (0.015 x Mean Deviation)
A  tick  is a measure of the minimum upward or downward movement in the  price  of a security. A  tick  can also refer to the change in the  price  of a security from one trade to the next trade.  This indicator will show amounts of ticks when the price goes up and down. This indicator is designed for M1 time frame and shows: Sum of points when the price goes up (Green Histogram). Sum of points when the price goes down (Red Histogram). 
This indicator is a combination of 2 classical indicators MA and RVI. The Relative Vigor Index (RVI) is a momentum indicator used in technical analysis that measures the strength of a trend by comparing a security's closing price to its trading range while smoothing the results using a simple moving average   The input parameter  counted_bars  determines how many bars the indicator's lines will be visible. The input parameter MaRviPeriod  is used for MA and RVI calculation.
This indicator is a combination of 2 classical indicators: MA and Force Index. The input parameter  counted_bars  determines on how many bars the indicator lines will be visible. The input parameter  MaForcePeriod  is used for MA and Force calculation. You may go Long if the current price crossed Up the Ribbon (HISTOGRAM)  and you may go Short if the current price crossed Down the Ribbon (HISTOGRAM)
This indicator is a combination of 2 classical indicators: MA and CCI. Two moving averages form Upper and Lower bands. The input parameter  counted_bars  determines on how many bars the indicator's lines will be visible. The input parameter  barsNum  is used for MA and CCI calculation.
This indicator is using 2 classical indicators: Commodity Channel Index from the higher TF (which you may change using input parameter TimeFrame ) and Average True Range from the current TF. The Green ribbon indicates the upper trend and the Red ribbon indicates the down trend. Buy when the Yellow line crosses the Upper bound (Aqua line). Sell when the Yellow line crossover the Lower bound (Aqua line).
Filtrele:
İnceleme yok
İncelemeye yanıt
Sürüm 4.8 2020.04.20
A new version, compiled by the latest MetaEditor build.