• Genel bakış
  • İncelemeler (4)
  • Yorumlar (12)
  • Yenilikler

Geo Info

5

Geo_Info is one of the most informative indicators displaying net levels as well as basic data on a symbol and trading positions in a space-saving manner.

  • displays brief data on the basic symbol parameters in the upper left corner of the chart:

Swap for Buy order, swap for Sell order, current spread, margin, tick size, stop level, order freeze level. The data is shown for one lot in points.

The data is displayed as follows: SWAP B:4.200 /S:-8.470 /SPR:342 /MRG:256.0/TCV:0.10/STL:0/FRL

The data can be enabled/disabled in the indicator parameters.

  • The indicator displays brief data on the basic symbol parameters in the second line of the upper left corner of the chart: number of Buy, Sell, BuyStop, SellStop, BuyLimt and SellLimit orders, as well as the total number of open position lots.

The data is displayed as follows: B:0 S:1 BS:0 SS:0 BL:0 SL:1/LotB:0 LotS:0.1

The data can be enabled/disabled in the indicator parameters.

  • The new version displays information on the amount of current profit and accumulated swaps for the instrument in total for BUY and SELL positions in the following format:
    Profite_Info: ProfitB:125 SwapB:-2 ProfitS:-20 SwapS:-1 Total:102

  • For forward instruments (futures), the expiration date is displayed in the following format:
    Exp Date:2022.02.18

  • Display of information about the average range per period and the ratio range per period / spread has been introduced, which allows choosing the optimal timeframe for the most efficient operation in given market conditions. The data is presented in the format:
    ATR14: 906.786||| ATR/SPR: 3.956
    If the ATR/SPR ratio is low, it may make sense to choose a higher timeframe for more efficient work.

  • Besides, you are now able to display "Zero lines" (line names - ZeroBuy and ZeroSell) for each group of buy and sell orders (net levels of Buy and Sell positions where the total profit of all buy/sell orders considering accumulated swaps is 0). Each level is displayed by a line of its color. The levels are calculated based on open orders.

If there are pending orders, additional "Zero Lines" (ZeroBuyP and ZeroSellP lines) are displayed representing net levels as if the pending orders have already been activated.
These levels are displayed as rays.

They are useful for traders working with multiple positions, increasing their volume and using grids. Thus, the lines display a net position for each group (buy and sell) of both open and pending orders.

You can enable/disable the indicator lines and set their color in the indicator parameters.


Parameters

  • ShowSymbolInfo = True - display symbol data
  • ShowTradeInfo = True - display trading positions data
  • ShowZeroLines = True - display buy and sell "Zero Lines"
  • ZeroBuyColor = clrCornflowerBlue - "Zero Line" color for open BUY orders.
  • ZeroSellColor = clrSalmon - "Zero Line" color for open SELL orders.
  • ZeroBuyPColor = clrDodgerBlue - "Zero Line" color for BUY orders considering pending ones.
  • ZeroSellPColor = clrPaleVioletRed - "Zero Line" color for SELL orders considering pending ones.
İncelemeler 4
Dmitrijs Ivanajevs
616
Dmitrijs Ivanajevs 2023.01.23 09:03 
 

ОГОНЬ !!!!

Konstantin Remezov
1139
Konstantin Remezov 2022.02.07 21:00 
 

отличный информативный индикатор) рекомендую для ручной торговли

Viktor Loginov
384
Viktor Loginov 2020.01.23 10:41 
 

Отличный индикатор! Всё сделано так, как я хотел. Благодарю разработчика

Önerilen ürünler
The indicator analyzes the change in the minimum and maximum prices of the previous bars fixing the entrance of the big players. If the change (delta) increases, a signal is displayed on the graph in the form of an arrow. At the same time, virtual trade on history is carried out. In the free version, virtual trade is performed without refills in case of a repeat of the signal. The results of virtual trading in the form of losses / losses, profitability, drawdown and transaction lines are display
FREE
Matrix Arrow Indicator Çoklu Zaman Çerçevesi Paneli MT4 , Matrix Arrow Indicator MT4 için ücretsiz bir eklenti ve harika bir varlıktır. 5 kullanıcı tarafından özelleştirilmiş zaman çerçevesi ve toplamda 16 değiştirilebilir sembol/araç için mevcut Matrix Arrow Indicator MT4 sinyalini gösterir. Kullanıcı, Matrix Arrow Indicator MT4 'ün içerdiği 10 standart göstergeden herhangi birini etkinleştirme/devre dışı bırakma seçeneğine sahiptir. 10 standart gösterge özelliğinin tümü, Matrix Arrow Indicato
FREE
Wise Men Indicator demo
Bohdan Kasyanenko
3 (2)
The indicator displays signals according to the strategy of Bill Williams on the chart. Demo version of the indicator has the same features as the paid, except that it can work only on a demo account . Signal "First Wise Man" is formed when there is a divergent bar with angulation.  Bullish divergent bar - with lower minimum and closing price in the upper half. Bearish divergent bar - higher maximum and the closing price at the bottom half. Angulation is formed when all three lines of Alligat
FREE
MACD in MA
Nikolaos Pantzos
iMACD in iMA is indicator to change color in iMA if iMACD is upper of zero (up trend) or lower of zero (down trend). It is a useful tool to track when the upside and the downside iMACD on iMA. You can to get source code from here . Parameters MA_Periods — Period for iMA. MA_Method — Method for iMA. MACD_FastEMA — Fast EMA for MACD. MACD_SlowEMA — Slow EMA for MACD. MACD_SignalSMA — SMA signal for MACD. MACD_ApliedPrice — Price used for MACD. BarsCount — How many bars will show the line. Reve
FREE
Introduction This indicator detects volume spread patterns for buy and sell opportunity. The patterns include demand and supply patterns. You might use each pattern for trading. However, these patterns are best used to detect the demand zone (=accumulation area) and supply zone (=distribution area). Demand pattern indicates generally potential buying opportunity. Supply pattern indicates generally potential selling opportunity. These are the underlying patterns rather than direct price action. T
FREE
Traditional MACD MT4
Daniel Lewis
4.59 (56)
MACD indicator in MetaTrader 4/5 looks different than MACD does in most other charting software. That is because the MetaTrader 4/5 version of MACD displays the MACD line as a histogram when it is traditionally displayed as a line. Additionally, the MetaTrader 4/5 version computes the Signal line using an SMA, while according to MACD definition it is supposed to be an EMA. The MetaTrader 4/5 version also does not compute a true MACD Histogram (the difference between the MACD/Signal lines). This
FREE
This indicator will mirror the assets in use in another metatrader, being able to choose the timeframe and a template. This is the Metatrader 4 Client, it needs the Metatrader 4 or 5 Server versions: Metatrader 4 Mirror Chart Server: https://www.mql5.com/en/market/product/88644 Metatrader 5 Mirror Chart Server:   https://www.mql5.com/en/market/product/88652 Details of how it works in the video.
FREE
BoxInside MT4
Evgeny Shevtsov
4.86 (7)
This indicator calculates the volume profile and places labels that correspond to the VAH, VAL and POC levels, for each candle individually. Indicator operation features The indicator works on the timeframes from M5 to MN, but it uses the history data of smaller periods: M1 - for periods from M5 to H1, M5 - for the H4 period, M30 - for the D1 period, H4 - for the W1 period, D1 - for the MN period. The color and location of the VAL, VAH and POC labels on the current candle are considered to be
FREE
Follow The Line
Oliver Gideon Amofa Appiah
4.07 (14)
FOLLOW THE LINE GET THE FULL VERSION HERE: https://www.mql5.com/en/market/product/36024 This indicator obeys the popular maxim that: "THE TREND IS YOUR FRIEND" It paints a GREEN line for BUY and also paints a RED line for SELL.  It gives alarms and alerts of all kinds. IT DOES NOT REPAINT and can be used for all currency pairs and timeframes. Yes, as easy and simple as that. Even a newbie can use it to make great and reliable trades. NB: For best results, get my other premium indicators for more
FREE
Trend Yakalayıcı: Alarm İndikatörü ile Trend Yakalayıcı Stratejisi, piyasa trendlerini ve potansiyel giriş ve çıkış noktalarını belirlemede yardımcı olan çok yönlü bir teknik analiz aracıdır. Piyasa koşullarına uyum sağlayarak trend yönünün net görsel temsili için dinamik bir Trend Yakalayıcı Stratejisi sunar. Tüccarlar tercihlerine ve risk toleranslarına göre parametreleri özelleştirebilirler. Gösterge, trendleri tanımlamaya yardımcı olur, potansiyel ters dönüşleri sinyaller, trailing stop m
FREE
Wicks UpDown Target GJ Wicks UpDown Target GJ is specialized in GJ forex pairs. Choppy movement up and down on the opening range every day.  Trading breakouts on London session and New York session is recommended. Guideline Entry Strategy Idea: Step 1 - Breakout Forming (Warning! Trade on London Session and New York Session) Step 2 - Breakout Starting (Take Action on your trading plan) Step 3 - Partial Close your order & set breakeven (no-risk) Step 4 - Target complete Step 5 - Don't tr
FREE
Cumulative Delta MT4
Evgeny Shevtsov
4.93 (27)
The indicator analyzes the volume scale and splits it into two components - seller volumes and buyer volumes, and also calculates the delta and cumulative delta. The indicator does not flicker or redraw, its calculation and plotting are performed fairly quickly, while using the data from the smaller (relative to the current) periods. The indicator operation modes can be switched using the Mode input variable: Buy - display only the buyer volumes. Sell - display only the seller volumes. BuySell -
FREE
TrendPlus
Sivakumar Subbaiya
4.08 (12)
Trend Plus   Trendplus  Indicator   Time Frame: Suitable for any time frame.  Purpose: Trend Prediction. Blue and red candle indicate the buy and sell call respectively. Buy: When the blue candle is formed buy call is initiated. close the buy trades when the next red candle will formed.   Sell: When the Red candle is formed Sell call is initiated. close the Sell trades when the next blue candle will formed.   Happy trade!!
FREE
The indicator detects and displays М. Gartley's Butterfly pattern. The pattern is plotted by the extreme values of the ZigZag indicator (included in the resources, no need to install). After detecting the pattern, the indicator notifies of that by the pop-up window, a mobile notification and an email. The pattern and wave parameters are displayed on the screenshots. The default parameters are used for demonstration purposes only in order to increase the amount of detected patterns. Parameters
Wave Reversal Indicator - determines the direction of trend waves and price reversals. The indicator shows wave movements and trend directions. It gives recommendations where to follow the trader, helps to follow the trading strategy. It is an addition to an intraday or medium-term strategy. Almost all parameters are selected for each time frame and are changed automatically, the only parameter for manual adjustment is the wavelength. Works on various trading instruments and timeframes, rec
FREE
StrikePin
Mike Pascal Plavonil
1 (1)
The StrikePin indicator is a technical, analytical tool designed to identify trend reversals and find optimal market entries.  The StrikePin indicator is based on the pin bar pattern, which is the Price Action reversal pattern. An entry signal, in a trending market, can offer a very high-probability entry and a good risk to reward scenario. Be careful: the indicator is repainting since it is looking for highest high and lowest lows.  You should avoid to use it in experts but you can use it
FREE
Stoch–Cross Scalper is an Expert Advisor based on the Stochastic oscillator indicator using the 80 threshold as overbought and 20 as oversold while utilizing a 14 day rolling period to analyze High and Low closing prices in relation to the current close price. The Stochastic oscillator is a commonly used indicator and many trading philosophies are based upon it. This expert is the result of over ten years of my fine tuning and perfecting this trading system. Almost all of the indicators availabl
FREE
Signals and Alerts for Accelerator/Decelerator indicator based on these MQL5 posts: Accelerator Oscillator and Signals of the Indicator Accelerator Oscillator . Note : this tool is based on the code of Accelerator indicator developed by MetaQuotes Software Corp. Features The signals are triggered at   closing   of last bar/opening of a new bar; Any kind of alerts can be enabled: Dialog Box, Email message, SMS notifications for smartphones and tablets, and Sound alerts; Customizable arrows. By
FREE
This indicator alerts you when/before new 1 or 5 minute bar candle formed. In other words,this indicator alerts you every 1/5 minutes. This indicator is especially useful for traders who trade when new bars formed. *This indicator don't work propery in strategy tester.Use this in live trading to check functionality. There is more powerful Pro version .In Pro version,you can choose more timeframe and so on. Input Parameters Alert_Or_Sound =Sound ----- Choose alert or sound or both to not
FREE
Show Pips
Roman Podpora
4.3 (54)
Bu bilgi göstergesi her zaman hesaptaki güncel durumdan haberdar olmak isteyenler için faydalı olacaktır. Gösterge, puan cinsinden kâr, yüzde ve para birimi gibi verilerin yanı sıra mevcut çiftin spreadini ve mevcut zaman diliminde çubuğun kapanmasına kadar geçen süreyi görüntüler. VERSİYON MT5 -   Daha kullanışlı göstergeler Bilgi satırını grafiğe yerleştirmek için birkaç seçenek vardır: Fiyatın sağında (fiyatın arkasında); Yorum olarak (grafiğin sol üst köşesinde); Ekranın seçilen köşesinde.
FREE
The Candle Countdown Timer for MetaTrader 4 (also available for MT5) is a vital indicator designed to help you manage your trading time effectively. It keeps you updated about market open and close times by displaying the remaining time before the current candle closes and a new one forms. This powerful tool enables you to make well-informed trading decisions. Key Features: Asia Range: Comes with an option to extend the range. Broker Time, New York, London Time: Displays the current broker time
FREE
RSI Candle Signal
Jonathan Destailleur
4.5 (2)
RSI Candle Signal Indicator will change bars’ color when set overbought or oversold levels reach. How to Use RSI Candle Signal Uptrend/Downtrends  - RSI may be used to detect trending markets. For example, the RSI may stay above the mid line 50 in an uptrend. Top and Buttoms  - RSI may help in identifying the tops around the overbought readings (usually above 70), and the bottoms around the oversold area (usually below 30). Divergence  - divergence occurs when RSI directional movement is not c
FREE
High Low Open Close MT4
Alexandre Borela
4.79 (19)
Bu projeyi seviyorsanız, 5 yıldız incelemesi bırakın. instagram'da izleyin: borelatech Bu gösterge açık, yüksek, düşük ve belirtilen fiyatlar için çizer Dönem ve belirli bir zaman bölgesi için ayarlanabilir. Bunlar birçok kurumsal ve profesyonel tarafından görünen önemli seviyelerdir. tüccarlar ve daha fazla olabileceği yerleri bilmeniz için yararlı olabilir Aktif. Mevcut dönemler şunlardır: Önceki gün. Önceki Hafta. Önceki Ay. Previous Quarter. Önceki yıl. Veya: Mevcut gün. Hafta. Şimdi Ay.
FREE
Trend MA Candles
Claus Dietrich
4.14 (7)
COLORED TREND MA / MACD CANDLES draw MA Candles above/below Moving Average in a single color draw MA as a leading Line like a Supertrend draw MA as a Channel => MA High and Low draw MACD Candles above and below 0 and Signal-Line Your  Advantage: a simple view of the trend direction a simple view over the higher trend direction a calmer chart for the eye clear rules can be defined Settings: Bars to process : 6000 is my default, this value is up to you Value Quick-Set : pre-Settings MACD 12 / 26
FREE
MT4 Candlestick Pattern Alert Indicator: Stay Ahead of Trading Opportunities Overview The MT4 Candlestick Pattern Alert Indicator is a robust tool designed to empower traders by detecting candlestick patterns and delivering timely alerts through notifications, emails, and pop-up alerts. This invaluable tool saves traders precious time, allowing focused analysis on patterns and potential profitable trades. Importance of Candlestick Patterns Candlestick patterns are pivotal in technical analysis,
FREE
Extremum Reverse Bar
Yurij Izyumov
2.8 (5)
This indicator has been created for finding the probable reversal points of the symbol price. A small candlestick reversal pattern is used it its operation in conjunction with a filter of extremums. The indicator is not redrawn! If the extremum filter is disabled, the indicator shows all points that have a pattern. If the extremum filter is enabled, the condition works – if the history Previous bars 1 candles back contains higher candles and they are farther than the Previous bars 2 candle, such
FREE
PLEASE TAKE NOTICE: This indicator is in current development. final version will be free. This is a simple indicator that uses 3 timeframes in its formula to create Possible buy and sell signals. This indicator is optimized for the M1 timeframe Only. It has 2 types of Alerts: Push Notifications Audio Alerts UPDATES: 3/19/24: Still testing the final code Troubleshooting: When loading the indicator, if you don't see the arrows on the current chart that means that MT4 has not loaded all the h
FREE
Toby Strategy Indicator
Ahmd Sbhy Mhmd Ahmd ʿYshh
The indicator rely on The Toby strategy >> The mother candle which is bigger in range than the previous six candles. A vertical line shows the last Toby Candle with the targets shown up and down. The strategy is about the closing price out of the range of the toby candle to reach the 3 targets..The most probable to be hit is target1 so ensure reserving your profits and managing your stop lose.
FREE
This indicator is the basis for an Expert Advisor that can be categorized as "almost Grail". See details below.             This indicator displays the projection of the Renko chart on the price chart. This projection is displayed as a stepped line, not as "bricks" (rectangles). See slides 1 and 2. Abbreviated name of the indicator: LRC – L ine of R enko on the price C hart.             The principle of its construction is very simple. First, a grid of horizontal lines (levels) is bu
FREE
RJT SALAMANDER, the indicator as in a video game VERSION 2 Pilot your PRICE spaceship inside the cavern and avoid the collision against the stalactites (green) and stalagmites (red), dodging these obstacles to win. When these objects are forming (or disappearing) then you must make the decision how to move your ship (just like in a video game) Depending on the market and the size of the candles/bars you can adjust the calculation of stalactites and stalagmites (based on the last bars) in
FREE
Bu ürünün alıcıları ayrıca şunları da satın alıyor
Gann Made Easy
Oleg Rodin
4.85 (82)
Gann Made Easy , bay teorisini kullanarak ticaretin en iyi ilkelerine dayanan, profesyonel ve kullanımı kolay bir Forex ticaret sistemidir. WD Gann. Gösterge, Zararı Durdur ve Kâr Al Seviyeleri dahil olmak üzere doğru SATIN AL ve SAT sinyalleri sağlar. PUSH bildirimlerini kullanarak hareket halindeyken bile işlem yapabilirsiniz. Lütfen satın aldıktan sonra benimle iletişime geçin! Alım satım ipuçlarımı ve harika bonus göstergelerini ücretsiz olarak sizinle paylaşacağım! Muhtemelen Gann ticaret y
TPSpro RFI Levels
Roman Podpora
4.82 (22)
TALİMATLAR         RUS   -        ENG       Bir gösterge ile kullanılması   önerilir       -       TPSpro   TREND PRO -   Sürüm MT4         Ticarette önemli bir unsur, bir ticaret aracını satın alma veya satma kararlarının alındığı bölgeler veya seviyelerdir. Büyük oyuncuların piyasadaki varlıklarını gizleme girişimlerine rağmen, kaçınılmaz olarak izler bırakırlar. Bizim görevimiz bu izleri nasıl tanımlayacağımızı ve doğru şekilde nasıl yorumlayacağımızı öğrenmekti. Ana işlevler:: Satıcılar ve
Gold Stuff
Vasiliy Strukov
4.89 (239)
Gold Stuff, özellikle altın için tasarlanmış bir trend göstergesidir ve herhangi bir finansal enstrümanda da kullanılabilir. Gösterge yeniden çizilmez ve gecikmez. Önerilen zaman dilimi H1. Bu göstergede tam otomatik Uzman Danışman EA Gold Stuff çalışır. Profilimde bulabilirsiniz. Ayarları ve kişisel bir bonusu almak için satın alma işleminden hemen sonra benimle iletişime geçin!  Güçlü Destek ve Trend Tarayıcı göstergemizin ücretsiz bir kopyasını pm'den alabilirsiniz. Ben! AYARLAR Ok Ç
Trend Punch
Mohamed Hassan
4.95 (19)
This indicator is unstoppable when combined with our other indicator called  Support & Resistance . After purchase, send us a message and you will get it   for  FREE as a BONUS! Introducing Trend Punch , the revolutionary forex trend indicator that will transform the way you trade! Trend Punch is uniquely designed to provide precise buy and sell arrows during strong market trends, making your trading decisions clearer and more confident. Whether you're trading major currency pairs or exotic sym
TPSproTREND PrO
Roman Podpora
4.79 (19)
TPSpro TREND PRO,   piyasayı otomatik olarak analiz eden, trend ve değişimlerinin her biri hakkında bilgi sağlayan, ayrıca yeniden çizmeden işlemlere girme sinyalleri veren bir trend göstergesidir! Gösterge her mumu ayrı ayrı analiz ederek kullanır. farklı dürtülere atıfta bulunur - yukarı veya aşağı dürtü. Para birimleri, kripto paralar, metaller, hisse senetleri ve endeksler için işlemlere tam giriş noktaları! Sürüm MT5                   GÖSTERGENİN TAM AÇIKLAMASI       Bunu -   RFI SEVİYELER
Atomic Analyst
Issam Kassas
5 (2)
Öncelikle belirtmek gerekir ki bu Ticaret Göstergesi Yeniden Çizim Yapmaz, Gecikmez ve Gecikme Göstermez, bu da hem manuel hem de robot ticareti için ideal hale getirir. Kullanıcı kılavuzu: ayarlar, girişler ve strateji. Atom Analisti, Piyasada Daha İyi Bir Avantaj Bulmak İçin Fiyatın Gücünü ve Momentumunu Kullanan PA Fiyat Hareketi Göstergesidir. Gürültüleri ve Yanlış Sinyalleri Kaldırmaya ve Ticaret Potansiyelini Artırmaya Yardımcı Olan Gelişmiş Filtrelerle Donatılmıştır. Birden fazla katma
FX Power MT4 NG
Daniel Stein
5 (12)
Sabah Brifingimiz burada mql5 ve on Telegram! FX Power MT4 NG , uzun zamandır çok popüler olan döviz gücü ölçerimiz FX Power'ın yeni neslidir. Peki bu yeni nesil güç ölçer ne sunuyor? Orijinal FX Power hakkında sevdiğiniz her şey PLUS GOLD/XAU güç analizi Daha da hassas hesaplama sonuçları Ayrı ayrı yapılandırılabilir analiz dönemleri Daha da iyi performans için özelleştirilebilir hesaplama limiti Özel çokluDaha fazlasını görmek isteyenler için örnek ayarlar Her grafikte en sevdiğiniz renkler i
Trend Screener
STE S.S.COMPANY
4.8 (87)
Trend Göstergesi, Trend Alım Satım ve Filtreleme için Çığır Açan Benzersiz Çözüm, Tüm Önemli Trend Özellikleriyle Tek Bir Araç İçinde Yerleştirildi! Forex, emtialar, kripto para birimleri, endeksler ve hisse senetleri gibi tüm sembollerde/araçlarda kullanılabilen %100 yeniden boyamayan çoklu zaman çerçevesi ve Çoklu para birimi göstergesidir. SINIRLI SÜRELİ TEKLİF: Destek ve Direnç Tarama Göstergesi sadece 50$ ve ömür boyu mevcuttur. (Orijinal fiyat 250$) (teklif uzatıldı) Trend Screener, grafik
MetaBands M4
Vahidreza Heidar Gholami
5 (2)
MetaBands uses powerful and unique algorithms to draw channels and detect trends so that it can provide traders with potential points for entering and exiting trades. It’s a channel indicator plus a powerful trend indicator. It includes different types of channels which can be merged to create new channels simply by using the input parameters. MetaBands uses all types of alerts to notify users about market events. Features Supports most of the channel algorithms Powerful trend detection algorith
- Real price is 80$ - 40% Discount ( It is 49$ now ) Contact me for instruction, add group and any questions! Related Product:  Bitcoin Expert Introduction The breakout and retest strategy is traded support and resistance levels. it involves price breaking through a previous level.  The break and retest strategy is designed to help traders do two main things, the first is to avoid false breakouts. Many false breakouts start with a candlestick that breaks out of a level but ends with an immediat
Dynamic Forex28 Navigator - Yeni Nesil Forex Ticaret Aracı. ŞU ANDA %49 İNDİRİM. Dynamic Forex28 Navigator, uzun zamandır popüler olan göstergelerimizin evrimidir ve üçünün gücünü tek bir göstergede birleştirir: Gelişmiş Döviz Gücü28 Göstergesi (695 inceleme) + Gelişmiş Döviz İMPULS ve UYARI (520 inceleme) + CS28 Kombo Sinyalleri (Bonus). Gösterge hakkında ayrıntılar https://www.mql5.com/en/blogs/post/758844 Yeni Nesil Güç Göstergesi Ne Sunuyor?  Orijinallerde sevdiğiniz her şey, şimdi ye
Scalper Inside PRO
Alexey Minkov
4.73 (56)
An exclusive indicator that utilizes an innovative algorithm to swiftly and accurately determine the market trend. The indicator automatically calculates opening, closing, and profit levels, providing detailed trading statistics. With these features, you can choose the most appropriate trading instrument for the current market conditions. Additionally, you can easily integrate your own arrow indicators into Scalper Inside Pro to quickly evaluate their statistics and profitability. Scalper Inside
Enigmera
Ivan Stefanov
5 (3)
ENIGMERA: Pazarın çekirdeği https://www.enigmera.com Giriş Bu gösterge ve ticaret sistemi, finansal piyasalar için dikkate değer bir yaklaşımdır. ENIGMERA, destek ve direnç seviyelerini doğru bir şekilde hesaplamak için fraktal döngüleri kullanır. Gerçek birikim aşamasını gösterir ve yön ve hedefler verir.  İster bir trendde ister bir düzeltmede olalım çalışan bir sistem.  Nasıl çalışır? ENIGMERA üç çizgiden oluşur: destek/direnç çizgisi, hedef çizgisi ve sapma çizgisi. Sistem, geçmiş veril
TrendMaestro
Stefano Frisetti
5 (3)
note: this indicator is for METATRADER4, if you want the version for METATRADER5 this is the link:  https://www.mql5.com/it/market/product/108106 TRENDMAESTRO ver 2.4 TRENDMAESTRO recognizes a new TREND in the bud, he never makes mistakes. The certainty of identifying a new TREND is priceless. DESCRIPTION TRENDMAESTRO identifies a new TREND in the bud, this indicator examines the volatility, volumes and momentum to identify the moment in which there is an explosion of one or more of these data a
ŞU ANDA %31 INDIRIMLI !!! Yeni Başlayanlar veya Uzman Tüccarlar için En İyi Çözüm! Bu gösterge benzersiz, yüksek kaliteli ve uygun fiyatlı bir ticaret aracıdır çünkü bir dizi tescilli özellik ve gizli bir formül ekledik. Yalnızca BİR grafikle 28 döviz çiftinin tümü için Uyarılar verir. Yeni bir trendin veya scalping fırsatının tam tetik noktasını belirleyebildiğiniz için ticaretinizin nasıl gelişeceğini hayal edin! Yeni temel algoritmalar üzerine inşa edilen bu sistem, potansiyel işlemler
Şu anda %20 İNDİRİMLİ! Herhangi bir Acemi veya Uzman Tüccar için En İyi Çözüm! Bu gösterge paneli yazılımı 28 döviz çifti üzerinde çalışıyor. Ana göstergelerimizden 2'sine (Gelişmiş Para Birimi Gücü 28 ve Gelişmiş Para Birimi Dürtüsü) dayanmaktadır. Tüm Forex piyasasına harika bir genel bakış sağlar. Gelişmiş Para Birimi Gücü değerlerini, para birimi hareket hızını ve tüm (9) zaman dilimlerinde 28 Forex çifti için sinyalleri gösterir. Trendleri ve / veya scalping fırsatlarını belirlemek içi
FX Volume
Daniel Stein
4.58 (33)
Sabah Brifingimiz aracılığıyla ayrıntılar ve ekran görüntüleri ile günlük piyasa güncellemenizi alın burada mql5 ve on Telegram ! FX Volume, bir brokerin bakış açısından piyasa duyarlılığı hakkında GERÇEK bir fikir veren İLK ve TEK hacim göstergesidir. COT raporlarından çok daha hızlı bir şekilde, brokerlar gibi kurumsal piyasa katılımcılarının Forex piyasasında nasıl konumlandıklarına dair harika bilgiler sağlar. Bu bilgileri doğrudan grafiğinizde görmek, ticaretiniz için gerçek oyun değiştir
Bomb Bank Signal
Igor Pereira Calil
5 (1)
Bomb Bank Signal: Your Trusted Indicator for MetaTrader 4 The Bomb Bank Signal is a powerful indicator for MetaTrader 4, designed to identify the most relevant trends in the financial market. If you are looking for a tool that accurately anticipates movements, Bomb Bank is the ally you need. How it Works: This indicator combines three distinct methods – volume analysis, candle closes and symmetrical trend – to detect and signal buying and selling opportunities. Bomb Bank is like a "bomb"
Stratos Pali Indicator   is a revolutionary tool designed to enhance your trading strategy by accurately identifying market trends. This sophisticated indicator uses a unique algorithm to generate a complete histogram, which records when the trend is Long or Short. When a trend reversal occurs, an arrow appears, indicating the new direction of the trend. Important Information Revealed Leave a review and contact me via mql5 message to receive My Top 5 set files for Stratos Pali at no cost! D
Chart Patterns All-in-One göstergesi, traderların teknik analizde yaygın olarak kullanılan çeşitli grafik desenlerini görselleştirmelerine yardımcı olur. Bu gösterge, potansiyel piyasa hareketlerini belirlemeye yardımcı olur ancak kârlılığı garanti etmez. Satın almadan önce göstergeyi demo modunda test etmeniz önerilir. Mevcut Teklif : "Chart Patterns All in One" göstergesinde %50 indirim. Dahil Edilen Desenler : 1-2-3 Deseni : Üç önemli nokta (yüksekler veya düşükler) kullanarak piyasa tersine
Supply and Demand Dashboard PRO
Bernhard Schweigert
4.8 (20)
Şu anda %20 İNDİRİMLİ! Bu gösterge paneli, birden fazla sembol ve 9 zaman dilimine kadar çalışan çok güçlü bir yazılım parçasıdır. Ana göstergemize dayanmaktadır (En iyi yorumlar: Advanced Supply Demand ).     Gösterge paneli harika bir genel bakış sağlar. Gösterir:    Bölge mukavemet derecesi dahil filtrelenmiş Arz ve Talep değerleri, Bölgelere/ve bölgeler içindeki pip mesafeleri, İç içe geçmiş bölgeleri vurgular, Tüm (9) zaman dilimlerinde seçilen semboller için 4 çeşit uyarı verir. Kişis
ŞU ANDA %26 INDIRIMLI Yeni Başlayanlar veya Uzman Tüccarlar için En İyi Çözüm! Bu Gösterge benzersiz, yüksek kaliteli ve uygun fiyatlı bir ticaret aracıdır çünkü bir dizi tescilli özellik ve yeni bir formül ekledik. Sadece BİR grafik ile 28 Forex çifti için Döviz Gücünü okuyabilirsiniz! Yeni bir trendin veya scalping fırsatının tam tetik noktasını belirleyebildiğiniz için ticaretinizin nasıl gelişeceğini hayal edin? Kullanım kılavuzu: buraya tıklayın Bu ilk olan, orijinal! Değersiz bir
IX Power MT4
Daniel Stein
5 (5)
IX Power nihayet FX Power'ın rakipsiz hassasiyetini Forex dışı sembollere getiriyor. En sevdiğiniz endeksler, hisse senetleri, emtialar, ETF'ler ve hatta kripto para birimlerindeki kısa, orta ve uzun vadeli eğilimlerin yoğunluğunu doğru bir şekilde belirler. Terminalinizin sunduğu her şeyi analiz edebilirsiniz. Deneyin ve işlem yaparken zamanlamanızın nasıl önemli ölçüde iyileştiğini deneyimleyin. IX Power Temel Özellikler 100 hassas, yeniden boyanmayan hesaplama sonuçları - terminalini
Öncelikle, bu Ticaret Aracının Non-Repainting, Non-Redrawing ve Non-Lagging Gösterge olduğunu vurgulamakta fayda var, bu da onu profesyonel ticaret için ideal hale getiriyor. Çevrimiçi kurs, kullanıcı kılavuzu ve demo. Akıllı Fiyat Hareketi Kavramları Göstergesi, hem yeni hem de deneyimli tüccarlar için çok güçlü bir araçtır. İleri ticaret fikirlerini, Inner Circle Trader Analizi ve Smart Money Concepts Ticaret Stratejileri gibi 20'den fazla kullanışlı göstergeyi bir araya getirerek bir araya g
Currency Strength Wizard , başarılı ticaret için size hepsi bir arada çözüm sağlayan çok güçlü bir göstergedir. Gösterge, birden çok zaman dilimindeki tüm para birimlerinin verilerini kullanarak şu veya bu forex çiftinin gücünü hesaplar. Bu veriler, şu veya bu para biriminin gücünü görmek için kullanabileceğiniz, kullanımı kolay para birimi endeksi ve para birimi güç hatları biçiminde temsil edilir. İhtiyacınız olan tek şey, işlem yapmak istediğiniz tabloya göstergeyi eklemektir ve gösterge size
Entry Points Pro
Yury Orlov
4.62 (175)
Yeniden boyamadan bir ticarete girmek için doğru sinyaller sağlayan MT5 için en iyi gösterge! Herhangi bir finansal varlığa uygulanabilir: forex, kripto para birimleri, metaller, hisse senetleri, endeksler. MT5 versiyonu burada Oldukça doğru alım satım sinyalleri sağlayacak ve bir alım satımı açıp kapatmanın en iyi zamanını size söyleyecektir. Göstergeyi ödeyen yalnızca bir sinyali işleme örneğiyle videoyu (6:22) izleyin! Çoğu tüccar, Giriş Noktaları Pro göstergesinin yardımıyla ilk işl
Trend Cutter
Oleg Rodin
5 (2)
Trend Cutter, M1 ve M5 gibi daha düşük zaman dilimleri de dahil olmak üzere herhangi bir zaman diliminde kullanılabilen bir trend göstergesidir. Gösterge, gün içi ticareti tercih eden yatırımcılar için idealdir ve uzun vadeli ticareti tercih edenlere de yardımcı olacaktır. Bu göstergeyi ticaret sisteminiz için bir temel olarak veya bağımsız bir ticaret çözümü olarak kullanabilirsiniz. Gösterge, PUSH bildirimleri de dahil olmak üzere her türlü uyarıyı sağlar. Göstergenin kullanımı çok kolaydır. S
Fiyat tersine döndükçe ve geri çekildikçe piyasa yapısından elde edilen kâr değişir. Piyasa yapısını tersine çevirme uyarısı göstergesi, bir trendin veya fiyat hareketinin ne zaman tükenmeye yaklaştığını ve tersine dönmeye hazır olduğunu tanımlar. Genellikle bir geri dönüş veya büyük bir geri çekilme meydana gelmek üzereyken meydana gelen piyasa yapısındaki değişiklikler konusunda sizi uyarır. Gösterge, olası bir tükenme noktasının yakınında her yeni yüksek veya düşük oluştuğunda, başlangıçta
Trend Pulse
Mohamed Hassan
5 (4)
Please contact me after purchase to immediately get your PDF strategy + documentation for Trend Pulse !  Introducing Trend Pulse , a unique and robust indicator capable of detecting bullish, bearish, and even ranging trends! Trend Pulse uses a special algorithm to filter out market noise with real precision. If the current symbol is moving sideways, Trend Pulse will send you a ranging signal, letting you know that it's not a good time to enter a trade. This excellent system makes Trend Pulse
PowerBall Signals, destek/direnç bölgelerini kullanma fikrine dayanan bir AL/SAT sinyal göstergesidir. Gösterge, destek/direnç bölgelerine dayalı özel dönüş modellerini tespit eder ve bu sinyalleri grafiğinize sunar. Göstergenin ana fikri MTF (Çoklu Zaman Çerçevesi) analizini kullanmak ve mevcut ve bir sonraki daha yüksek zaman dilimindeki seviyelere göre sinyaller sağlamaktır. Bu yöntem, para birimleri, metaller, endeksler ve hatta kripto para birimleri olsun, herhangi bir pazardaki olası fiyat
Yazarın diğer ürünleri
GeoInfo5
Georgij Komarov
GeoInfo5 is one of the most informative indicators, it displays basic information about a trading instrument in a compact form. The version for the Meta Trader 4 terminal has gained wide popularity among traders. The indicator is free and will always be free. The launch version is now available for MetaTrader 5 as well. displays information about the main parameters of the tool in a brief form in the line in the upper left corner of the chart: Spread, Swap for Buy order, Swap for Sell order,
FREE
GeoStochPro
Georgij Komarov
5 (1)
Geo_StochPro is a profile, or professional Stochastic. Geo_StochPro is one of the well-known currency profile indicators. It displays two Stochastic indicators on all timeframes and multiple currency pairs forming the currency profile in the matrix form simultaneously . Thus, you can see the current state of the selected instrument as well as other pairs containing that instrument (overbought/oversold) without switching timeframes. The indicator is perfect for scalpers, intraday and medium-term
Geo Fractals
Georgij Komarov
5 (1)
This is professional fractals indicator able to work "on several screens" while on a single chart. The product has been developed for scalpers and those relying on "accurate" entries. The indicator shows fractals from six timeframes and displays the distance between the price and a new emerging fractal on lower timeframes showing the price behavior more clearly and making its analysis more accurate on reversal points. The indicator displays fractals from the D1, H4, H1, M15, M5 and M1 timeframes
GeoWprPro
Georgij Komarov
WPR by Profile, or WPR for Professionals Geo_WprPro is one of the well-known currency profile indicators. It simultaneously displays two WPR indicators with different parameters in the matrix form on all timeframes of multiple currency pairs forming the currency profile . As follows from the description, " WPR is a leading indicator that often goes ahead of the price chart. The oscillator frequently reaches extreme values before the price reversal as if anticipating that event: it almost always
Filtrele:
Dmitrijs Ivanajevs
616
Dmitrijs Ivanajevs 2023.01.23 09:03 
 

ОГОНЬ !!!!

Konstantin Remezov
1139
Konstantin Remezov 2022.02.07 21:00 
 

отличный информативный индикатор) рекомендую для ручной торговли

Viktor Loginov
384
Viktor Loginov 2020.01.23 10:41 
 

Отличный индикатор! Всё сделано так, как я хотел. Благодарю разработчика

Tim Eubanks
5762
Tim Eubanks 2018.07.14 20:52 
 

Kullanıcı incelemeye herhangi bir yorum bırakmadı

İncelemeye yanıt
Sürüm 5.21 2023.07.27
Bags fixed
Sürüm 5.20 2023.01.26
In the new version of the Geo_Info 5.2 indicator, in addition to the already familiar for users voicing profitable positions using parameters:

• Positive Pro fit Sound Enable = True; //Play Sound When Profit.
• SoundFile = "Tick.wav"; //Your Profit Sound

thanks to the idea of @fxproaddicted, you can now hear a signal or music when closing orders. The sound file must be located in the Sound folder.

• CloseOrderSoundEnable = True; //Play Sound When Order To Close.
• CloseOrderSoundFile = "Money.wav"; //File To Play
Sürüm 5.15 2023.01.10
Исправлены ошибки
Sürüm 5.13 2023.01.10
Fixed Bugs.
Thanks to fxproaddicted !!
Grazie!!
Sürüm 5.12 2023.01.10
Geo_Info is now the standard for equipping a trader's working terminal.

Geo_Info is one of the most informative indicators, in a compact form it displays basic information about a trading instrument, open positions, displays NET levels.

Version 5.2 contains a fundamentally new information indicator that was not previously available to traders.

In the previous version, the indicator displayed the size of the ATR - the average range for several periods.
Now we have added a display of the ratio of the average range to the spread.

This simple action gives you new knowledge that takes the trader to a new level of understanding of the effectiveness of working on this instrument at a given time.
Indeed, if at the moment on the selected instrument the ratio of the average range to the spread on the selected timeframe is close to the spread value, or slightly exceeds it, it makes sense to consider an older timeframe, or change the instrument to a more effective one.

All other features are left unchanged.

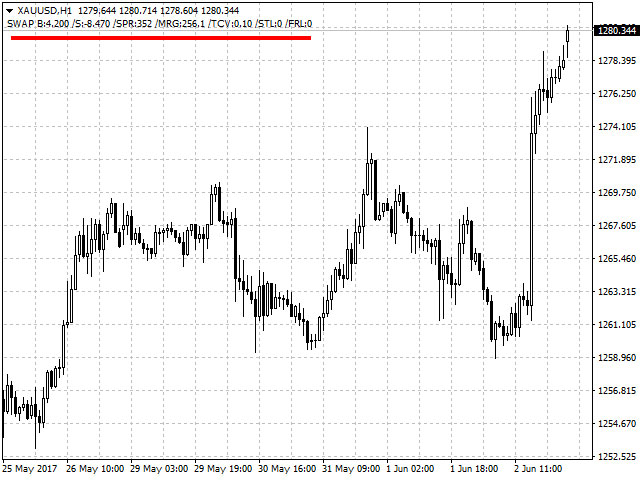
Displays information about the main parameters of the tool in a short form in the line in the upper left corner of the chart:
Swap for Buy order, Swap for Sell order, current spread, collateral (margin), tick size, Stop level, order freeze level. The information is displayed based on one lot and in points.

The information is displayed as follows: SWAP B:4.200 /S:-8.470 /SPR:342 /MRG:256.0/TCV:0.10/STL:0/FRL

You can enable/disable the display of this information in the indicator parameters.

It is possible to display in the second line in the upper left corner of the chart in a brief form information about the main parameters of trading positions on this instrument: the number of Buy, Sell, BuyStop, SellStop, BuyLimt, SellLimit orders, as well as the total number of lots of open positions.
The information is output as follows: B:0 S:1 BS:0 SS:0 BL:0 SL:1/LotB:0 LotS:0.1

You can enable/disable the display of this information in the indicator parameters.

The new version displays information about the amount of current profit and accumulated swaps on the instrument in total for BUY and SELL positions in the format:
Profite_Info: ProfitB:125 SwapB:-2 ProfitS:-20 SwapS:-1 Total:102

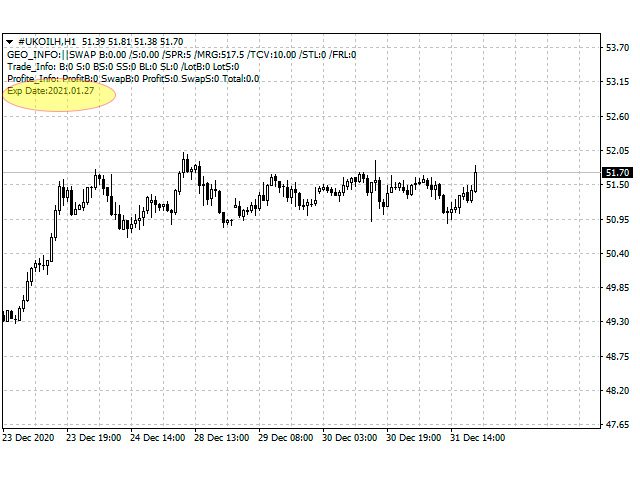
For urgent instruments (futures), the expiration date is displayed in the format:
Exp Date:2022.02.18

In addition, now you have the opportunity to display "Zero Lines" on the chart (the names of the lines are "ZeroBuy" and "ZeroSell") for each group of buy and sell orders, that is, the NET levels of Buy and Sell positions, where the total profit of all buy (sell) orders (taking into account accumulated swaps) will be equal to 0. Each level is displayed with a line of its own color. The levels are calculated based on open orders.
Also, if there are pending orders, "Zero Lines" are additionally displayed (the names of the lines are "ZeroBuyP" and "ZeroSellP"), which display NET levels taking into account if the pending orders are triggered.
These levels are displayed by rays.

It is useful for traders who work in several positions, using top-ups, grids. The lines thus reflect the NET position for each group (buy and sell) both open orders and pending orders.

You can enable/disable the display of lines, as well as select the color of the lines in the indicator parameters.
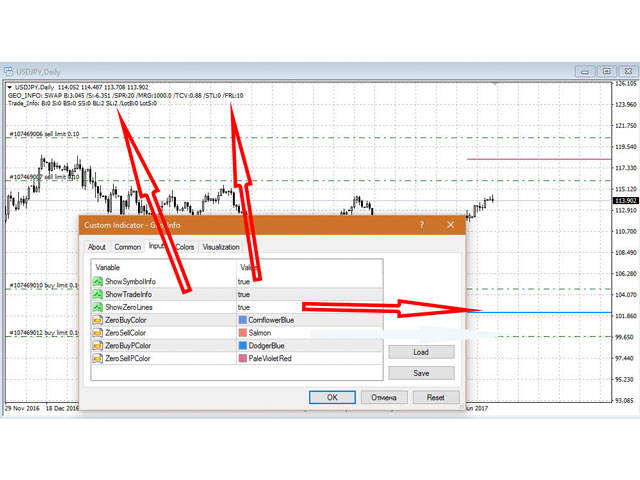

Parameters
ShowSymbolInfo = True - True or False - whether or not to display information about the tool
ShowTradeInfo = True - True or False - display or not information about trading positions
ShowZeroLines = True - True or False - whether or not to display the "Zero Lines" of the buy and sell levels
ZeroBuyColor = clrCornflowerBlue - the color of the "Zero Line" for open BUY orders.
ZeroSellColor = clrSalmon - the color of the "Zero Line" for open SELL orders.
ZeroBuyPColor = clrDodgerBlue - the color of the "Zero Line" for BUY orders, taking into account pending orders.
ZeroSellPColor = clrPaleVioletRed - the color of the "Zero Line" for SELL orders, taking into account pending orders.
Sürüm 5.11 2022.02.08
Уточнено отображение стоимости тика для разных инструментов.
TCV
Sürüm 5.1 2022.02.08
Fixed a bug that caused the indicator to temporarily freeze and incorrectly display the current situation, sometimes occurring on a thin market, or between sessions.
Sürüm 5.0 2021.04.11
The 5th version of the popular Geo_Info indicator is released.
Geo_Info - one of the most informative indicators, in a compact form displays basic information about a trading instrument, open positions, displays NET levels, etc. being a free indicator, available to everyone, and has already become a standard, in fact, a "must-have" indicator in equipping a trader's workspace.

Now, the displayed information has been supplemented with the reading of the ATR indicator, which shows the average value of the size of the instrument's stroke for the selected period, and the value of the ratio of this value to the size of the spread on the instrument, which allows us to evaluate the expected efficiency of work on this instrument on the selected timeframe.
If the spread is close to the current average volatility, then it makes sense to move to a higher time frame to reduce the influence of the spread on the trading result.

The parameters were added accordingly:

input bool ShowATRInfo = True; - whether or not to display the ATR section
input int ATR = 14; - period for calculating ATR
Sürüm 4.0 2021.01.01
Now to display the information about the expiration date for instruments with an expiration date.
Sürüm 3.0 2020.03.10
What's new:
The Geo_Info indicator version 3.0 displays in a third line in the upper left corner of the chart a summary of the main trading parameters for instrument: Profit and swap for BUY orders, profit and swap for SELL orders, as well as total profit for the instrument. Information is displayed in short form, for example: ProfitB: 110 SwapB: 10 ProfitS: 0 SwapS: 0 Total: 120.1

Also added the ability to voice the wonderful event when a positive profit is at the instrument. Setting the "PositiveProfitSoundEnable" parameter to "True" will allow you to play sound when a positive profit is on the instrument. The default sound is "tick.wav". You can change the sound in the "SoundFile" parameter. As always, the Geo_Info indicator is free.
Sürüm 2.0 2017.07.21
Indicator Geo_Info version 2.0 displays in left upper corner the second line with short info about trading position: quantity of Buy, Sell, BuyStop, SellStop, BuyLimt, SellLimit orders, and also summary Lot Size of open trades. Info is presented as below:
B:0 S:1 BS:0 SS:0 BL:0 SL:1/LotB:0 LotS:0.1

Besides, now you can see "Zero Lines" for both Sell and Buy groups of trading orders. There are two lines of different colors that indicate the levels where profit (including swaps) of all Sell positions and separately profit of all Buy positions is 0. Only open position are calculated.
Also, if you have or place pending orders, you will see "Zero Lines" for pending orders, that means that they show the levels, where profit is 0 for all open and pending orders. Those levels are displays as rays.

The indicator is useful for traders that can use several positions and/or orders. The lines display a net position for each group of orders (buy and sell).

Using the parameters of indicators, you can choose what to show on the chart, as well select the color of lines.