• Genel bakış
  • İncelemeler
  • Yorumlar
  • Yenilikler

Candle Oscillator

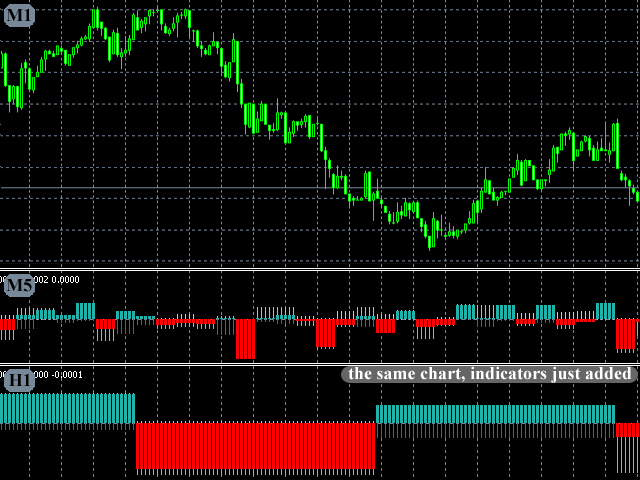
Do you want to see the candlestick formation on a higher timeframe, but do not want to be detached from the lower chart you trade on?

Then this indicator is for you!

It draws candles of any timeframe as histogram bars and accurately replicates the proportions between the candle body and wicks. At the same time, the time scale is not interrupted. For example, on a minute chart, each M5 candle will take up 5 bars. Each candle formed before the start of the indicator will be replicated five times without changes. However, as new 5-minute bars are accumulated, five different candles will be shown, which correspond to the five separate phases of the 5-minute candle formation.

It is possible to run another instance of the indicator, selecting a higher timeframe. It will have a similar behavior. Thus, you will always be informed of the significance of the current price fluctuations.

When the chart scale changes, the histogram width is adjusted automatically, adapting to the selected candle width.

The indicator is tested on Just2trade

The indicator has only one parameter:

  • TimeFrame - identifier of the timeframe to receive the information from.
Önerilen ürünler
Owl smart levels
Sergey Ermolov
4.63 (54)
MT5 versiyonu  |  FAQ Owl Smart Levels Indicator ,   Bill Williams'ın gelişmiş fraktalları , piyasanın doğru dalga yapısını oluşturan Valable ZigZag ve kesin giriş seviyelerini gösteren   Fibonacci seviyeleri   gibi popüler piyasa analiz araçlarını içeren tek gösterge içinde eksiksiz bir ticaret sistemidir. pazara ve kar elde edilecek yerlere. Stratejinin ayrıntılı açıklaması Gösterge ile çalışma talimatı Baykuş Yardımcısı ticaretinde Danışman Yardımcısı Kullanıcıların özel sohbeti -> Satın ald
Wave Wolf MT4
Andrei Salanevich
Forex Dalga Kurt MT4 göstergesi, Wolf dalgalarını aramak ve mevcut ticaret terminali penceresinde görüntülemek için tasarlanmıştır. Ticarette Wolfe dalgalarını kullanan tüccarlar için mükemmel bir gösterge. Ticaret stratejilerinde kullanımı, verimliliğini ve karlılığını önemli ölçüde artıracaktır. GÖSTERGE BİLGİSİ Diğer Wolf dalga göstergelerinin aksine, forex Wave Wold MT4 göstergesinin etkinliğini önemli ölçüde artıran birçok özelliği vardır: Birincisi, Açık Windows 5Point (true) ayarı bi
An indicator of pattern #31 ("Long Island") from Encyclopedia of Chart Patterns by Thomas N. Bulkowski. The second gap is in the opposite direction. Parameters: Alerts - show alert when an arrow appears   Push - send a push notification when an arrow appears (requires configuration in the terminal) GapSize - minimum gap size in points ArrowType - a symbol from 1 to 17 ArrowVShift - vertical shift of arrows in points   ShowLevels - show levels ColUp - color of an upward line ColDn - color of
Chart Patterns Detect 15 patterns (Ascending Triangle, Descending Triangle, Rising Wedge, Falling Wedge, Bullish Flag, Bearish Flag, Bullish Rectangle, Bearish Rectangle Symmetrical triangle, Head and Shoulders, Inverted Head and Shoulders, Triple top, Triple Bottom, Double Top, Double Bottom) Use historical data to calculate the probability of each pattern to succeed (possibility to filter notification according to the chance of success) gives graphic indication about the invalidation level and
The Th3Eng PipFinite indicator is based on a very excellent analysis of the right trend direction with perfect custom algorithms. It show the true direction and the best point to start trading. With StopLoss point and Three Take Profit points. Also it show the right pivot of the price and small points to order to replace the dynamic support and resistance channel, Which surrounds the price. And Finally it draws a very helpful Box on the left side on the chart includes (take profits and Stop loss
Signal trend indicator. Detects the direction of the trend and is coloured accordingly.  Has built in audible and visual alerts when trends change. Can send notifications to your phone or email. Allows Trend and Counter-Trend trading. Works on all timeframes, all currency pairs, metals, indices and cryptocurrencies. Can be used with binary options. Distinctive features No re-drawing; Simple and clear settings; Four types of alerts; Works on all timeframes and all trading tools; Su
The indicator displays the data of the Stochastic oscillator from a higher timeframe on the chart. The main and signal lines are displayed in a separate window. The stepped response is not smoothed. The indicator is useful for practicing "manual" forex trading strategies, which use the data from several screens with different timeframes of a single symbol. The indicator uses the settings that are identical to the standard ones, and a drop-down list for selecting the timeframe. Indicator Parame
What are Heiken Ashi Candles? Heiken Ashi, derived from the Japanese term 'Heikin Ashi,' translates to average price bars. It's an indicator depicting price bars on a chart. Formula for Heiken Ashi candles: - Heiken Ashi opening price: (previous candle's opening + closing price) / 2 - Closing price Heiken Ashi: (opening + high + low + closing) / 4 - Heiken Ashi peak: Max of high, opening, or closing price - Heiken Ashi bottom price: Min of low, opening, or closing price How to Read Heik
Infinity Trend Pro
Yaroslav Varankin
1 (1)
This is a trend indicator without redrawing Developed instead of the binary options strategy (by the color of the Martingale candlestick) Also works well in forex trading When to open trades (binary options) A signal will appear in the place with a candle signaling the current candle It is recommended to open a deal for one candle of the current timeframe M1 and M5 When a blue dot appears, open a deal up When a red dot appears, open a trade down. How to open trades on Forex. When a signal is rec
Trendiness Index
Libertas LLC
5 (3)
"The trend is your friend" is one of the best known sayings in investing, because capturing large trendy price movements can be extremely profitable. However, trading with the trend is often easier said than done, because many indicators are based on price reversals not trends. These aren't very effective at identifying trendy periods, or predicting whether trends will continue. We developed the Trendiness Index to help address this problem by indicating the strength and direction of price trend
Trade with Gann on your side!! MASTER CIRCLE 360 CIRCLE CHART, originally created by Gann admitted that this is “The Mother of all charts”. It is one of the last studies that this great trader left for us. The numeric tab le is apparently quite simple like all the tables and is based on square numbers, the SQUARE OF 12 and is by evolution, one of the most important square numbers. Here we can find CYCLE, PRICE AND TIME thanks to angles and grades, to show past and future support and resistance.
Trend Ray
Andriy Sydoruk
The indicator shows the potential trend direction by cyclical-wave dependence. Thus, all the rays of the intersection will be optimal rays, in the direction of which the price is expected to move, taking into account the indicator period. Rays can be used as a direction for potential market movement. But we must not forget that the approach must be comprehensive, the indicator signals require additional information to enter the market.
Trend Monitor
Pavel Zamoshnikov
4.2 (5)
The indicator generates early signals basing on ADX reading data combined with elements of price patterns. Works on all symbols and timeframes. The indicator does not redraw its signals. You see the same things on history and in real time. For better visual perception signals are displayed as arrows (in order not to overload the chart). Features Easy to use. Filter configuration only requires selection of sensitivity in the " Sensitivity of the indicator " input. Signals can be filtered usin
VR Cub
Vladimir Pastushak
VR Cub , yüksek kaliteli giriş noktaları elde etmenin bir göstergesidir. Gösterge, matematiksel hesaplamaları kolaylaştırmak ve bir pozisyona giriş noktalarının aranmasını basitleştirmek için geliştirildi. Göstergenin yazıldığı ticaret stratejisi uzun yıllardan beri etkinliğini kanıtlamaktadır. Ticaret stratejisinin basitliği, acemi yatırımcıların bile başarılı bir şekilde ticaret yapmasına olanak tanıyan büyük avantajıdır. VR Cub, pozisyon açılış noktalarını ve Kâr Al ve Zararı Durdur hedef sev
ZhiBiCCI MT4
Qiuyang Zheng
5 (1)
[ZhiBiCCI] indicators are suitable for all cycle use, and are also suitable for all market varieties. [ZhiBiCCI] Green solid line is a reversal of bullish divergence. The green dotted line is a classic bullish divergence. [ZhiBiCCI] The solid line to the red is a reverse bearish divergence. The red dotted line is a classical bearish divergence. [ZhiBiCCI] can be set in the parameters (Alert, Send mail, Send notification), set to (true) to send instant signals to the alarm window, email, in
Candlestick Patterns Analytics is a powerful tool for analyzing candlestick patterns. Do you trade based on candlestick patterns? Then Candlestick Patterns Analytics is designed for you. The undeniable advantage of the indicator: Predicts trading result when trading candlestick patterns; Uses statistical data based on the history of the selected symbol and timeframe. What the indicator does Finds and marks on the chart 29 candlestick patterns; Draws arrows to indicate the classical and stati
The Stepping Trend Indicator     The Steppi ng Trend indicator uses the  average true range  (ATR indicator) in its calculation. This gives you control to set your own average true range period, I set the Default as 10.   Indicator Details. Green Arrow Up: This means you are at the starting point of a new bullish trend, it’s time to buy.   Red  Arrow  Down : This means you are at the starting point of a new  bearish  trend, it’ s time to sell .   What if you miss the Arrow Signal?   No
Noize Absorption Index MT4
Ekaterina Saltykova
5 (1)
Noize Absorption Index - is the manual trading system that measures the difference of pressure between bears forces and bulls forces. Green line - is a noize free index that showing curent situation. Zero value of index shows totally choppy/flat market.Values above zero level shows how powerfull bullish wave is and values below zero measures bearish forces.Up arrow appears on bearish market when it's ready to reverse, dn arrow appears on weak bullish market, as a result of reverse expectation. S
Are you tired of the uncertainty that arises when your orders fail to stop at a specific line due to the spread? Look no further! Introducing our  indicator that plots candlesticks based on the Ask price instead of the traditional bid-based chart commonly used in MQL4. With this indicator, you can say goodbye to the frustrations caused by the bid-based chart, as it provides you with a more accurate representation of market movements. By utilizing the Ask price, which represents the price at whic
Atomic Analyst
Issam Kassas
5 (1)
Öncelikle belirtmek gerekir ki bu Ticaret Göstergesi Yeniden Çizim Yapmaz, Gecikmez ve Gecikme Göstermez, bu da hem manuel hem de robot ticareti için ideal hale getirir. Atom Analisti, Piyasada Daha İyi Bir Avantaj Bulmak İçin Fiyatın Gücünü ve Momentumunu Kullanan PA Fiyat Hareketi Göstergesidir. Gürültüleri ve Yanlış Sinyalleri Kaldırmaya ve Ticaret Potansiyelini Artırmaya Yardımcı Olan Gelişmiş Filtrelerle Donatılmıştır. Birden fazla katmanlı karmaşık göstergeler kullanarak, Atom Analisti
The LineMagnit Indicator for MT4 is a highly precise tool that builds support and resistance levels which magnetically attract prices. This feature allows traders to easily determine the most probable entry and exit points in the market, as well as identify the market's directional forces, as levels are based on capital inflows into the instrument. Equipped with an intuitively understandable graphical interface, the LineMagnit Indicator enables users to quickly locate and analyze support and res
Heiken Ashi candle chart is an improved version of The Japanese candle chart, which can effectively filter the market "noise" of the Japanese candle chart. It is favored by many traders for its simplicity and intuition. For trend traders, the HA candle chart is a magic tool. Unlike the traditional Japanese candle chart, Heikenashi does not reflect the opening price, high price, low price and closing price of the market. Instead, Heikenashi calculates the value of a single K line in the dominant
Master Scalping M1 , trendi hızlı ve doğru bir şekilde belirlemek için bir algoritma kullanan yenilikçi bir göstergedir. Gösterge, pozisyonların açılış ve kapanış zamanını hesaplar, gösterge algoritmaları, bir ticarete girmek (bir varlık satın almak veya satmak) için ideal anları bulmanızı sağlar, bu da çoğu tüccar için işlemlerin başarısını artırır. Göstergenin faydaları: Kullanımı kolaydır, çizelgeyi gereksiz bilgilerle aşırı yüklemez. Herhangi bir strateji için bir filtre olarak kullanılabili
Bu, bir mumun kapanış fiyatını tahmin eden bir göstergedir. Gösterge öncelikle D1 çizelgelerinde kullanılmak üzere tasarlanmıştır. Bu gösterge hem geleneksel forex ticareti hem de ikili opsiyon ticareti için uygundur. Gösterge, bağımsız bir ticaret sistemi olarak kullanılabilir veya mevcut ticaret sisteminize ek olarak hareket edebilir. Bu gösterge, mevcut mumu analiz ederek mumun gövdesi içindeki belirli güç faktörlerini ve önceki mumun parametrelerini hesaplar. Böylece gösterge, piyasa hareket
Trend Scanner
Vladimir Kalendzhyan
4.38 (8)
By purchasing this indicator, you have the right to receive a free copy of one of   my other indicator's or advisor’s!  (All future updates are included. No limits) . To get it , please contact me by  mql5 message ! The Trend Scanner trend line indicator displays the trend direction and its changes. The indicator works on all currency pairs and  timeframes. The indicator simultaneously displays multiple readings on the price chart: the support and resistance lines of the currency pair, the exist
Trend PA
Mikhail Nazarenko
5 (3)
The Trend PA indicator uses   Price Action   and its own filtering algorithm to determine the trend. This approach helps to accurately determine entry points and the current trend on any timeframe. The indicator uses its own algorithm for analyzing price changes and Price Action. Which gives you the advantage of recognizing, without delay, a new nascent trend with fewer false positives. Trend filtering conditions can be selected in the settings individually for your trading style. The indicator
This indicator monitors the market for a flat state and possible breakout. The flat state is detected as a predefined number of consecutive bars during which price fluctuates inside a small range. If one of the next bars closes outside the range, breakout is signaled. The indicator shows 3 lines: blue - upper bound of flat ranges AND consecutive breakout areas; red - lower bound of flat ranges AND consecutive breakout areas; yellow - center of flat ranges (NOT including breakout areas). When a b
Fibonacci retracement and extension line drawing tool Fibonacci retracement and extended line drawing tool for MT4 platform is suitable for traders who use  golden section trading Advantages: There is no extra line, no too long line, and it is easy to observe and find trading opportunities Trial version: https://www.mql5.com/zh/market/product/35884 Main functions: 1. Multiple groups of Fibonacci turns can be drawn directly, and the relationship between important turning points
The indicator detects and displays Shark harmonic pattern (see the screenshot). The pattern is plotted by the extreme values of the ZigZag indicator (included in the resources, no need to install). After detecting the pattern, the indicator notifies of that by a pop-up window, a mobile notification and an email. The indicator highlights the process of the pattern formation and not just the complete pattern. In the former case, it is displayed in the contour triangles. After the pattern is comple
Akendicator X is a Non-repainting Indicator for trading at 5-15 minutes Timeframe.  Akendicator X extimates with clear arrows, in which direction the next candlestick will move. Pratically, when the length of the last candle reaches and exceeds a particular value (called Candle Power) immediately, after its closing, an arrow appears indicating whether the next candle could be Bullish or Bearish. I created a manual in pdf where you should learn exactly how to use AKENDICATOR X correctly; I will s
Bu ürünün alıcıları ayrıca şunları da satın alıyor
Gann Made Easy
Oleg Rodin
4.96 (46)
Gann Made Easy , bay teorisini kullanarak ticaretin en iyi ilkelerine dayanan, profesyonel ve kullanımı kolay bir Forex ticaret sistemidir. WD Gann. Gösterge, Zararı Durdur ve Kâr Al Seviyeleri dahil olmak üzere doğru SATIN AL ve SAT sinyalleri sağlar. PUSH bildirimlerini kullanarak hareket halindeyken bile işlem yapabilirsiniz. Lütfen satın aldıktan sonra benimle iletişime geçin! Alım satım ipuçlarımı ve harika bonus göstergelerini ücretsiz olarak sizinle paylaşacağım! Muhtemelen Gann ticaret y
ŞU ANDA %26 INDIRIMLI Yeni Başlayanlar veya Uzman Tüccarlar için En İyi Çözüm! Bu Gösterge benzersiz, yüksek kaliteli ve uygun fiyatlı bir ticaret aracıdır çünkü bir dizi tescilli özellik ve yeni bir formül ekledik. Sadece BİR grafik ile 28 Forex çifti için Döviz Gücünü okuyabilirsiniz! Yeni bir trendin veya scalping fırsatının tam tetik noktasını belirleyebildiğiniz için ticaretinizin nasıl gelişeceğini hayal edin? Kullanım kılavuzu: buraya tıklayın Bu ilk olan, orijinal! Değersiz bir
Scalper Vault
Oleg Rodin
5 (27)
Scalper Vault , başarılı bir scalping için ihtiyacınız olan her şeyi size sağlayan profesyonel bir scalping sistemidir. Bu gösterge, forex ve ikili opsiyon tüccarları tarafından kullanılabilecek eksiksiz bir ticaret sistemidir. Önerilen zaman çerçevesi M5'tir. Sistem size trend yönünde doğru ok sinyalleri sağlar. Ayrıca size üst ve alt sinyaller ve Gann piyasa seviyeleri sağlar. Göstergeler, PUSH bildirimleri dahil her türlü uyarıyı sağlar. Göstergeyi satın aldıktan sonra lütfen benimle iletişim
Trend Screener
STE S.S.COMPANY
4.83 (86)
Trend Göstergesi, Trend Alım Satım ve Filtreleme için Çığır Açan Benzersiz Çözüm, Tüm Önemli Trend Özellikleriyle Tek Bir Araç İçinde Yerleştirildi! Forex, emtialar, kripto para birimleri, endeksler ve hisse senetleri gibi tüm sembollerde/araçlarda kullanılabilen %100 yeniden boyamayan çoklu zaman çerçevesi ve Çoklu para birimi göstergesidir. Trend Screener, grafikte noktalarla ok trend sinyalleri sağlayan etkili bir trend trend göstergesidir. Trend analizörü göstergesinde bulunan özellikler: 1.
TPSproTREND PrO
Roman Podpora
5 (15)
TPSpro TRENDPRO  - is a trend indicator that automatically analyzes the market and provides information about the trend and each of its changes, as well as giving signals for entering trades without redrawing! The indicator uses each candle, analyzing them separately. referring to different impulses - up or down impulse. Exact entry points into transactions for currencies, crypto, metals, stocks, indices!  -  Version MT5               DETAILED DESCRIPTION        /       TRADING SETUPS           
Tanıtım       Kuantum Trend Keskin Nişancı Göstergesi   , trend tersine dönmeleri belirleme ve ticaret yapma şeklinizi değiştiren çığır açan MQL5 Göstergesi! 13 yılı aşkın ticaret tecrübesine sahip deneyimli tüccarlardan oluşan bir ekip tarafından geliştirilmiştir.       Kuantum Trend Keskin Nişancı Göstergesi       trend dönüşlerini son derece yüksek doğrulukla belirlemenin yenilikçi yolu ile ticaret yolculuğunuzu yeni zirvelere taşımak için tasarlanmıştır. ***Kuantum Trend Keskin Nişancı Gö
Öncelikle, bu Ticaret Aracının Non-Repainting, Non-Redrawing ve Non-Lagging Gösterge olduğunu vurgulamakta fayda var, bu da onu profesyonel ticaret için ideal hale getiriyor. Akıllı Fiyat Hareketi Kavramları Göstergesi, hem yeni hem de deneyimli tüccarlar için çok güçlü bir araçtır. İleri ticaret fikirlerini, Inner Circle Trader Analizi ve Smart Money Concepts Ticaret Stratejileri gibi 20'den fazla kullanışlı göstergeyi bir araya getirerek bir araya getirir. Bu gösterge, büyük kurumların tica
Fiyat tersine döndükçe ve geri çekildikçe piyasa yapısından elde edilen kâr değişir. Piyasa yapısını tersine çevirme uyarısı göstergesi, bir trendin veya fiyat hareketinin ne zaman tükenmeye yaklaştığını ve tersine dönmeye hazır olduğunu tanımlar. Genellikle bir geri dönüş veya büyük bir geri çekilme meydana gelmek üzereyken meydana gelen piyasa yapısındaki değişiklikler konusunda sizi uyarır. Gösterge, olası bir tükenme noktasının yakınında her yeni yüksek veya düşük oluştuğunda, başlangıçta
Scalper Inside PRO
Alexey Minkov
4.75 (55)
SALE NOW! Limited Time Offer! An exclusive indicator that utilizes an innovative algorithm to swiftly and accurately determine the market trend. The indicator automatically calculates opening, closing, and profit levels, providing detailed trading statistics. With these features, you can choose the most appropriate trading instrument for the current market conditions. Additionally, you can easily integrate your own arrow indicators into Scalper Inside Pro to quickly evaluate their statistics and
Advanced Supply Demand
Bernhard Schweigert
4.92 (310)
CURRENTLY 26% OFF !! Best Solution for any Newbie or Expert Trader! This indicator is a unique, high quality and affordable trading tool because we have incorporated a number of proprietary features and a new formula. With this update, you will be able to show double timeframe zones. You will not only be able to show a higher TF but to show both, the chart TF, PLUS the higher TF: SHOWING NESTED ZONES. All Supply Demand traders will love it. :) Important Information Revealed Maximize the potenti
TPSpro RFI Levels
Roman Podpora
5 (13)
A key element in trading is zones or levels from which decisions to buy or sell a trading instrument are made. Despite attempts by major players to conceal their presence in the market, they inevitably leave traces. Our task was to learn how to identify these traces and interpret them correctly. Reversal First Impulse levels (RFI)   -  Version MT5                INSTRUCTIONS                 RUS                 ENG                                       R ecommended to use with an indicator   -  
Özel MT4 göstergemizle başarılı forex ticaretinin sırrını keşfedin! Forex piyasasında nasıl başarıya ulaşacağınızı hiç merak ettiniz, riski en aza indirirken sürekli olarak kar kazandınız mı? İşte aradığınız cevap! Ticaret yaklaşımınızda devrim yaratacak tescilli MT4 göstergimizi tanıtmamıza izin verin. Benzersiz çok yönlülük Göstergemiz, Renko ve RangeBar Mum oluşumlarını tercih eden kullanıcılar için özel olarak tasarlanmıştır. Bu grafik türlerinin birçok deneyimli tüccar tarafından ter
TrendMaestro
Stefano Frisetti
5 (2)
note: this indicator is for METATRADER4, if you want the version for METATRADER5 this is the link: TRENDMAESTRO recognizes a new TREND in the bud, he never makes mistakes. The certainty of identifying a new TREND is priceless. DESCRIPTION TRENDMAESTRO identifies a new TREND in the bud, this indicator examines the volatility, volumes and momentum to identify the moment in which there is an explosion of one or more of these data and therefore the moment in which prices have strong probability of f
Şu anda %20 İNDİRİMLİ! Herhangi bir Acemi veya Uzman Tüccar için En İyi Çözüm! Bu gösterge paneli yazılımı 28 döviz çifti üzerinde çalışıyor. Ana göstergelerimizden 2'sine (Gelişmiş Para Birimi Gücü 28 ve Gelişmiş Para Birimi Dürtüsü) dayanmaktadır. Tüm Forex piyasasına harika bir genel bakış sağlar. Gelişmiş Para Birimi Gücü değerlerini, para birimi hareket hızını ve tüm (9) zaman dilimlerinde 28 Forex çifti için sinyalleri gösterir. Trendleri ve / veya scalping fırsatlarını belirlemek içi
Mucizevi Forex Göstergesi Tanıtımı: Keskin Ticaretin Gücünü Serbest Bırakın Tüm zaman dilimlerinde gerçekten olağanüstü sonuçlar sunan en iyi Forex göstergesini aramaktan sıkıldınız mı? Artık aramayın! Mucizevi Forex Göstergesi, ticaret deneyiminizi devrimleştirip kazançlarınızı yeni zirvelere taşımak için burada. Gelişmiş teknoloji ve yılların özenli geliştirmesi temelinde Mucizevi Forex Göstergesi, döviz piyasasında güç ve keskinlik açısından doruğa çıkar. Bu olağanüstü araç, tüm seviyelerdeki
ÇOKLU PARA BİRİMİ ve ÇOK ZAMANLI ÇERÇEVE ALIM VE SATIŞ UYARISI. OTOMATİK TAKİP DURDURMA VE RİSK ÖDÜLÜ KÂR AL! GÖSTERGE TARAMALARI VE PİYASAYI ANALİZ ETMEK, YAPACAK BİR ŞEYİNİZ YOK! TÜM PARA BİRİMLERİNİZİ 1 GRAFİKTE İŞLEM YAPIN!   Satın aldıktan sonra lütfen yorum bırakın benimle iletişime geçin, size ticaret asistanı EA'yı göndereceğim. Gösterge, en iyi ONAYLANMIŞ giriş noktalarını bulmak için çeşitli Osilatörler ve ekli filtreler kullanıyor, bu nedenle bu konuda endişelenmenize gerek yok
Entry Points Pro
Yury Orlov
4.7 (224)
Yeniden boyamadan bir ticarete girmek için doğru sinyaller sağlayan MT5 için en iyi gösterge! Herhangi bir finansal varlığa uygulanabilir: forex, kripto para birimleri, metaller, hisse senetleri, endeksler. MT5 versiyonu burada Oldukça doğru alım satım sinyalleri sağlayacak ve bir alım satımı açıp kapatmanın en iyi zamanını size söyleyecektir. Göstergeyi ödeyen yalnızca bir sinyali işleme örneğiyle videoyu (6:22) izleyin! Çoğu tüccar, Giriş Noktaları Pro göstergesinin yardımıyla ilk işl
Trend Forecasting
Mohamed Hassan
5 (15)
This indicator is unstoppable when combined with our other indicator called Katana. After purchase, send us a message and you could get Katana for FREE as a BONUS After purchase, send us a private message for your instructions.  MT5 version: click here 40 copies available at $55. There are 3 copies left before the next price of $105. Don't miss this great deal!  The Trend Forecasting indicator is a very unique & easy tool that is able to make prediction about future price movement
Quantum Breakout Indicator PRO
Bogdan Ion Puscasu
4.96 (26)
Tanıtım       Quantum Breakout PRO   , Breakout Bölgeleri ile ticaret yapma şeklinizi değiştiren çığır açan MQL5 Göstergesi! 13 yılı aşkın ticaret deneyimine sahip deneyimli tüccarlardan oluşan bir ekip tarafından geliştirilen   Quantum Breakout PRO   , yenilikçi ve dinamik koparma bölgesi stratejisiyle ticaret yolculuğunuzu yeni zirvelere taşımak için tasarlanmıştır. Kuantum Breakout Göstergesi, size 5 kar hedefi bölgesi ile kırılma bölgelerinde sinyal okları ve kırılma kutusuna dayalı ol
PRO Renko Sistemi, RENKO grafikleri ticareti için özel olarak tasarlanmış son derece hassas bir ticaret sistemidir. Bu, çeşitli ticaret araçlarına uygulanabilen evrensel bir sistemdir. Sistemi etkin piyasa sana doğru ters sinyallerine erişim hakkı denilen ses nötralize eder. Göstergenin kullanımı çok kolaydır ve sinyal üretiminden sorumlu tek bir parametreye sahiptir. Aracı, seçtiğiniz herhangi bir ticaret aracına ve renko çubuğunun boyutuna kolayca uyarlayabilirsiniz. Yazılımımla karlı b
FX Power MT4 NG
Daniel Stein
5 (8)
Sabah Brifingimiz burada mql5 ve on Telegram! FX Power MT4 NG , uzun zamandır çok popüler olan döviz gücü ölçerimiz FX Power'ın yeni neslidir. Peki bu yeni nesil güç ölçer ne sunuyor? Orijinal FX Power hakkında sevdiğiniz her şey PLUS GOLD/XAU güç analizi Daha da hassas hesaplama sonuçları Ayrı ayrı yapılandırılabilir analiz dönemleri Daha da iyi performans için özelleştirilebilir hesaplama limiti Özel çokluDaha fazlasını görmek isteyenler için örnek ayarlar Her grafikte en sevdiğiniz renkler i
Break and Retest
Mohamed Hassan
5 (2)
Break & Retest is unstoppable when combined with our other divergence indicator. After purchase, send us a message and you could get this  2nd indicator  for  FREE  as a  BONUS! ‍You can visually backtest Break & Retest to see how it behaved in the past!    Manual guide:   Click here $59  for the first 25 copies ( 7  left)! Next price is $120 .  After many months of hard work and dedication, we are extremely proud to present you our  Break and Retest price action indicator crea
ŞU ANDA %31 INDIRIMLI !!! Yeni Başlayanlar veya Uzman Tüccarlar için En İyi Çözüm! Bu gösterge benzersiz, yüksek kaliteli ve uygun fiyatlı bir ticaret aracıdır çünkü bir dizi tescilli özellik ve gizli bir formül ekledik. Yalnızca BİR grafikle 28 döviz çiftinin tümü için Uyarılar verir. Yeni bir trendin veya scalping fırsatının tam tetik noktasını belirleyebildiğiniz için ticaretinizin nasıl gelişeceğini hayal edin! Yeni temel algoritmalar üzerine inşa edilen bu sistem, potansiyel işlemler
TrendDecoder Premium
Christophe, Pa Trouillas
5 (3)
Aralıkları ve bir sonraki olası hamleleri belirleyin   |  Trendlerin en erken sinyallerini ve gücünü alın   |  Geri dönüşten önce net çıkışlar alın   |  Fiyatın test edeceği Fibo seviyelerini tespit edin Gecikmesiz, takip edilmeyen gösterge - manuel ve otomatik ticaret için ideal - tüm varlıklar ve tüm zaman birimleri için uygun Sınırlı süreli teklif >>   %50 İNDİRİM Satın aldıktan sonra, kişiselleştirilmiş ayarlar için bu kanaldan benimle iletişime geçin . MT5   sürümü:   buraya tıklayın Tam y
ADR Ters Çevirme Göstergesi, normal ortalama günlük aralığına göre fiyatın şu anda nerede işlem gördüğünü bir bakışta size gösterir. Fiyat, ortalama aralığı ve seçtiğiniz seviyenin üzerindeki seviyeleri aştığında, açılır pencere, e-posta veya push yoluyla anında uyarılar alacaksınız, böylece hızlı bir şekilde geri çekilmelere ve geri dönüşlere atlayabilirsiniz. Gösterge, grafikte ortalama günlük aralık uç noktalarında yatay çizgiler ve ayrıca fiyatları aşan matematiksel olasılıkları olan seviye
Currency Strength Wizard , başarılı ticaret için size hepsi bir arada çözüm sağlayan çok güçlü bir göstergedir. Gösterge, birden çok zaman dilimindeki tüm para birimlerinin verilerini kullanarak şu veya bu forex çiftinin gücünü hesaplar. Bu veriler, şu veya bu para biriminin gücünü görmek için kullanabileceğiniz, kullanımı kolay para birimi endeksi ve para birimi güç hatları biçiminde temsil edilir. İhtiyacınız olan tek şey, işlem yapmak istediğiniz tabloya göstergeyi eklemektir ve gösterge size
Shepherd Harmonic Pattern
Abdullah Alrai
4.68 (59)
Bu gösterge, manuel ve otomatik yöntemlerle çizilen harmonik desenleri algılar. Kullanım kılavuzuna şu bağlantıdan erişebilirsiniz: İncelemenizi ekleyin ve ürünü almak için bizimle iletişime geçin. Bu ürünü mt4'te denemek için ücretsiz bir sürümü vardır. Gartley ve Nenstar desenlerini algılamak için kullanabilirsiniz: https://www.mql5.com/en/market/product/30181 Tam MT4 sürümünü şuradan satın alabilirsiniz: https://www.mql5.com/en/market/product/15212 Notlar Gösterge kontrol paneline sahiptir ve
FX Volume
Daniel Stein
4.6 (35)
Sabah Brifingimiz aracılığıyla ayrıntılar ve ekran görüntüleri ile günlük piyasa güncellemenizi alın burada mql5 ve on Telegram ! FX Volume, bir brokerin bakış açısından piyasa duyarlılığı hakkında GERÇEK bir fikir veren İLK ve TEK hacim göstergesidir. COT raporlarından çok daha hızlı bir şekilde, brokerlar gibi kurumsal piyasa katılımcılarının Forex piyasasında nasıl konumlandıklarına dair harika bilgiler sağlar. Bu bilgileri doğrudan grafiğinizde görmek, ticaretiniz için gerçek oyun değiştir
Öncelikle, bu Trading Sisteminin Non-Repainting, Non-Redrawing ve Non-Lagging Gösterge olduğunu vurgulamak önemlidir, bu da profesyonel ticaret için ideal hale getirir. "Smart Support and Resistance Trading System", yeni ve deneyimli tüccarlar için özel olarak tasarlanmış gelişmiş bir göstergedir. Forex piyasasında tüccarları hassasiyet ve güvenle donatır. Bu kapsamlı sistem, 7'den fazla strateji, 10 gösterge ve günlük ticaret stratejisi, swing ticaret stratejisi, destek ve direnç stratejisi,
How to use Pair Trading Station Pair Trading Station is recommended for H1 time frame and you can use it for any currency pairs. To generate buy and sell signal, follow few steps below to apply Pair Trading Station to your MetaTrader terminal. When you load Pair Trading Station on your chart, Pair Trading station will assess available historical data in your MetaTrader platforms for each currency pair. On your chart, the amount of historical data available will be displayed for each currency pai
Yazarın diğer ürünleri
Ma Multi Mt5
Dmitriy Susloparov
This is the same Ma Multi indicator that was previously available only for Mt4 .    Now there is a version for Mt5 .     It belongs to a whole family of multi-frame indicators, implementing the idea of displaying different timeframes in a single time scale. Horizontal fixation the scale allows one glance to get the big picture and provides additional opportunities for technical analysis. The indicator is tested on Just2trade Indicator parameters: MA_Period - averaging period of the moving av
EAAgrTest
Dmitriy Susloparov
3 (1)
EA_Agr_Test This is a free version of EA_Agr_Full , designed to provide the buyer with the opportunity to check the product not in the tester, but on a live account. Here exactly the same trading algorithm is used, but there is no possibility to change the parameters, except for GMToffset . Orders cannot be more than 0.01 lot and profit is taken very early. For this reason, it is impossible to achieve high returns. Algorithm verified with broker just2trade Parameters GMToffset - dif
FREE
Price Trap Test
Dmitriy Susloparov
1 (1)
Price Trap Test This is a free version of the Price Trap Full Expert Advisor designed to provide an opportunity for free testing of the algorithm on a live account, and not in the strategy tester. The trading signals algorithm is exactly the same here, the difference is that you cannot change the parameters, with the exception of GMToffset . Full version verified with broker just2trade Parameters GMToffset - your broker's time difference and GMT.
FREE
EA_Mrk_Test In fact, this is the free version of EA_Mrk_Full . The algorithm for generating trading signals is exactly the same, the difference is that you cannot change any parameters here, except for GMToffset . The Expert Advisor uses all the good practices from previous versions, but here it is applied a completely different approach to the formation of trading signals. Based on a paradigm "following the market", when instead of trying to forecast a trend change is determined post factu
FREE
WPR Mtf
Dmitriy Susloparov
WPR Mtf This is a multi-frame version of the standard indicator " Williams Percent Range ". Like the other indicators of the author, it allows you to see any set of timeframes at the same time, and all they will be presented on a scale of the current price chart. You can choose any set of timeframes of the indicator and freely switch to the price chart in both the highter and the lower direction. For each price period, indicator charts will always be displayed at the correct scale. The indica
The indicator shows the direction of the current trend based on the calculation of the Average Directional Movement Index, but has two important differences from the standard ADM indicator: it presents the results as a simple and intuitive oscillator, and allows to set a custom sensitivity threshold to cut off the market noise. The histogram shows the value and sign of the difference between the +DI and -DI lines: on an uptrend the +DI is higher, the difference is positive, and its value is disp
Ma Multi
Dmitriy Susloparov
5 (4)
This is a fully multi timeframe version of the Moving average standard indicator, which works for any combination of timeframes. The indicator allows quickly and effortlessly viewing the charts from different timeframes at the same time. You can create and set of intervals and freely switch to a higher or lower one. At the same time, the selected charts will always be displayed in a correct time scale. The interaction of the short-term and long-term trends will be clearly visible, and it will al
Force Multi
Dmitriy Susloparov
This is a multitimeframe version of the popular Force index oscillator. Interpretation of the conventional version of the indicator is relatively complex, therefore, its multitimeframe representation is especially relevant. Monitoring different periods becomes comfortable and the indicator turns out to be more informative. It provides the ability to show or hide any graphs, from minute to daily inclusive. It is also possible to select the oscillator plotting style: line, section or histogram. Yo
ROC Multiframe
Dmitriy Susloparov
This is a true Price Rate-of-Change multi-timeframe indicator. It shows the charts of various timeframes in a single window converting them to the time scale used to perform trades. You are able to select both higher and lower timeframes, as well as change the main trading timeframe. You will always see all the lines of the indicator on the right scale. Two color scheme variants are available: with color change when crossing zero, and without. You can also define the data display style (lines or
ROC Signal
Dmitriy Susloparov
This oscillator generates trade signals based on the analysis of two smoothed Price Rate-of-Change graphs, which are calculated using different periods. One of the graphs is used as the main one, the second as the signal line. The difference between them is displayed as an oscillator in the form of a histogram, divided into four phases: the beginning of the rise, the completion of the rise, the beginning of the fall and the end of the fall. When the color is bright blue, the ROC indicator intens
ATR Channel Multiframe
Dmitriy Susloparov
5 (1)
This is a fully multitimeframe version of the ATR Channel standard indicator, which works for any combination of timeframes. The indicator allows viewing price channels from different timeframes in one window, and they will always be displayed in a correct time scale. You can create and set of intervals and freely switch to a higher or lower one. Please note: in the " From Median Price " display mode, it is easy to identify reversal points at intersections of levels from higher timeframes by lev
CCI Mtf
Dmitriy Susloparov
This is a fully multi-timeframe version of the Commodity Channel Index standard indicator, which works for any combination of timeframes. The indicator preserves the correct time scale for all charts at any intervals. When switching to a higher or lower timeframe, the time scale is not distorted. For example, one value of М15 will occupy 15 bars on М1 and 3 bars on М5 . The indicator allows you to see the real dynamics and the overall ratio for all selected periods, as well as accurately evaluat
DeMarker Mtf
Dmitriy Susloparov
This is a fully multi-timeframe version of the DeMarker standard indicator, which works for any combination of timeframes. Like my other multi-timeframe indicators, it implements the idea of saving the right time scale for all charts on any intervals. When switching to the higher or lower timeframe, the time scale is not distorted. For example, one value of М15 will occupy 15 bars on М1 and 3 bars on М5 . The indicator allows you to see the real dynamics and the overall ratio for all selected pe
RSI Mtf
Dmitriy Susloparov
RSI Mtf This is a multi-frame version of the standard indicator " Relative Strength Index ". Here, the same ideology is implemented, as in other indicators of the author, such as " Ma_Multi ", " CCI MTF ", " DeMarker Mtf ", " Force Multi ". Their common distinguishing feature is the observance of the correct time scale. In the indicator window you can create any set of timeframes, and the scale of each will always correspond to the scale of the current price chart. This way you can see the ov
ADM Multiframe
Dmitriy Susloparov
ADM Oscillator Multiframe Unlike the classic indicator " Average Direction Movement index ", this indicator shows directly the difference between the +DI and -DI values. When +DI is greater than -DI results above zero and vice versa. This is more visual and, in addition, allows you to clearly see the interaction of indicator readings for different timeframes. It also uses a proprietary technology that allows you to see different timeframes simultaneously on a single time scale. For example, f
EA Mrk Full The Expert Advisor uses all the good practices from previous versions, but here it is applied a completely different approach to the formation of trading signals. Based on a paradigm "following the market", when instead of trying to forecast a trend change is determined post factum. In addition, the newly developed adaptive trailing technology is used to manage pending orders when the order position changes depending on the situation. This allows you to protect the pending order
EAAgrFull
Dmitriy Susloparov
EA_Agr_Full This is the result of the EA_Mrk_Full EA evolution. Inheriting all the successful solutions, it is, nevertheless, a completely new product, as it uses a newly discovered technology. The EA has two separate algorithms for working with pending orders, as well as an expert system that determines the current state of the market. The Expert Advisor automatically selects the optimal algorithm depending on which phase the trading processes enter. Thanks to this, the program confidently c
Price Trap Full The Expert Advisor inherits some principles tested in the previous products of the author, but uses a different algorithm for working with pending orders. According to the test results, we managed to achieve the best ratio of profit and drawdown here. The algorithm can work on any currency pair and any timeframe, but the best results were achieved on XAUUSD M5 . Algorithm verified with broker just2trade On a real account, the EA works no worse than in the strategy tester, you c
Wpr Mtf Mt5
Dmitriy Susloparov
This is a multi-frame version of the standard indicator " Williams Percent Range ", that was previously available only for Mt4 .  Now there is a version for Mt5 .  Like the other indicators of the author, it allows you to see any set of timeframes at the same time, and all they will be presented on a scale of the current price chart. You can choose any set of timeframes of the indicator and freely switch to the price chart in both the highter and the lower direction. For each price period, indi
Filtrele:
İnceleme yok
İncelemeye yanıt
Sürüm 1.1 2021.11.17
New compilator