Pinbar scanner with RSI filter
- Göstergeler
- Jan Flodin
- Sürüm: 2.0
- Güncellendi: 9 Haziran 2022
- Etkinleştirmeler: 10
I recommend you to read the product's blog (manual) from start to end so that it is clear from the beginning what the indicactor offers.
This multi time frame and multi symbol indicator scans for pin bars. Combined with your own rules and techniques, this indicator will allow you to create (or enhance) your own powerful system.
Features
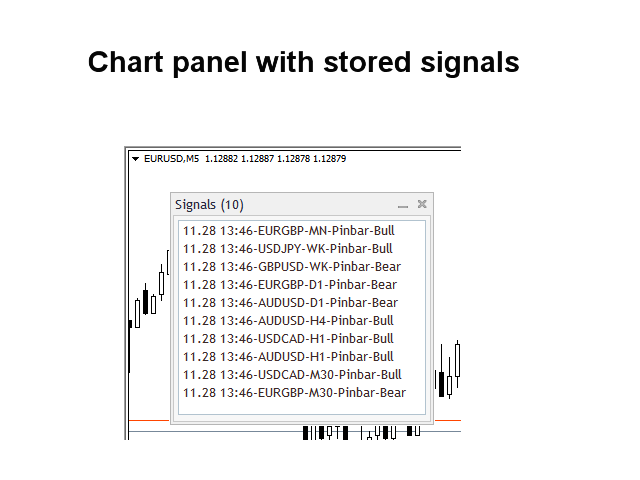
- Can monitor all symbols visible in your Market Watch window at the same time. Apply the indicator to just one chart and instantly monitor the entire market.
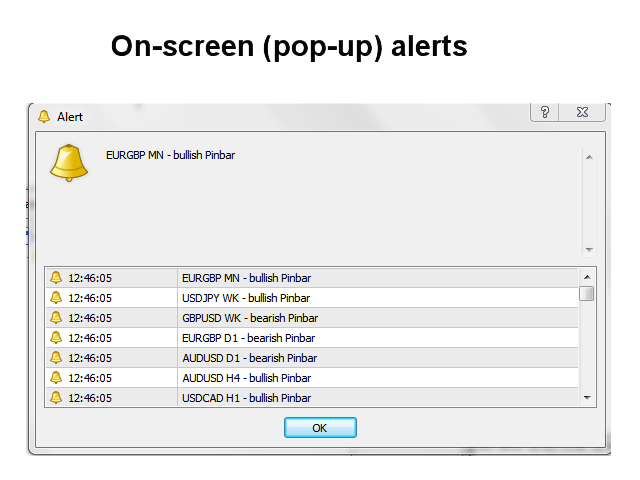
- Can monitors every time frame, from M1 to MN, and sends you a real-time alert when a pin bar is identified. All Metatrader native alert types are supported.
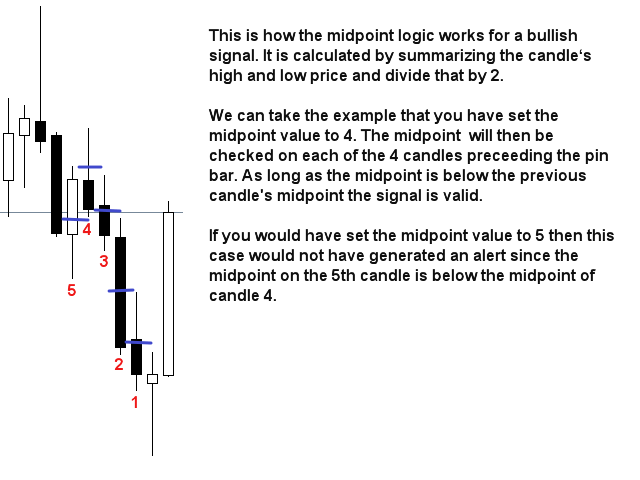
- Uses RSI as a trend filter in order to properly identify potential reversals.
- The indicator includes an interactive panel. Please see separate screenshot.
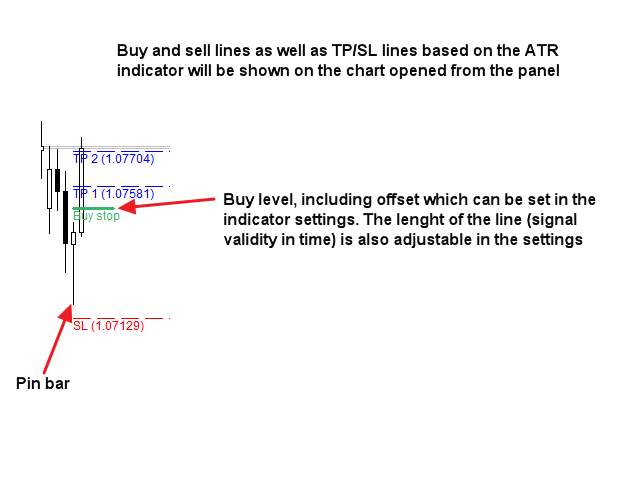
- Can be configured to show buy/sell lines and TP/SL lines (based on ATR multiplier). The lines will be shown on the chart which you open by clicking on a signal in the panel. Please see screenshot below
- The indicator can write the signals as global variables which can be used by an Expert Advisor for auto trading.
Input parameters
The description and explanation of the input parameters can be found here.
Important
Please note that due to the multifunctionality neither buy/sell advice nor lines and arrows will be drawn on the chart where the indicator is installed. It is highly advisable to put the indicator on a clean (empty) chart without any other indicators or Expert Advisors on it which could interfere with the scanner.


Kullanıcı incelemeye herhangi bir yorum bırakmadı