Opening Range Breakout Paths
- Göstergeler
- Sürüm: 1.0
- Etkinleştirmeler: 10

Opening Range Breakout Paths
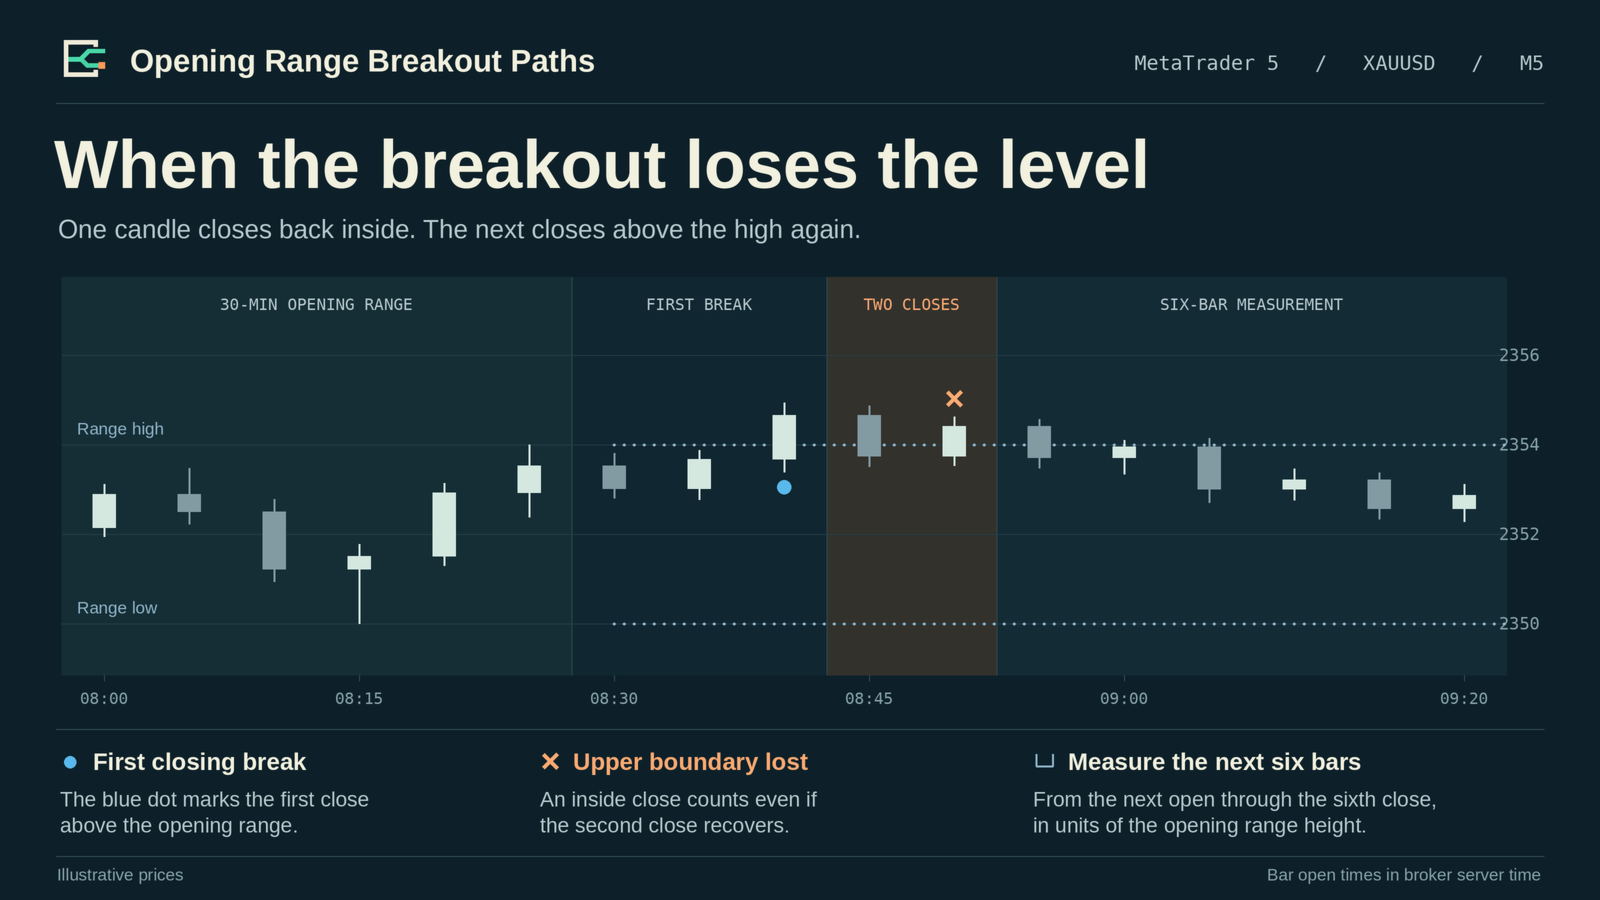
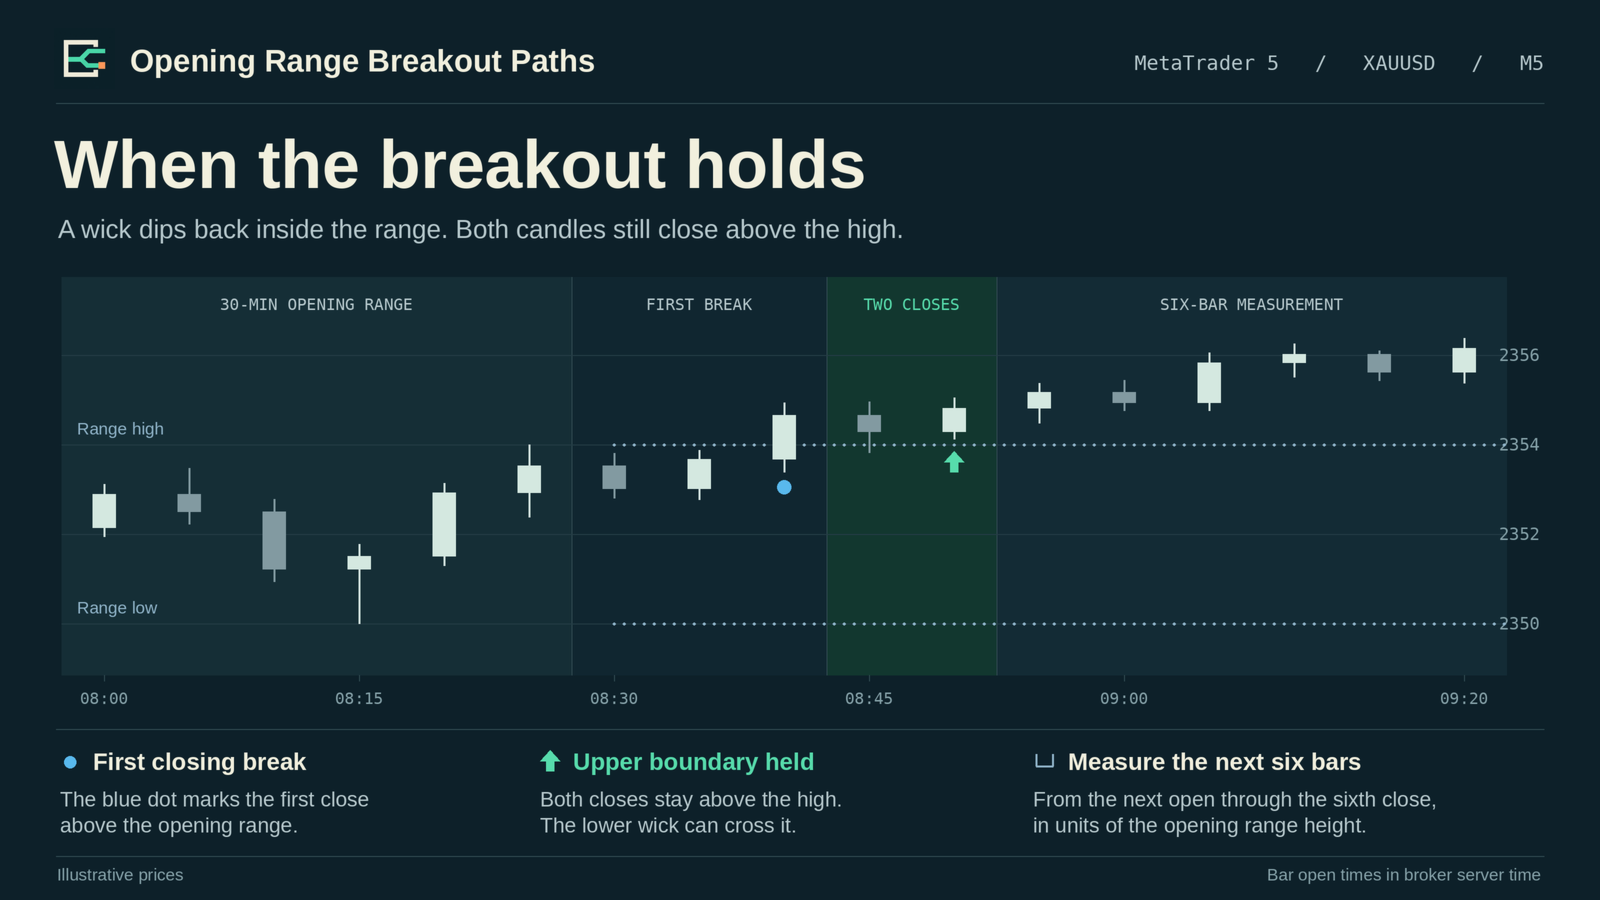
Opening Range Breakout Paths is an intraday indicator for MetaTrader 5. It marks the session high and low formed during the opening range and tracks the first candle to close outside it. The chart then answers a second question. Once the breakout has been classified, how far does price move in the original direction?
Reading the chart
Two dotted lines show the opening range after it is complete. A blue dot marks the first close above or below the range. With the default settings, the next two candle closes determine the result. A green arrow means both closes stayed beyond the original boundary. An orange cross means at least one closed on that boundary or back across it. An intrabar wick alone does not change the classification.
Measuring follow-through
Measurement starts at the open of the candle after classification and ends at the close of the sixth measurement candle by default. Both paths use the same timing. The panel shows the count and mean movement for upward and downward breaks, with separate rows for held and lost boundaries. One unit equals the height of that session's opening range. A negative value indicates an adverse result after any fixed cost entered in the settings.
Comparing sessions
Rolling mode compares two successive groups of completed cases. Alternatively, choose a fixed evaluation date to compare the last cases before it with the first cases from it onward. Each group contains up to 60 cases by default. Only observations with sufficient continuous chart history enter the comparison. The figures describe the selected symbol, timeframe, session and loaded history.
Getting started
Attach the indicator to a five-minute chart. Set the opening time in broker server time and choose the range and session lengths. The defaults are a 30-minute opening range and an eight-hour session. For a London or New York study, set the corresponding broker time and account for daylight-saving changes. Desktop alerts and mobile notifications are optional. The indicator reads chart prices and places no orders.