Z N Pattern Price Action Candle Pullback Scanner
- Göstergeler
- Sürüm: 1.0
- Etkinleştirmeler: 5

Overview
- Product Identity: Pola MultiCandle Scanner Dashboard is a multi-pair and multi-timeframe technical analysis indicator and market scanner developed for MetaTrader 4 (MT4).
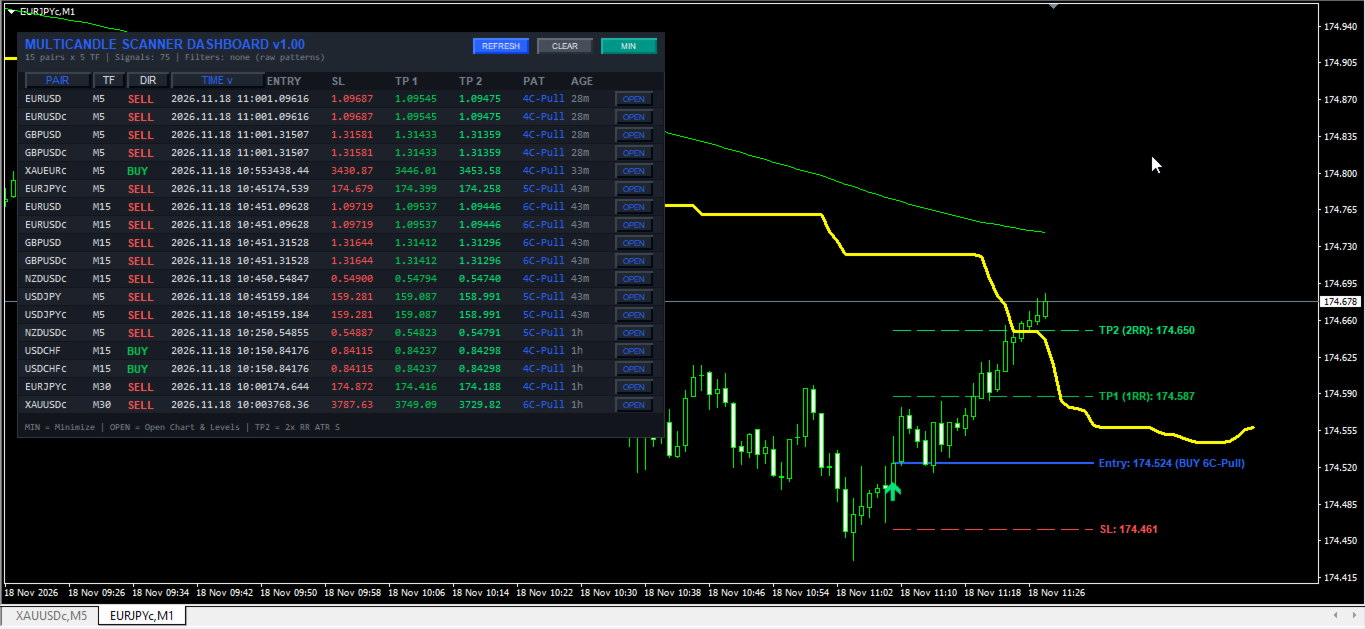
- Core Purpose: Continuously monitors user-defined currency pairs, precious metals, or Market Watch instruments across multiple timeframes to detect structured multi-candle price action formations, validate setups through a modular 15-indicator confluence suite, calculate volatility-adjusted Stop Loss (SL) and dual Take Profit (TP1 and TP2) reference levels, and present actionable alerts in an interactive on-chart table.
- Workflow Integration: Designed to eliminate manual chart-by-chart switching by centralizing pattern detection, trend filtering, risk-to-reward level calculation, and one-click chart navigation inside a single terminal window.
- Operational Scope: Functions strictly as a visual technical analysis and alert indicator; it does not execute, modify, or close live or pending broker orders automatically.
Operating Principle and Signal Logic
- Closed-Bar Signal Integrity: All candlestick formations and technical filter conditions are evaluated exclusively on completed, closed candlesticks starting from Bar 1 (the most recently closed candle) backward within the configured lookback window. Confirmed signals do not repaint or shift retroactively once a candle has closed. When the optional Fibonacci Retracement filter is enabled, swing-high and swing-low reference anchors are derived from a historical ZigZag swing scan over prior closed bars.
- Pattern Mode 1 (5-Candle Momentum Exhaustion): Identifies directional exhaustion sequences where sustained single-sided candle pressure transitions into a decisive counter-trend reversal close, highlighting potential momentum shifts after extended directional runs.
- Pattern Mode 2 (6-Candle Sweep and Reversal): Detects extended multi-candle directional pressure followed by a strong rejection and breakout candle that sweeps beyond the preceding multi-bar range extreme, capturing liquidity rejections and structural reversals.
- Pattern Mode 3 (Multi-Candle Pullback Continuation): Evaluates 4-candle, 5-candle, and 6-candle trend-continuation structures consisting of an initial directional impulse leg, a controlled counter-trend retracement candle, and a confirming resumption candle in the prevailing direction, with optional candle-body proportion filters.
- Combined Scanning Modes and Pattern Priority: Traders can isolate individual pattern families, run a dual 5-Candle and 6-Candle scanner mode, or activate all pattern structures simultaneously. When multiple patterns qualify on the same closed candle, the engine assigns priority tags (such as 5+6 C, 5-Candle, 6-Candle, 6C-Pull, 5C-Pull, or 4C-Pull) so the most comprehensive structure is displayed.
- BUY Signal Conditions: Generated when a bullish reversal or bullish continuation multi-candle pattern completes at candle close, directional filtering permits bullish setups, and every enabled indicator filter in the 15-filter confluence suite confirms bullish alignment on that symbol and timeframe.
- SELL Signal Conditions: Generated when a bearish reversal or bearish continuation multi-candle pattern completes at candle close, directional filtering permits bearish setups, and every enabled indicator filter in the 15-filter confluence suite confirms bearish alignment on that symbol and timeframe.
- Lookback Resolution and Signal Aging: For each symbol-timeframe slot, the scanner searches backward from Bar 1 up to InpLookback closed bars and displays the single most recent valid setup, updating automatically whenever a newer valid formation closes or an older setup ages past the lookback limit.
- ATR Volatility Level Projection: Anchors the Entry reference price at the signal candle close, derives Stop Loss distance from the signal-bar Average True Range (ATR) multiplied by InpATRMultSL (with automatic candle-range fallback if broker ATR history is temporarily unavailable), and projects TP1 and TP2 at user-defined Risk-to-Reward (RR) multiples.
Key Technical Features
- Multi-Symbol and Multi-Timeframe Matrix: Scans custom comma-separated symbol lists or automatically imports active symbols from the MT4 Market Watch window across up to nine standard timeframes (M1, M5, M15, M30, H1, H4, D1, W1, MN1), including automatic prefix/suffix symbol resolution.
- Draggable and Scalable Dashboard GUI: Renders a responsive on-chart control panel that can be dragged smoothly with the mouse, collapsed into a compact single-line status bar, cleared on demand, and scaled from 70% to 180% for laptops, widescreen monitors, and high-DPI displays.
- Persistent UI State Across Timeframe Changes: Remembers dashboard screen coordinates and minimized/maximized state across chart symbol or timeframe switches via terminal global variables.
- Dynamic Column Sorting: Supports one-click ascending or descending sorting directly from table headers by Pair Name, Timeframe duration, Signal Direction, or Signal Timestamp.
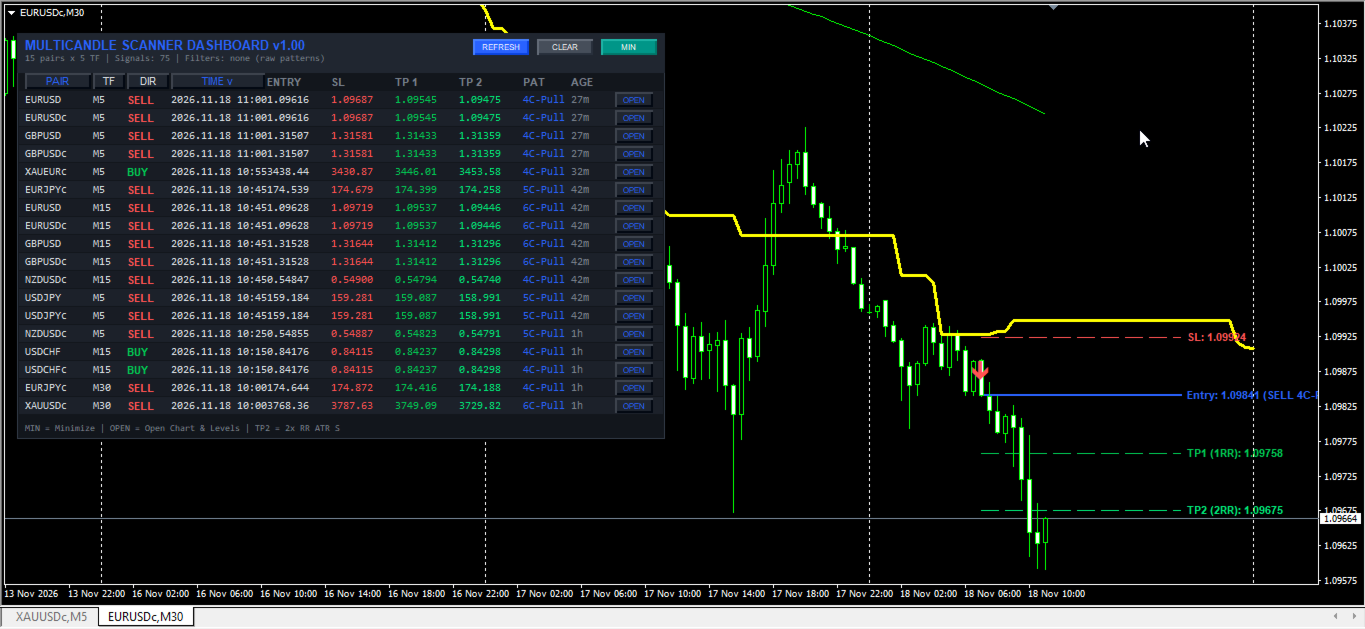
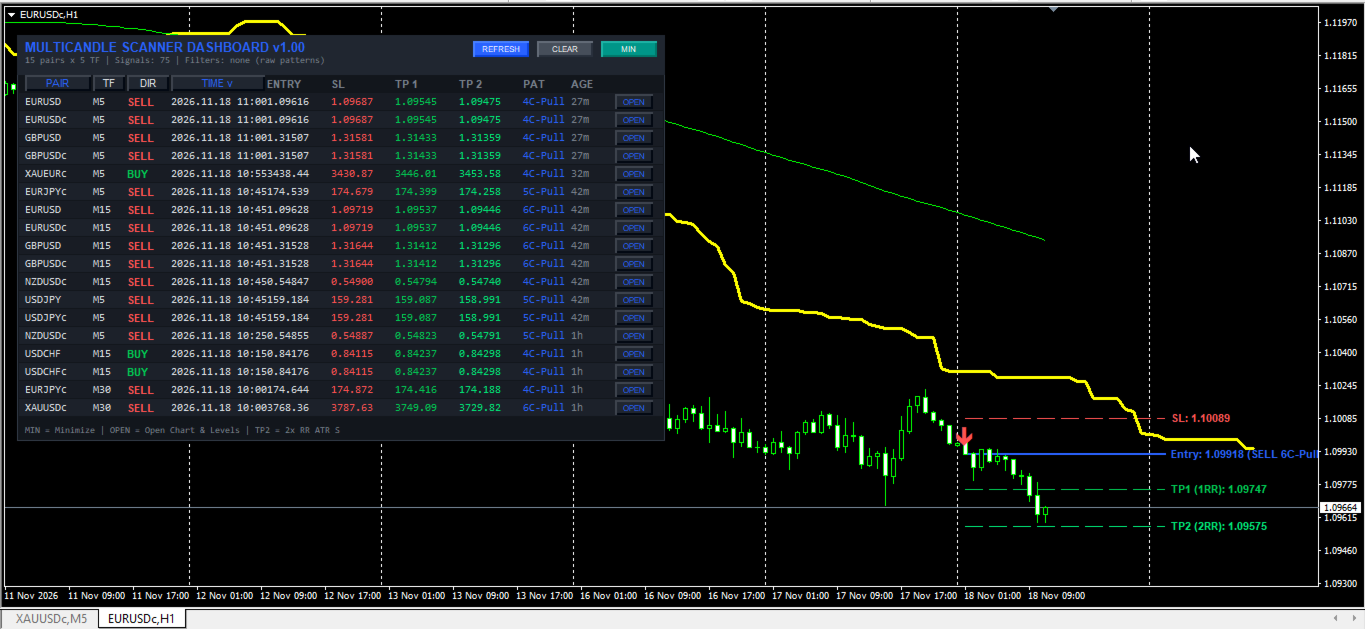
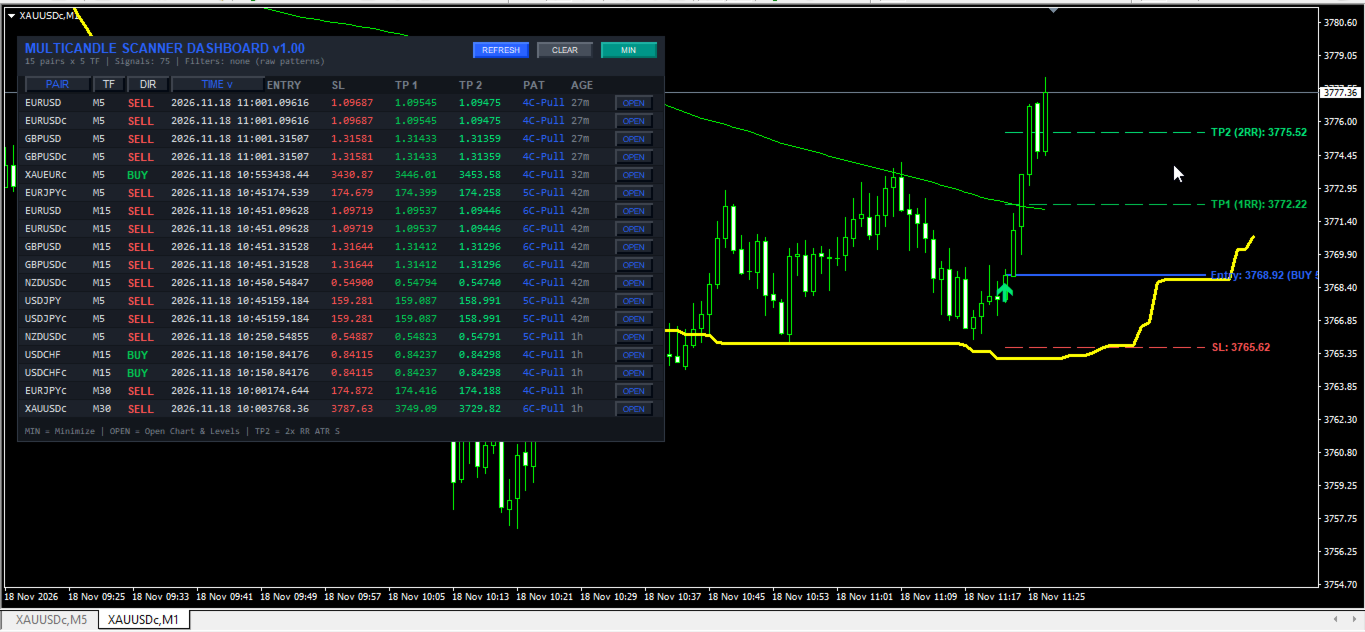
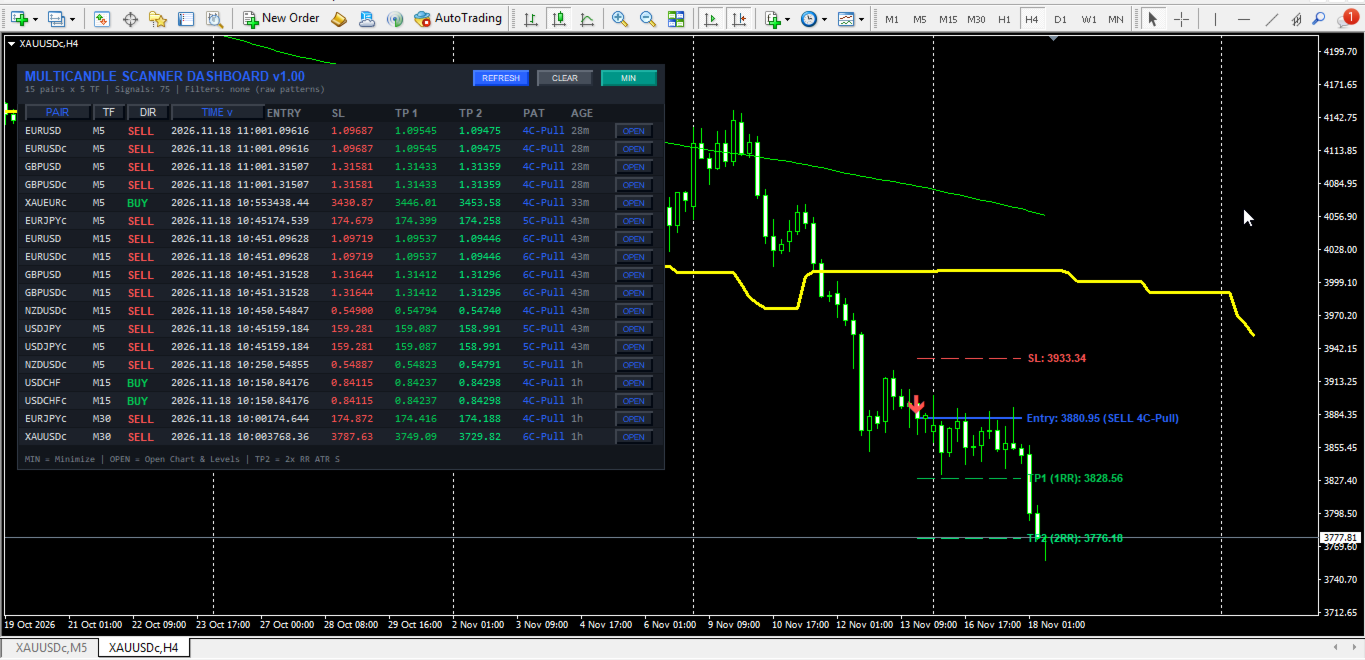
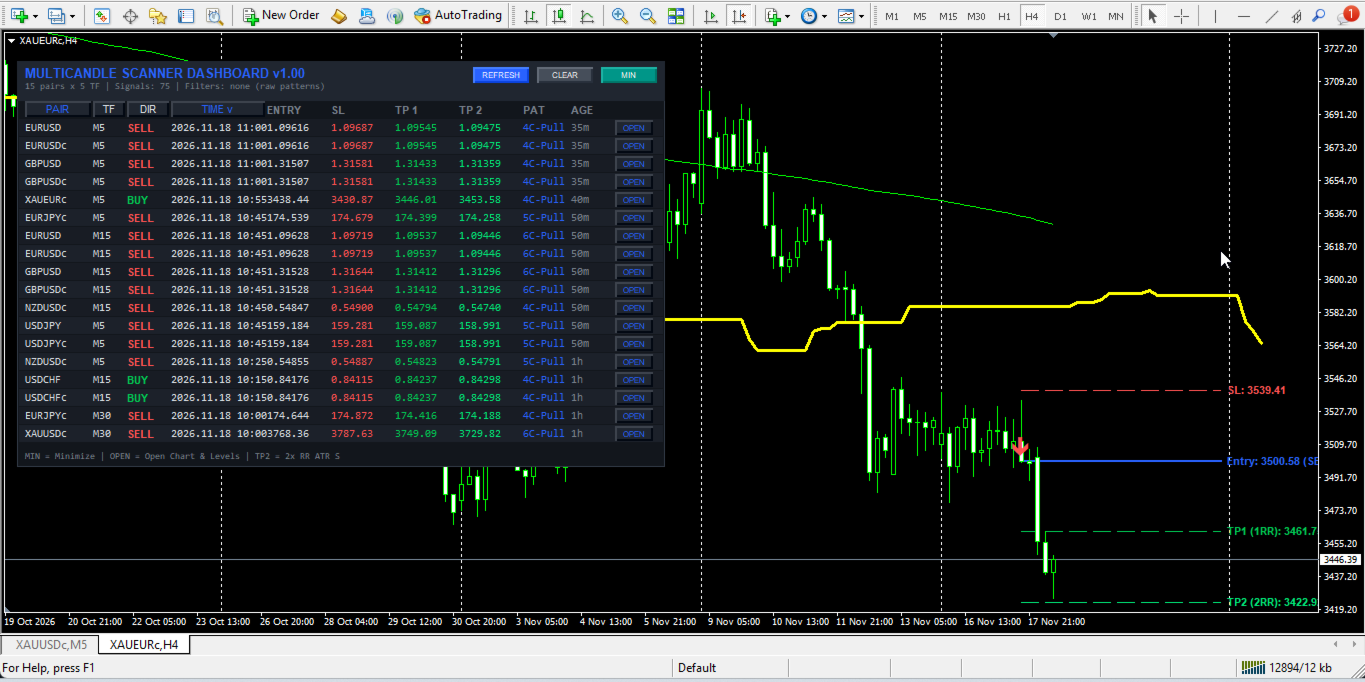
- One-Click Chart Switcher and Level Plotter: Clicking OPEN on any valid signal row switches the active chart to that symbol and timeframe in candlestick mode and plots directional entry arrows alongside horizontal Entry, SL, TP1, and TP2 lines with formatted price labels.
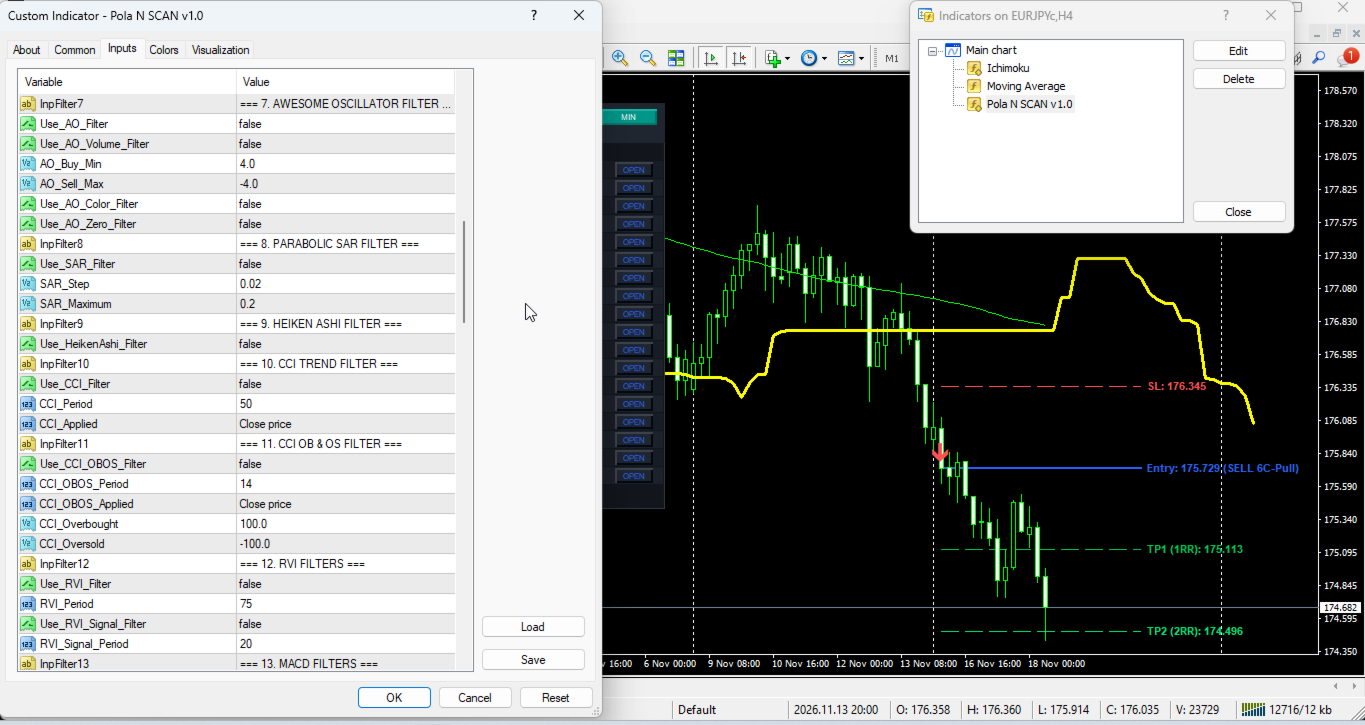
- Modular 15-Filter Confluence Suite: Integrates 15 independent, toggleable indicator filters operating in strict logical conjunction (all active filters must agree) covering RSI Cross, ADX Trend Strength, Single Moving Average, Ichimoku Senkou Span B, Long-Period RSI Trend, Double Moving Average Crossover, Awesome Oscillator, Parabolic SAR, Heiken Ashi Candle Polarity, CCI Trend, CCI Overbought/Oversold, RVI Trend and Signal, MACD Histogram and Zero Line, Support/Resistance Proximity and Fibonacci Retracement Zones, and ATR-based Supertrend.
- Multi-Channel Alert Engine: Dispatches MT4 desktop pop-up alerts, custom WAV audio alerts, mobile push notifications via MetaQuotes ID, and SMTP email alerts containing full Entry, SL, TP1, TP2, and pattern details, with optional duplicate suppression.
Dashboard GUI Elements, Performance, and Setup Recommendations
- Header Bar and Interactive Buttons: The upper header displays the dashboard title, real-time scan summary (total pairs, timeframes, active signals found, enabled filter tags, and last scan time), and three control buttons: REFRESH forces an immediate reload of symbols, timeframes, and market scan; CLEAR removes dashboard objects from the chart; MIN/MAX toggles between the full multi-row table and compact single-line bar.
- Table Columns and Tooltips: PAIR shows the instrument symbol; TF shows the scanned timeframe; DIR displays BUY, SELL, or WAIT; TIME displays the server timestamp of the signal candle; ENTRY, SL, TP 1, and TP 2 display normalized price levels; PAT identifies the matched formation (5-Candle, 6-Candle, 5+6 C, 4C-Pull, 5C-Pull, or 6C-Pull); AGE shows elapsed time since signal close in seconds (s), minutes (m), hours (h), or days (d); OPEN switches the active chart to that pair and timeframe. Hovering the mouse over any signal row reveals a detailed tooltip with full price and pattern data.
- Sorting Markers and Color Legend: Active sort columns display a directional indicator (v for descending, ^ for ascending) next to the header text. Green shades indicate bullish BUY signals, upward arrows, and TP1/TP2 target levels; Red shades indicate bearish SELL signals, downward arrows, and Stop Loss levels; Blue highlights header titles, active sort columns, Entry reference lines, and pattern tags; Grey tones indicate neutral status text, elapsed signal age, and inactive WAIT rows.
- Terminal CPU and Memory Efficiency: Market scans execute on a configurable timer interval (minimum 3 seconds via InpScanSec) rather than every incoming price tick, using cached filter instances and capped historical bar depth (InpBarsCopy and InpLookback) to maintain stable CPU and RAM utilization. On lower-specification computers or virtual terminals, keep InpMaxSymbols between 10 and 20, restrict InpTimeframes to 3-5 core timeframes, keep InpBarsCopy at 150 or lower, and run a single scanner instance per terminal. Ensure historical chart data is synchronized for all scanned symbols so background scans populate without delay.
- Recommended Instruments and Timeframes: Tested on major and cross Forex pairs (EURUSD, GBPUSD, USDJPY, AUDUSD, USDCAD, USDCHF, NZDUSD, EURJPY, GBPJPY) and gold (XAUUSD), and compatible with any liquid MT4 instrument with clean candlestick history. Supports all timeframes from M1 to MN1: M5, M15, and M30 suit intraday pattern cycles, while H1 and H4 provide broader structural context with lower sensitivity to broker spread fluctuations.
- Account and Notification Setup: Compatible with 4-digit and 5-digit quotes, broker symbol prefixes or suffixes, and standard or ECN accounts. Configure your MetaQuotes ID or SMTP server credentials under MT4 Tools -> Options -> Notifications / Email before enabling push or email alerts.
Input Parameters Documentation
1. Entry Method and Pattern Logic
- InpEntryMethod (Default: ENTRY_ALL_5_6) -> Pattern detection mode: 0 = 5 & 6 Candle (Both), 1 = 5-Candle Exhaustion, 2 = 6-Candle Sweep, 3 = Multi-Candle Pullback (4/5/6 Candle), 4 = All Combined (enum).
- UseFilterPull1 (Default: true) -> Requires pullback candle body smaller than prior impulse body in Pullback mode (boolean).
- UseFilterPull2 (Default: true) -> Requires final confirmation candle body larger than pullback body in Pullback mode (boolean).
2. Scanner and System Settings
- InpSymbols (Default: "EURUSD,GBPUSD,USDJPY,AUDUSD,USDCAD,USDCHF,NZDUSD,EURJPY,GBPJPY,XAUUSD") -> Comma-separated symbols scanned when InpUseWatch is false (string).
- InpTimeframes (Default: "M5,M15,M30,H1,H4") -> Comma-separated timeframes scanned from M1, M5, M15, M30, H1, H4, D1, W1, MN1 (string).
- InpUseWatch (Default: true) -> Automatically imports visible Market Watch symbols up to InpMaxSymbols when true; uses InpSymbols when false (boolean).
- InpMaxSymbols (Default: 15) -> Maximum number of symbols loaded into the scanner matrix (count).
- InpScanSec (Default: 5) -> Timer interval between automatic scan cycles in seconds, minimum 3s (seconds).
- InpBarsCopy (Default: 150) -> Historical bars retrieved per symbol and timeframe for pattern and indicator calculations (bars).
- InpLookback (Default: 100) -> Maximum closed bars searched backward from Bar 1 to locate the latest valid signal (bars).
- InpDirection (Default: 0) -> Directional signal filter: 0 = Both BUY and SELL, 1 = BUY only, 2 = SELL only (integer).
3. ATR Stop Loss and Take Profit Settings
- InpATRPeriod (Default: 14) -> Lookback period in bars for Average True Range calculation on the signal timeframe (bars).
- InpATRMultSL (Default: 1.5) -> Multiplier applied to signal-bar ATR value for Stop Loss distance from Entry (ATR multiple).
- InpTP1_RR (Default: 1.0) -> Risk-to-Reward multiplier applied to SL distance for Take Profit 1 (ratio, 1.0 = 1:1 RR).
- InpTP2_RR (Default: 2.0) -> Risk-to-Reward multiplier applied to SL distance for Take Profit 2 (ratio, 1.0 = 1:2 RR).
4. Alerts and Notifications
- InpAlertPopup (Default: false) -> Enables native MT4 desktop pop-up alerts on valid signals (boolean).
- InpAlertSound (Default: false) -> Enables WAV sound playback upon valid signal detection (boolean).
- InpSoundFile (Default: "alert.wav") -> WAV filename located in the MT4 Sounds directory (string).
- InpAlertPush (Default: false) -> Enables mobile push alerts sent to the MetaTrader app via MetaQuotes ID (boolean).
- InpAlertEmail (Default: false) -> Enables email alerts sent via MT4 terminal SMTP configuration (boolean).
- InpEmailSubject (Default: "MultiCandle Scanner Signal") -> Subject line prefix for outgoing alert emails (string).
- InpAlertOnlyNew (Default: false) -> Restricts alerts to signals whose timestamp is newer than the last alerted timestamp on that slot (boolean).
5. Dashboard Display, Layout, and Sizing
- InpX (Default: 12) -> Initial horizontal distance in pixels from upper-left chart corner (pixels).
- InpY (Default: 28) -> Initial vertical distance in pixels from upper-left chart corner (pixels).
- InpScale (Default: 100) -> Overall UI scaling percentage for panel size, padding, and fonts from 70 to 180 (percent).
- InpRowH (Default: 18) -> Base height of each table row in pixels before UI scaling (pixels).
- InpFont (Default: 8) -> Base font size in points for table text before UI scaling (points).
- InpPadX (Default: 8) -> Base left and right horizontal inner padding of dashboard panel (pixels).
- InpWPair (Default: 68) -> Base width of PAIR symbol column (pixels).
- InpWTF (Default: 34) -> Base width of TF timeframe column (pixels).
- InpWDir (Default: 44) -> Base width of DIR direction column (pixels).
- InpWTime (Default: 96) -> Base width of TIME timestamp column (pixels).
- InpWEntry (Default: 64) -> Base width of ENTRY price column (pixels).
- InpWSL (Default: 64) -> Base width of SL Stop Loss column (pixels).
- InpWTP1 (Default: 64) -> Base width of TP 1 Take Profit column (pixels).
- InpWTP2 (Default: 64) -> Base width of TP 2 Take Profit column (pixels).
- InpWPatt (Default: 48) -> Base width of PAT pattern name column (pixels).
- InpWAge (Default: 42) -> Base width of AGE elapsed time column (pixels).
- InpWOpen (Default: 44) -> Base width of OPEN chart-switch button column (pixels).
- InpShowEmpty (Default: false) -> Displays scanned rows with WAIT status when no active signal exists if true; hides them if false (boolean).
- InpMaxRows (Default: 18) -> Maximum visible signal rows rendered in dashboard table (rows).
6. Sorting Settings
- InpSortBy (Default: SORT_TIME) -> Default sort column: 0 = Latest signal time, 1 = Pair name, 2 = Timeframe, 3 = Direction (enum).
- InpSortNewest (Default: true) -> Sets default sort direction to descending/newest first when true, or ascending when false (boolean).
7. Active Chart Visualization
- InpDrawOnChart (Default: true) -> Draws signal arrows and Entry/SL/TP reference levels on active chart when true (boolean).
- InpShowArrow (Default: true) -> Toggles visibility of directional signal arrows on active chart (boolean).
- InpShowLevels (Default: true) -> Toggles visibility of horizontal Entry, SL, TP1, and TP2 lines and labels on active chart (boolean).
- InpExtendBars (Default: 25) -> Bars to the right of signal candle that horizontal level lines extend (bars).
- InpArrowCodeBuy (Default: 233) -> Wingdings symbol code for bullish BUY signal arrows (code).
- InpArrowCodeSell (Default: 234) -> Wingdings symbol code for bearish SELL signal arrows (code).
- InpArrowSize (Default: 2) -> Width/thickness size of plotted signal arrows from 1 to 5 (size).
- InpArrowDistance (Default: 15) -> Vertical gap between signal candle price and drawn arrow in points (points).
8. Color Palette Settings
- InpColBg (Default: C'18,22,28') -> Main dashboard background color (RGB).
- InpColHead (Default: C'32,38,48') -> Header and column title bar background color (RGB).
- InpColRow (Default: C'24,28,36') -> Even-numbered table row background color (RGB).
- InpColRow2 (Default: C'28,33,42') -> Alternating odd-numbered table row background color (RGB).
- InpColText (Default: C'220,225,230') -> Primary text color for symbol, timeframe, timestamp, and entry fields (RGB).
- InpColBull (Default: C'0,200,83') -> Text color indicating bullish BUY labels in table (RGB).
- InpColBear (Default: C'255,82,82') -> Text color indicating bearish SELL labels in table (RGB).
- InpColMute (Default: C'120,128,140') -> Muted color for status text, elapsed age, hints, and WAIT rows (RGB).
- InpColAccent (Default: C'41,98,255') -> Accent color for title, active sort headers, pattern tags, and OPEN buttons (RGB).
- InpColArrowBuy (Default: C'0,230,118') -> Color of bullish BUY arrows on active chart (RGB).
- InpColArrowSell (Default: C'255,82,82') -> Color of bearish SELL arrows on active chart (RGB).
- InpColEntry (Default: C'41,98,255') -> Color of Entry reference line and label on active chart (RGB).
- InpColSL (Default: C'255,82,82') -> Color of Stop Loss line and text in table and chart (RGB).
- InpColTP1 (Default: C'0,200,83') -> Color of Take Profit 1 line and text in table and chart (RGB).
- InpColTP2 (Default: C'0,230,118') -> Color of Take Profit 2 line and text in table and chart (RGB).
9. Filter 1: RSI Cross Filter
- Use_RSI_Cross_Filter (Default: false) -> Enables RSI threshold crossover confirmation on closed signal bar (boolean).
- RSI_Length (Default: 14) -> Averaging period in bars for RSI Cross calculation (bars).
- RSI_Price_Source (Default: PRICE_CLOSE) -> Applied price type for RSI calculations (enum).
- RSI_Oversold (Default: 30.0) -> Lower RSI oversold level crossed upward for BUY on 0-100 scale (level).
- RSI_Overbought (Default: 70.0) -> Upper RSI overbought level crossed downward for SELL on 0-100 scale (level).
10. Filter 2: ADX Trend Filter
- Use_ADX_Filter (Default: false) -> Enables ADX minimum trend-strength filtering (boolean).
- ADX_Period (Default: 10) -> Calculation period in bars for ADX main line (bars).
- ADX_Min_Level (Default: 20.0) -> Minimum ADX main value required to validate a signal (level).
11. Filter 3: Single MA Filter
- Use_MA_Filter (Default: false) -> Enables Single Moving Average directional trend filter (boolean).
- MA_Period (Default: 50) -> Averaging period in bars for Single MA (bars).
- MA_Method (Default: MODE_SMA) -> Smoothing method: SMA, EMA, SMMA, or LWMA (enum).
- MA_Shift (Default: 0) -> Horizontal bar shift applied to Single MA (bars).
12. Filter 4: Ichimoku Senkou Span B Filter
- Use_Ichimoku_Filter (Default: false) -> Enables Ichimoku Kumo Senkou Span B baseline trend filter (boolean).
- Ichimoku_Tenkan (Default: 9) -> Tenkan-sen conversion line period in bars (bars).
- Ichimoku_Kijun (Default: 26) -> Kijun-sen base line period in bars (bars).
- Ichimoku_SenkouB (Default: 52) -> Senkou Span B leading span period in bars (bars).
13. Filter 5: Long-Period RSI 75 Filter
- Use_RSI75_Filter (Default: false) -> Enables long-period RSI 50-midline trend bias filter (boolean).
- RSI_Filter_Period (Default: 75) -> Calculation period in bars for RSI 75 trend filter (bars).
14. Filter 6: Double MA Filter
- Use_DoubleMA_Filter (Default: false) -> Enables dual Moving Average alignment requiring Fast MA A above Slow MA B for BUY and below for SELL (boolean).
- MA_A_Period (Default: 30) -> Averaging period in bars for Fast MA A (bars).
- MA_A_Method (Default: MODE_EMA) -> Smoothing method for Fast MA A (enum).
- MA_A_Applied (Default: PRICE_CLOSE) -> Applied price type for Fast MA A (enum).
- MA_A_Shift (Default: 0) -> Horizontal bar shift for Fast MA A (bars).
- MA_B_Period (Default: 140) -> Averaging period in bars for Slow MA B (bars).
- MA_B_Method (Default: MODE_EMA) -> Smoothing method for Slow MA B (enum).
- MA_B_Applied (Default: PRICE_CLOSE) -> Applied price type for Slow MA B (enum).
- MA_B_Shift (Default: 0) -> Horizontal bar shift for Slow MA B (bars).
15. Filter 7: Awesome Oscillator Filter
- Use_AO_Filter (Default: false) -> Enables Bill Williams Awesome Oscillator momentum filter (boolean).
- Use_AO_Volume_Filter (Default: false) -> Requires AO magnitude beyond AO_Buy_Min or AO_Sell_Max thresholds (boolean).
- AO_Buy_Min (Default: 4.0) -> Minimum positive AO value required for BUY signals (level).
- AO_Sell_Max (Default: -4.0) -> Maximum negative AO value allowed for SELL signals (level).
- Use_AO_Color_Filter (Default: false) -> Requires AO histogram bar slope rising for BUY or falling for SELL (boolean).
- Use_AO_Zero_Filter (Default: false) -> Requires AO slope alignment plus positive AO for BUY or negative AO for SELL (boolean).
16. Filter 8: Parabolic SAR Filter
- Use_SAR_Filter (Default: false) -> Enables Parabolic SAR dot trend alignment filter (boolean).
- SAR_Step (Default: 0.02) -> Acceleration step increment for Parabolic SAR (step).
- SAR_Maximum (Default: 0.2) -> Maximum acceleration limit for Parabolic SAR (limit).
17. Filter 9: Heiken Ashi Filter
- Use_HeikenAshi_Filter (Default: false) -> Enables smoothed Heiken Ashi candle direction confirmation (boolean).
18. Filter 10: CCI Trend Filter
- Use_CCI_Filter (Default: false) -> Enables CCI zero-line directional trend filter (boolean).
- CCI_Period (Default: 50) -> Calculation period in bars for CCI Trend (bars).
- CCI_Applied (Default: PRICE_CLOSE) -> Applied price type for CCI Trend (enum).
19. Filter 11: CCI OB and OS Filter
- Use_CCI_OBOS_Filter (Default: false) -> Enables CCI overbought/oversold threshold momentum filtering (boolean).
- CCI_OBOS_Period (Default: 14) -> Calculation period in bars for CCI OB/OS (bars).
- CCI_OBOS_Applied (Default: PRICE_CLOSE) -> Applied price type for CCI OB/OS (enum).
- CCI_Overbought (Default: 100.0) -> Upper CCI threshold level (level).
- CCI_Oversold (Default: -100.0) -> Lower CCI threshold level (level).
20. Filter 12: RVI Trend and Signal Filters
- Use_RVI_Filter (Default: false) -> Enables Relative Vigor Index zero-line bias filter (boolean).
- RVI_Period (Default: 75) -> Calculation period in bars for RVI main trend (bars).
- Use_RVI_Signal_Filter (Default: false) -> Enables RVI main-versus-signal line alignment filter (boolean).
- RVI_Signal_Period (Default: 20) -> Calculation period in bars for RVI Signal crossover (bars).
21. Filter 13: MACD Filters
- Use_MACD_Filter (Default: false) -> Enables MACD histogram polarity filter requiring MACD main above signal for BUY and below for SELL (boolean).
- MACD_FastEMA (Default: 12) -> Fast EMA period in bars for MACD (bars).
- MACD_SlowEMA (Default: 26) -> Slow EMA period in bars for MACD (bars).
- MACD_SignalSMA (Default: 9) -> Signal SMA period in bars for MACD (bars).
- MACD_Applied (Default: PRICE_CLOSE) -> Applied price type for MACD (enum).
- Use_MACD_Zero_Filter (Default: false) -> Enables MACD main-line zero-level bias filter (boolean).
22. Filter 14: Support/Resistance and Fibonacci Filters
- Use_SR_Filter (Default: false) -> Enables local Support and Resistance zone touch filtering around recent swing lows/highs (boolean).
- SR_Period (Default: 50) -> Lookback bars used to determine swing Support and Resistance extremes (bars).
- SR_Zone_Points (Default: 80) -> Proximity tolerance zone around Support/Resistance in chart points (points).
- Use_Fib_Filter (Default: false) -> Enables Fibonacci retracement pullback zone filtering derived from ZigZag swing anchors (boolean).
- Fib_Level_1 (Default: 0.382) -> First Fibonacci retracement ratio boundary (ratio).
- Fib_Level_2 (Default: 0.618) -> Second Fibonacci retracement ratio boundary (ratio).
- ZigZag_Depth (Default: 12) -> Minimum bar depth for ZigZag swing point detection (bars).
- ZigZag_Deviation (Default: 5) -> Minimum price deviation in points for ZigZag swing validation (points).
- ZigZag_Backstep (Default: 3) -> Minimum bar separation between consecutive ZigZag swing extremes (bars).
23. Filter 15: Supertrend Filter
- Use_Supertrend_Filter (Default: false) -> Enables ATR-based Supertrend directional trend filter (boolean).
- ST_AtrPeriod (Default: 10) -> Wilder ATR lookback period in bars for Supertrend calculation (bars).
- ST_Factor (Default: 3.0) -> ATR volatility multiplier applied to Supertrend upper and lower bands (ATR multiple).
Risk Disclaimer
- Financial Risk Warning: Trading foreign exchange, precious metals, indices, and leveraged financial derivatives carries a substantial risk of capital loss and may not be suitable for all investors.
- Analytical Purpose Only: Pola MultiCandle Scanner Dashboard is strictly a technical analysis and chart-monitoring utility designed to assist traders in evaluating price action structures; past pattern behavior or historical indicator readings are not indicative of future results, and this software provides no assurance of financial profit or loss prevention.
- Demo Testing Requirement: Always thoroughly test the indicator on a demo account to verify parameter behavior, filter combinations, and terminal CPU/memory performance under your specific broker conditions before applying its signals to live trading decisions.