Biggest Move H4 Analyzer
- Göstergeler
- Sürüm: 1.40
- Etkinleştirmeler: 20

Short Description
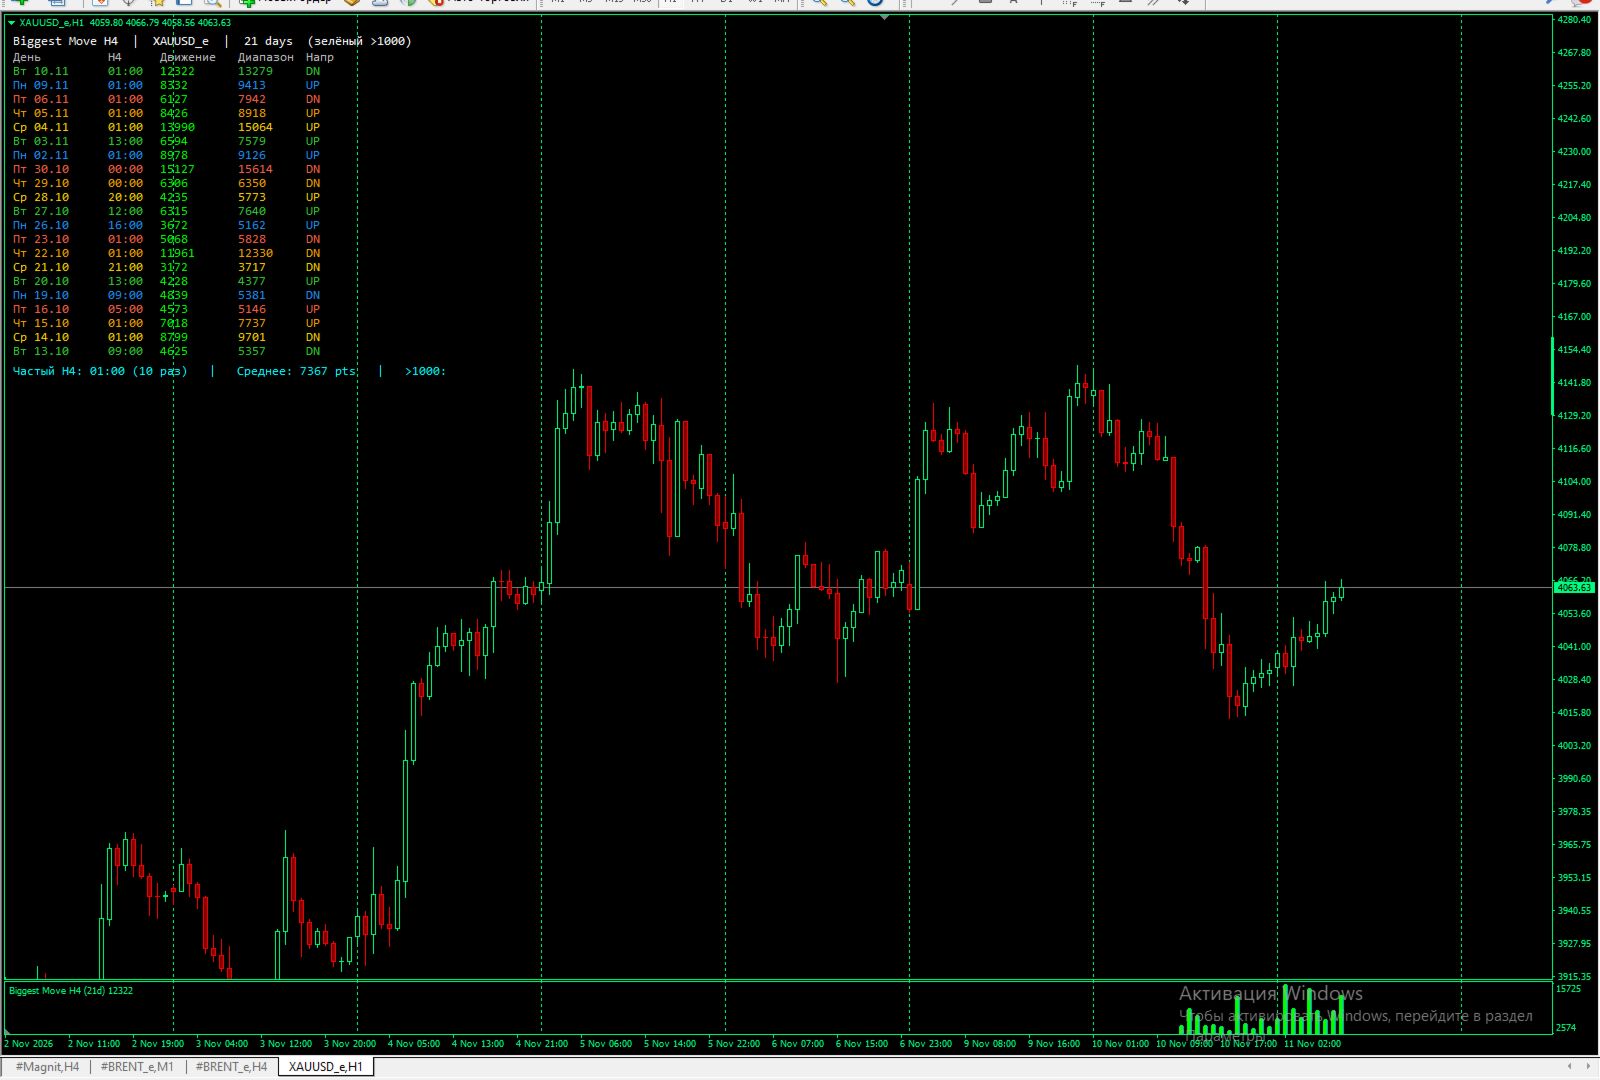
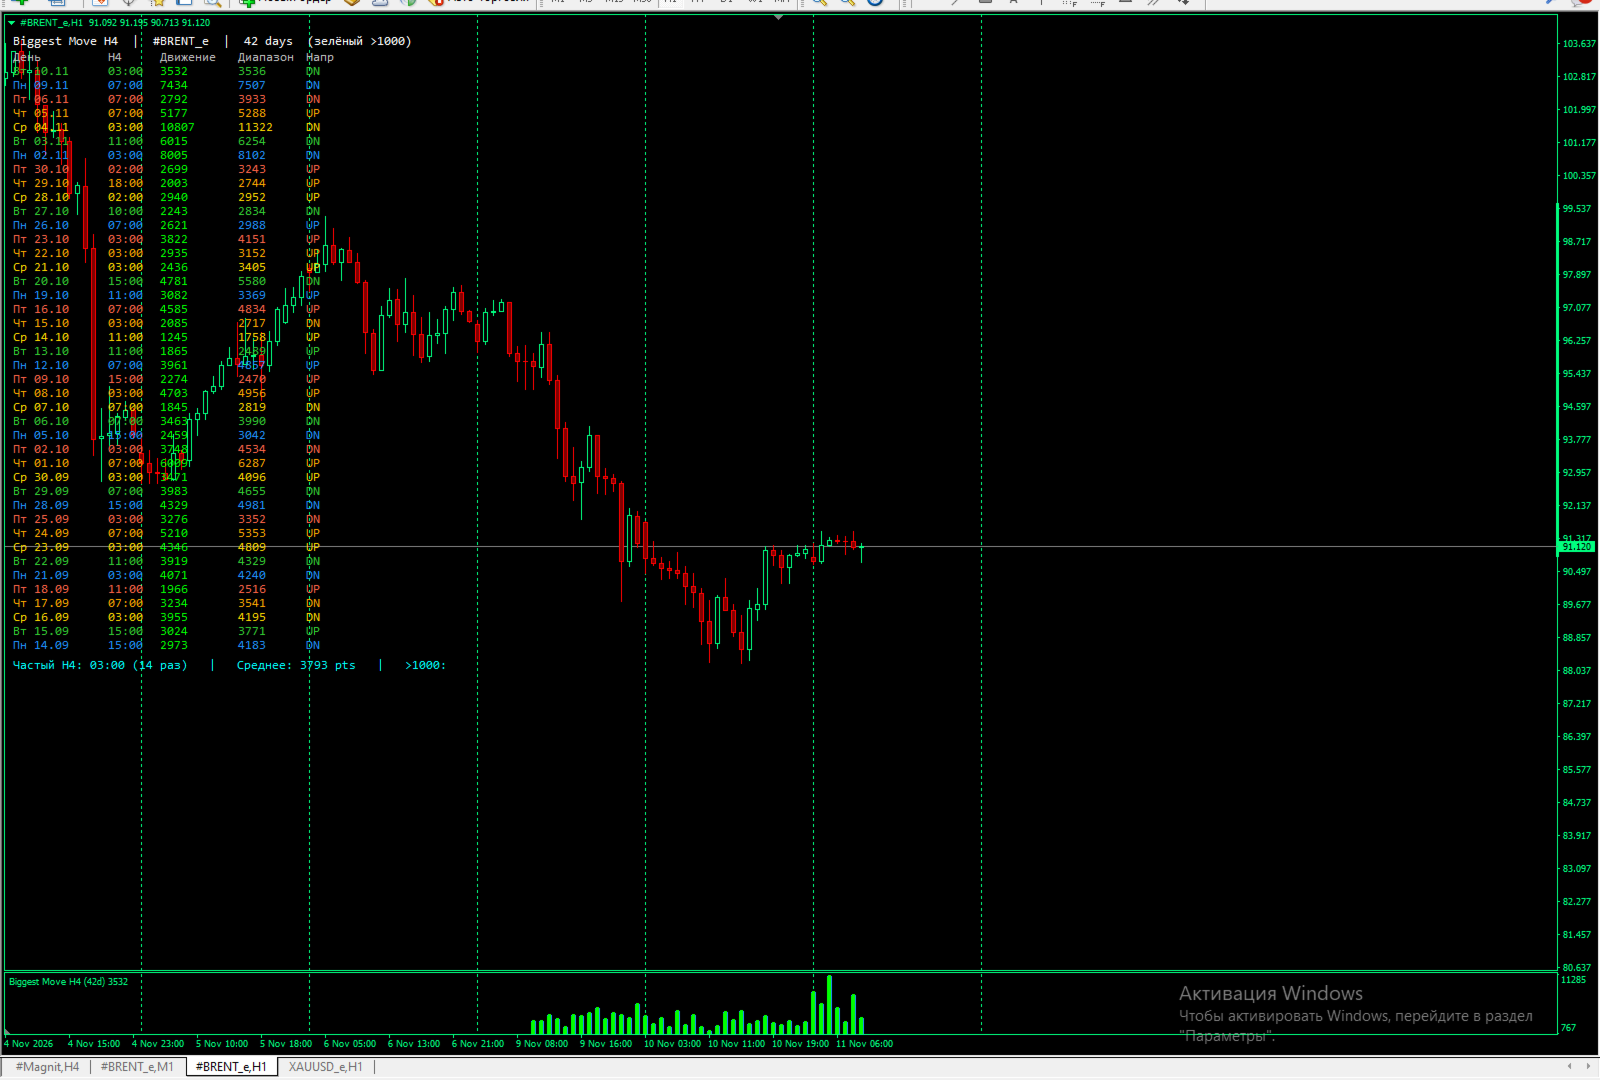
The indicator finds the H4 bar from which the strongest daily move most often begins. It displays a clear table with the hour, move size, and direction. Helps you trade only during the best hours of the day.
Full Description
Biggest Move H4 is a statistical indicator that answers an important question for traders:
“At what time does the strongest move of the day most often begin?”
The indicator analyzes the selected number of days (from 1 to 1000) and for each day finds the 4-hour bar from whose open the price traveled the maximum distance to the day’s extreme.
What the indicator shows:
- A table directly on the chart with data for each day
- Opening hour of the H4 bar (00:00, 04:00, 08:00, 12:00, 16:00, 20:00, etc.)
- Move size in points
- Full daily range
- Direction of the move (UP / DN)
- Color highlighting of strong days (customizable threshold)
- Summary statistics: most frequent hour, average move, number of strong days
Practical uses:
- Identify the best hours for market entries
- Place pending orders only during the most active H4 periods
- Filter trading by time of day
- Understand when an instrument usually produces strong impulses
- Use as a filter in Expert Advisors and manual strategies
The indicator is especially useful on oil, gold, indices, and volatile currency pairs.
Key Features
- Analysis based strictly on H4 bars of the current day (no previous-day bars included)
- Adjustable number of days for analysis (1–1000)
- Color highlighting of strong moves
- Table + histogram
- Option to show only weekdays (Mon–Fri)
- Fully customizable colors and fonts
- Works on any instrument and timeframe
Important Notes (What NOT to do)
- Do not use it as a standalone “buy/sell right now” signal
- Do not set rigid stop-loss or take-profit levels without considering current volatility
- Do not ignore that different brokers may have different server times and H4 bar alignments
Practical Usage Scenario
- Attach the indicator to an H1 or H4 chart.
- Look at the “Most Frequent H4” and the top 2–3 hours.
- In your EA or manually, allow position opening only during these hours.
- During other hours either do not trade or use a reduced lot size.
- Once a week (or when market conditions change), check whether the dominant hour has shifted.