Volume Spike Levels
- Göstergeler
- Sürüm: 1.24

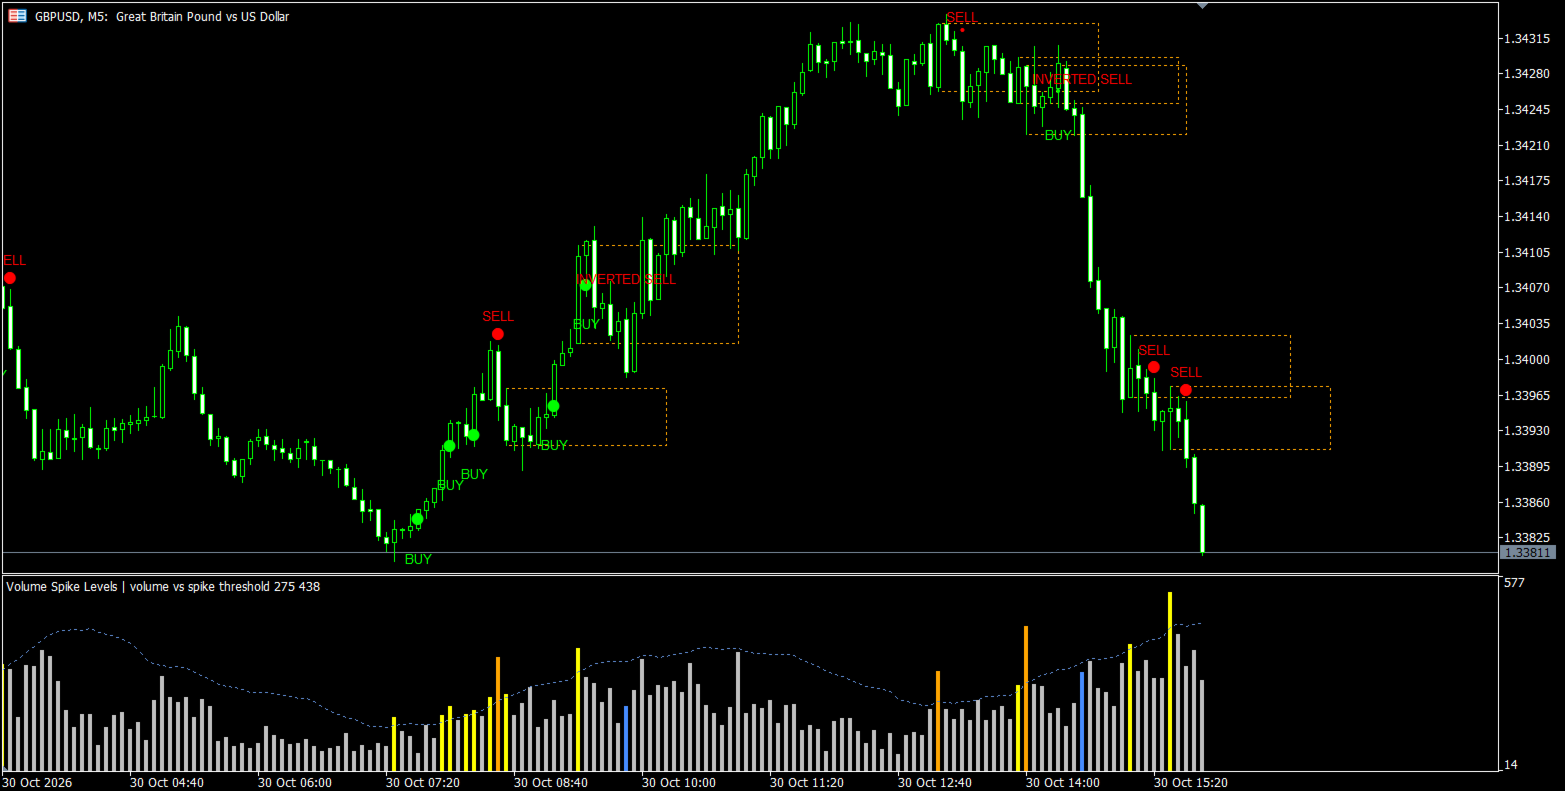
Volume Spike Levels identifies candles with unusually high volume relative to their recent average, preserves their High-Low ranges, and monitors subsequent price confirmation. It is designed for discretionary chart analysis on Forex, metals, indices, cryptocurrencies, and other instruments supported by MetaTrader 5.
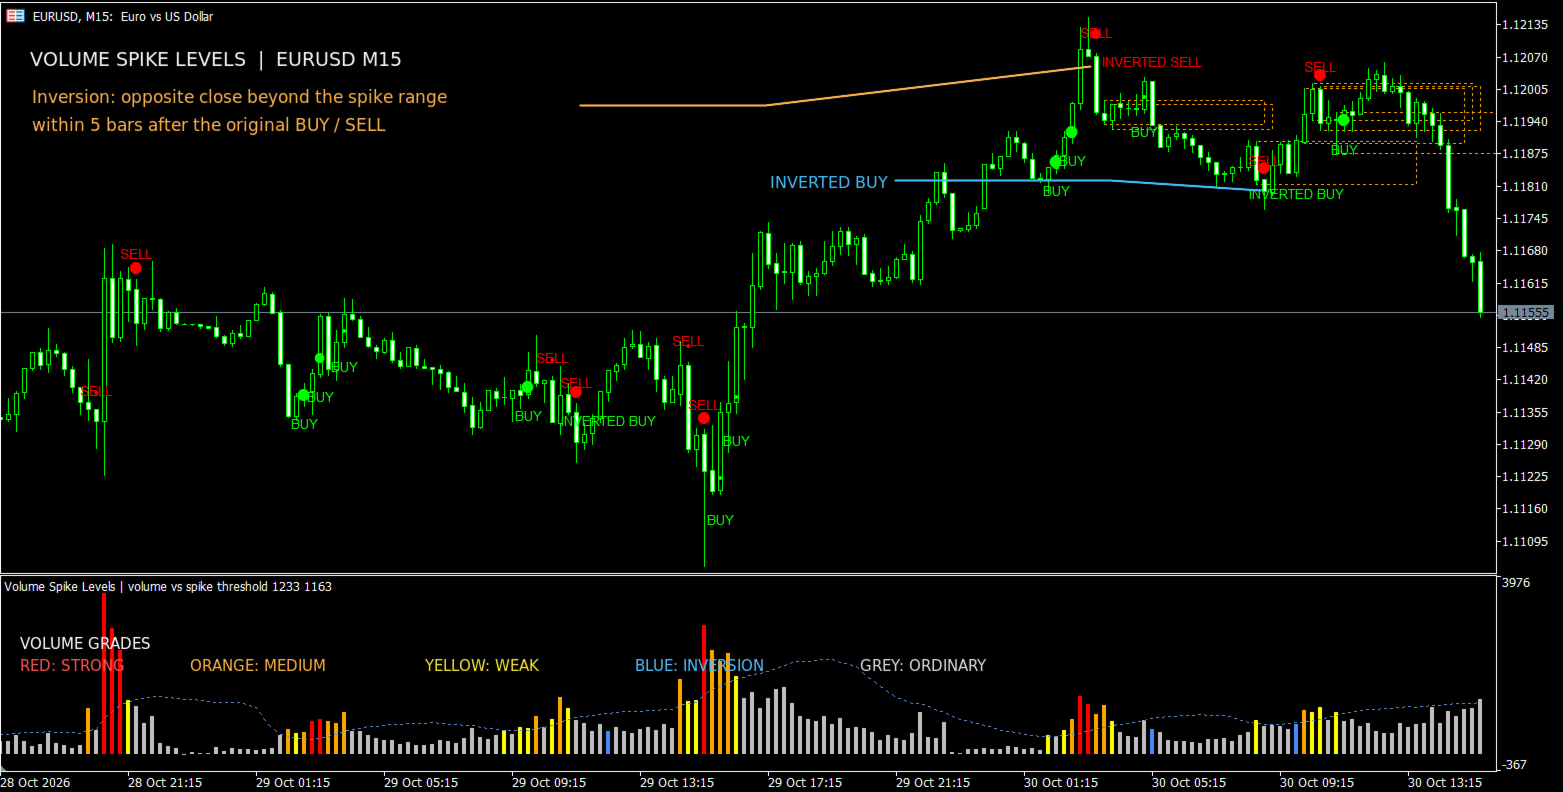
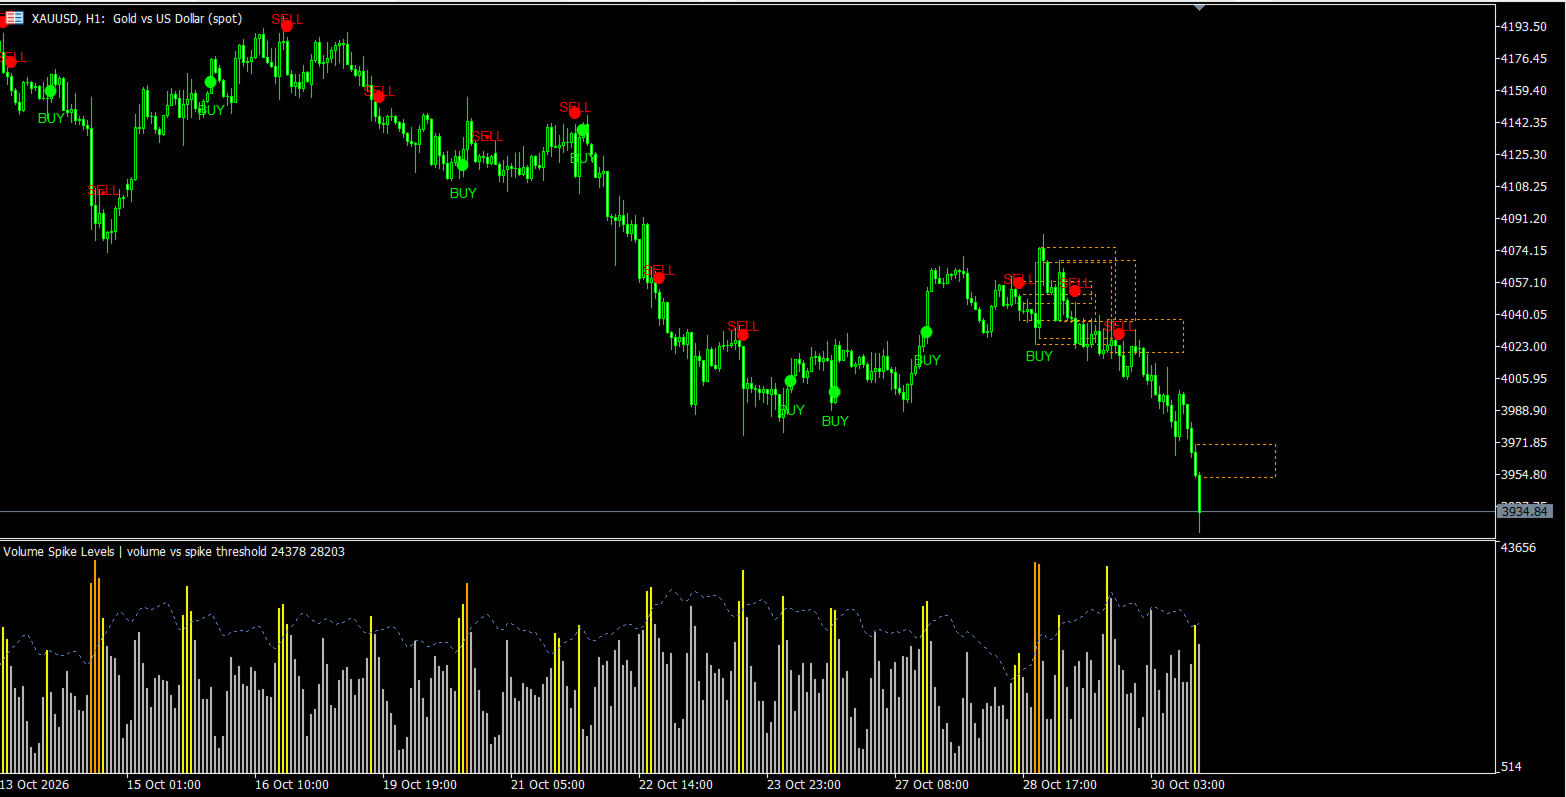
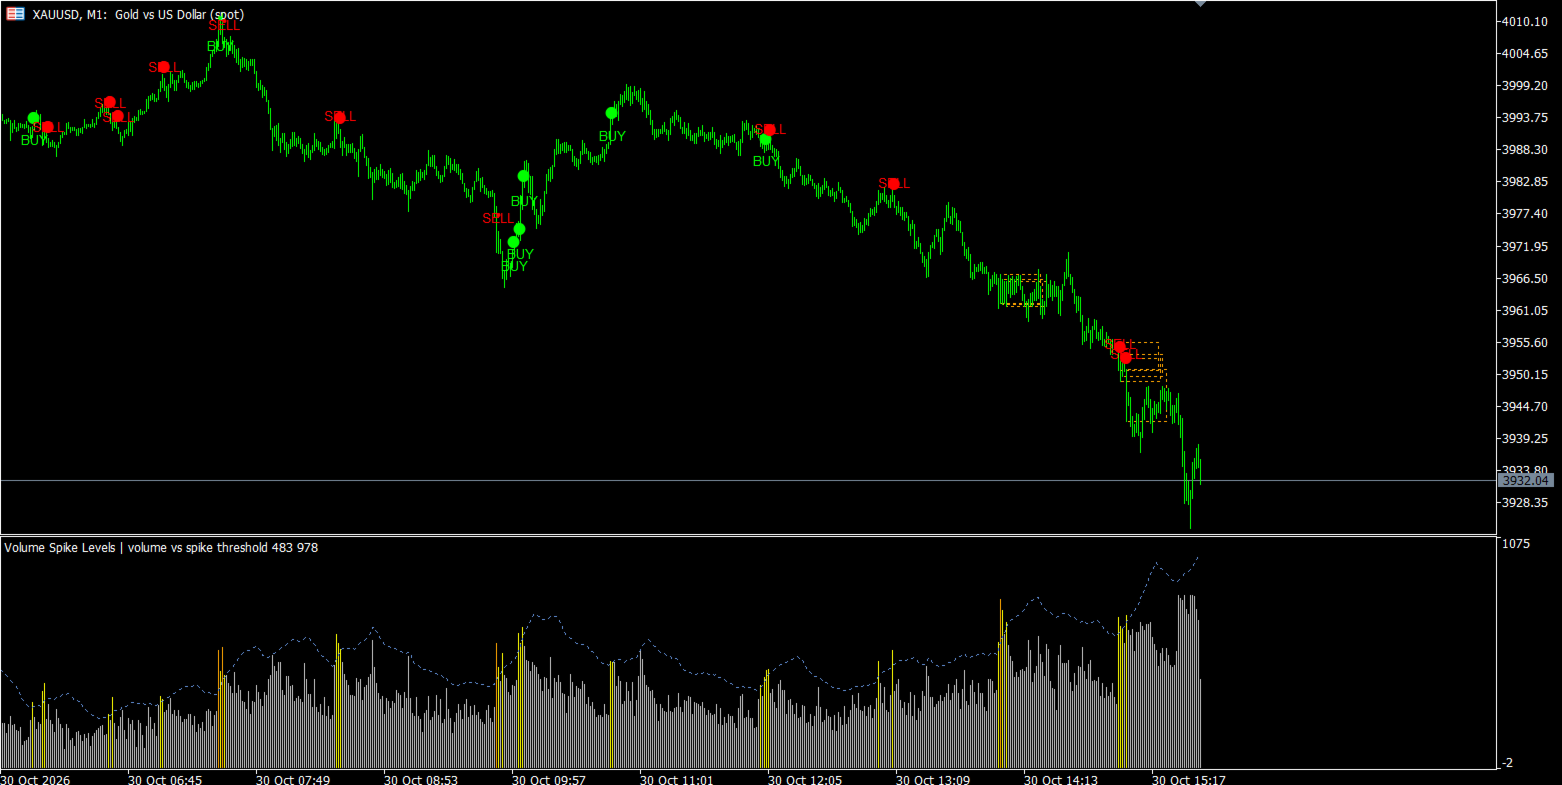
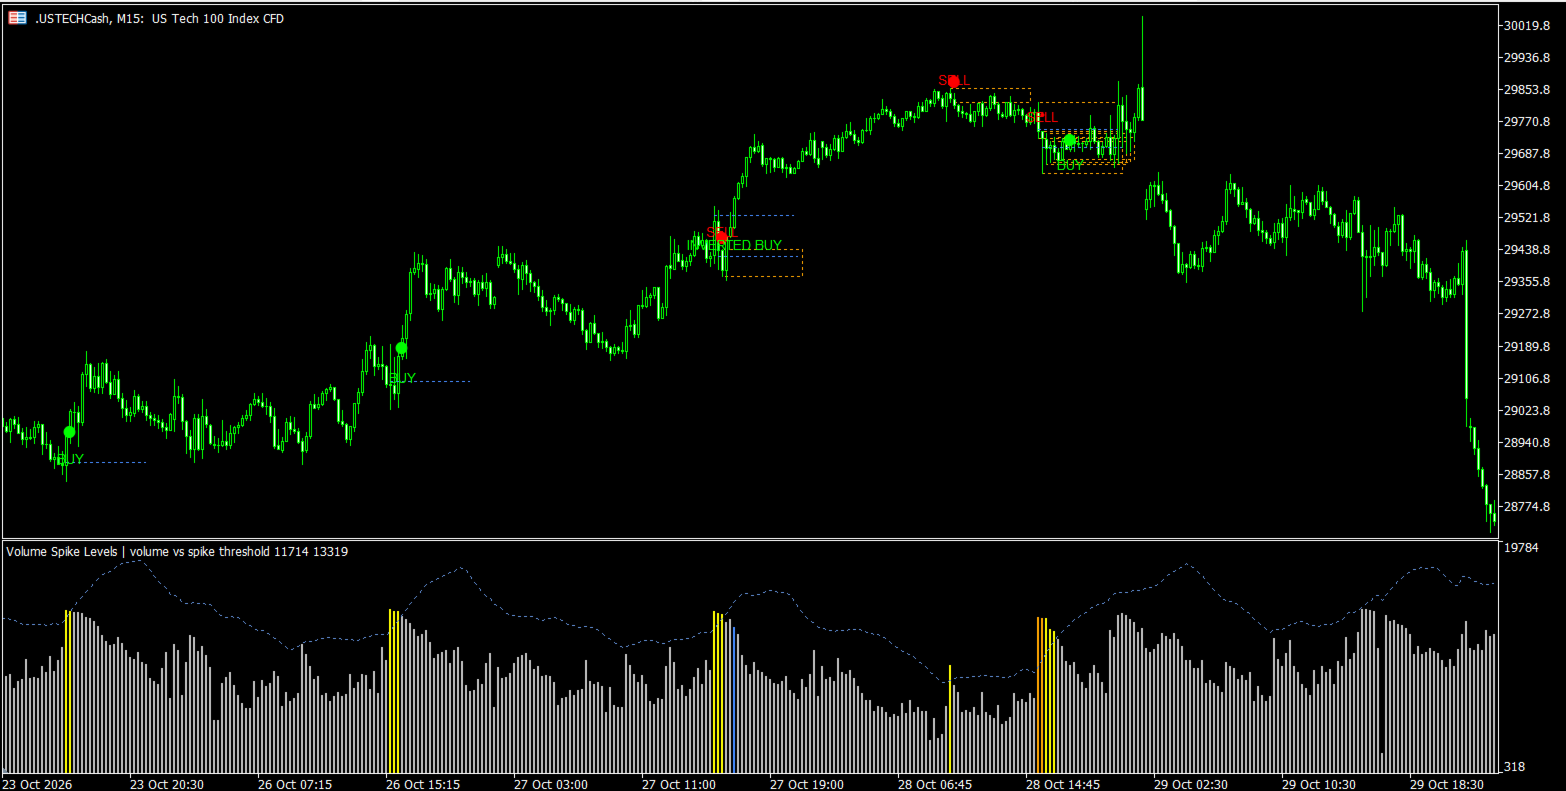
The indicator displays configurable range boxes or horizontal levels, BUY/SELL confirmations, and a separate price-inversion event when a previously confirmed volume range is overcome in the opposite direction. It does not open or manage trades.
HOW IT WORKS
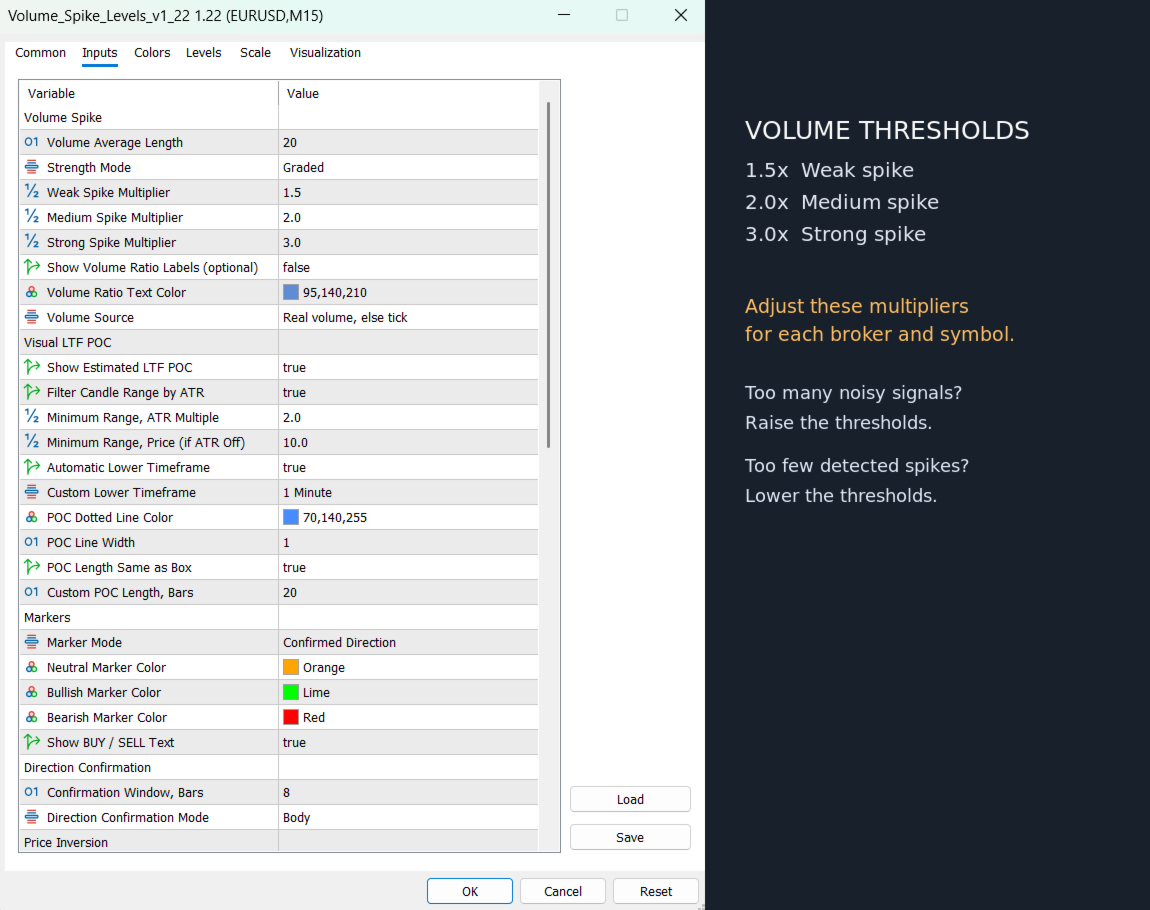
Volume Spike. The current bar's volume is compared with its moving average. Fixed and Graded modes are available. In Graded mode, the default thresholds are 1.5x (Weak), 2.0x (Medium), and 3.0x (Strong).
Range and Confirmation. Each qualifying closed spike candle defines a High-Low range. The indicator can draw a dotted box, horizontal High/Low lines, both, or neither. It monitors the selected high-concentration spike within a burst. A breakout above or below that range produces a confirmed BUY or SELL according to the selected Wick, Body, or Close confirmation mode.
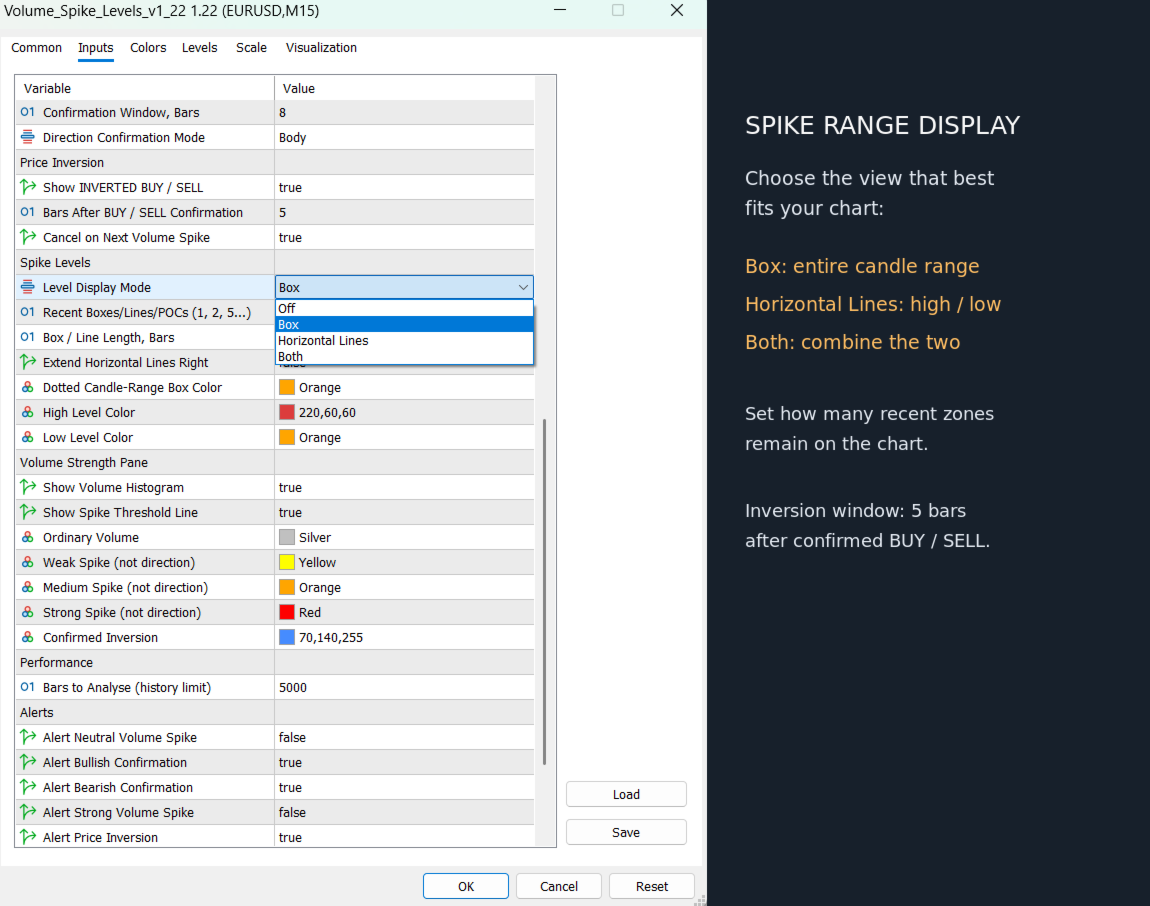
Price Inversion. After a confirmed SELL, a candle closing above the original spike High can produce INVERTED BUY. After a confirmed BUY, a candle closing below the original spike Low can produce INVERTED SELL. The inversion window defaults to five bars. A new qualifying volume spike cancels the current inversion watch when Cancel on Next Volume Spike is enabled. Only one inversion is emitted for a tracked confirmation.
Visual LTF POC. Qualifying spike ranges can display an estimated Point of Control calculated from lower-timeframe OHLCV data distributed across 24 price rows. POC is visual only and does not affect BUY/SELL signals. It requires suitable lower-timeframe history. Automatic LTF POC is unavailable on M1.
DISPLAY AND SETTINGS
Volume Strength Pane: A positive volume histogram independent of candle colour. Ordinary volume is grey; Weak, Medium, and Strong spikes have separate colours. The dotted reference line represents the volume moving average multiplied by the Weak Spike Multiplier. Confirmed inversion bars are highlighted separately.
Volume Spike: Volume Average Length, Fixed/Graded Strength Mode, Weak/Medium/Strong Multipliers, Tick/Real/Auto Volume Source, and optional relative-volume labels.
Spike Levels: Off / Box / Horizontal Lines / Both, number of recent zones to keep, box and line length, extension, and colours.
Confirmation and Inversion: Marker mode, confirmation window, Wick/Body/Close breakout rule, inversion window, and cancellation on a new spike.
POC: ATR-based or manual minimum candle range, automatic or selected lower timeframe, colour, width, and level length.
Alerts: Separate notifications for confirmed BUY, SELL, price inversion, neutral spike, and strong spike, with popup, push, email, and sound options.
IMPORTANT NOTES
On many Forex and CFD symbols, volume represents tick activity rather than actual exchange-traded contracts. Available volume history and resulting signals can differ by broker, instrument, and timeframe. Auto Volume Source uses real volume where available, otherwise tick volume.
Adjust the Weak/Medium/Strong Spike Multipliers first when adapting the indicator to a new broker or symbol. Lower thresholds increase signal frequency and may increase chart noise; higher thresholds are more selective. The default values are starting points, not universally optimized parameters.
The estimated LTF POC is not an exchange trade-by-price profile. The indicator is an analytical tool, not a trading system or financial advice. Historical signals do not guarantee future performance. Test settings with your own data and risk-management rules.