RSI Divergence Structure Confirmation
- Göstergeler
- Sürüm: 1.1
- Etkinleştirmeler: 10

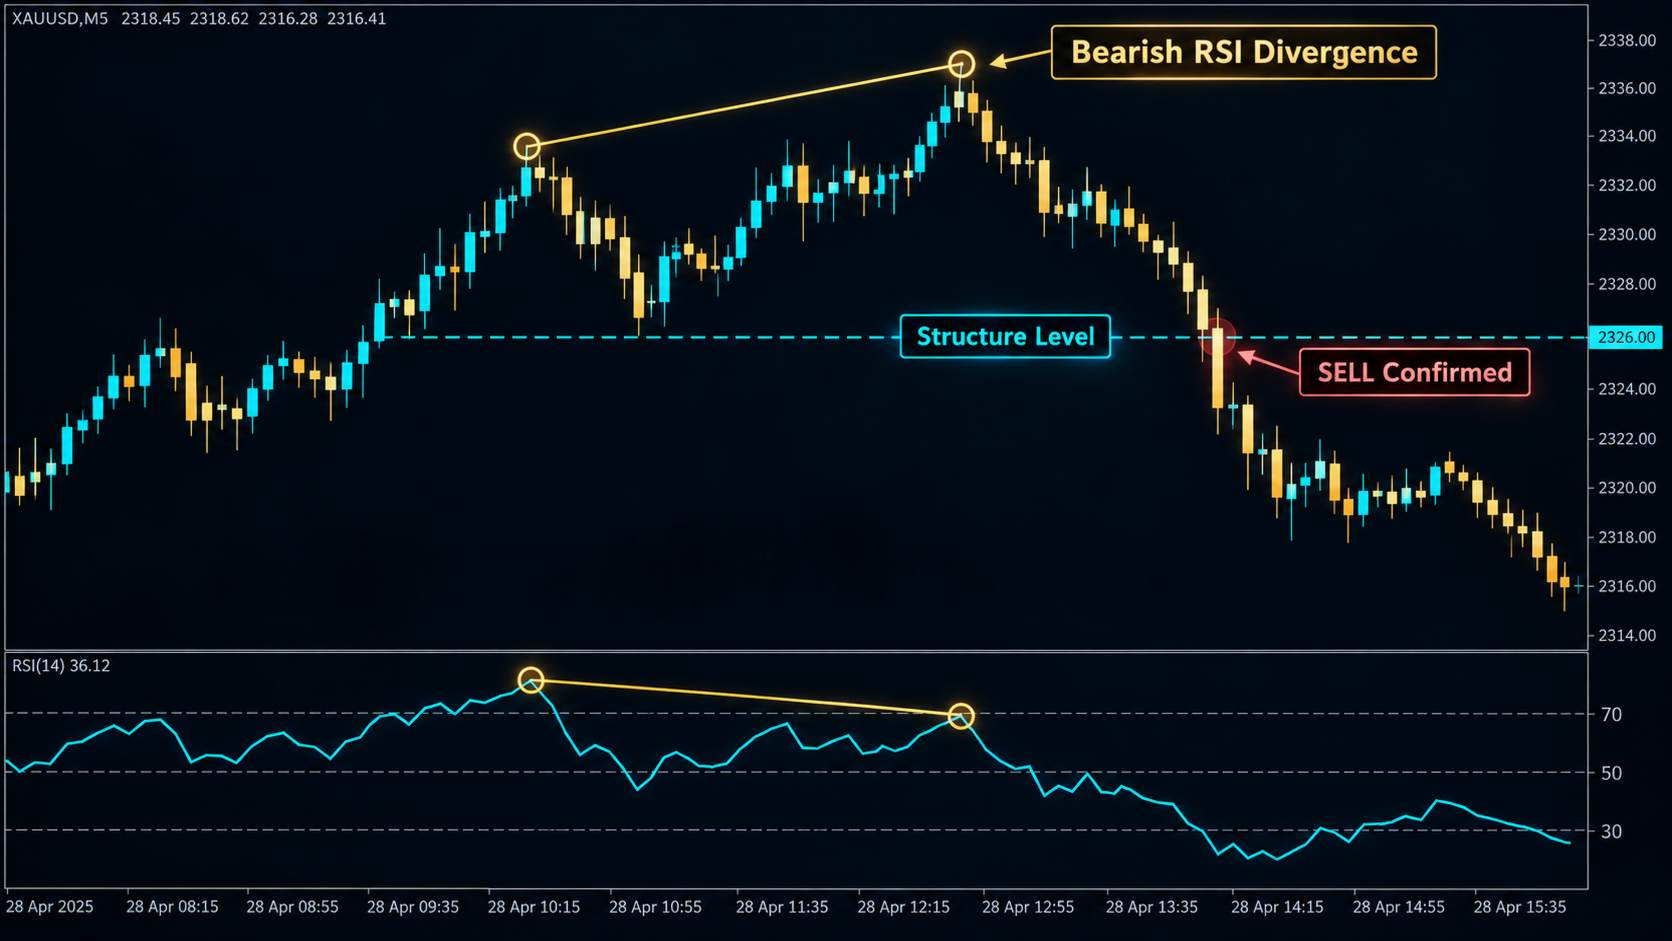
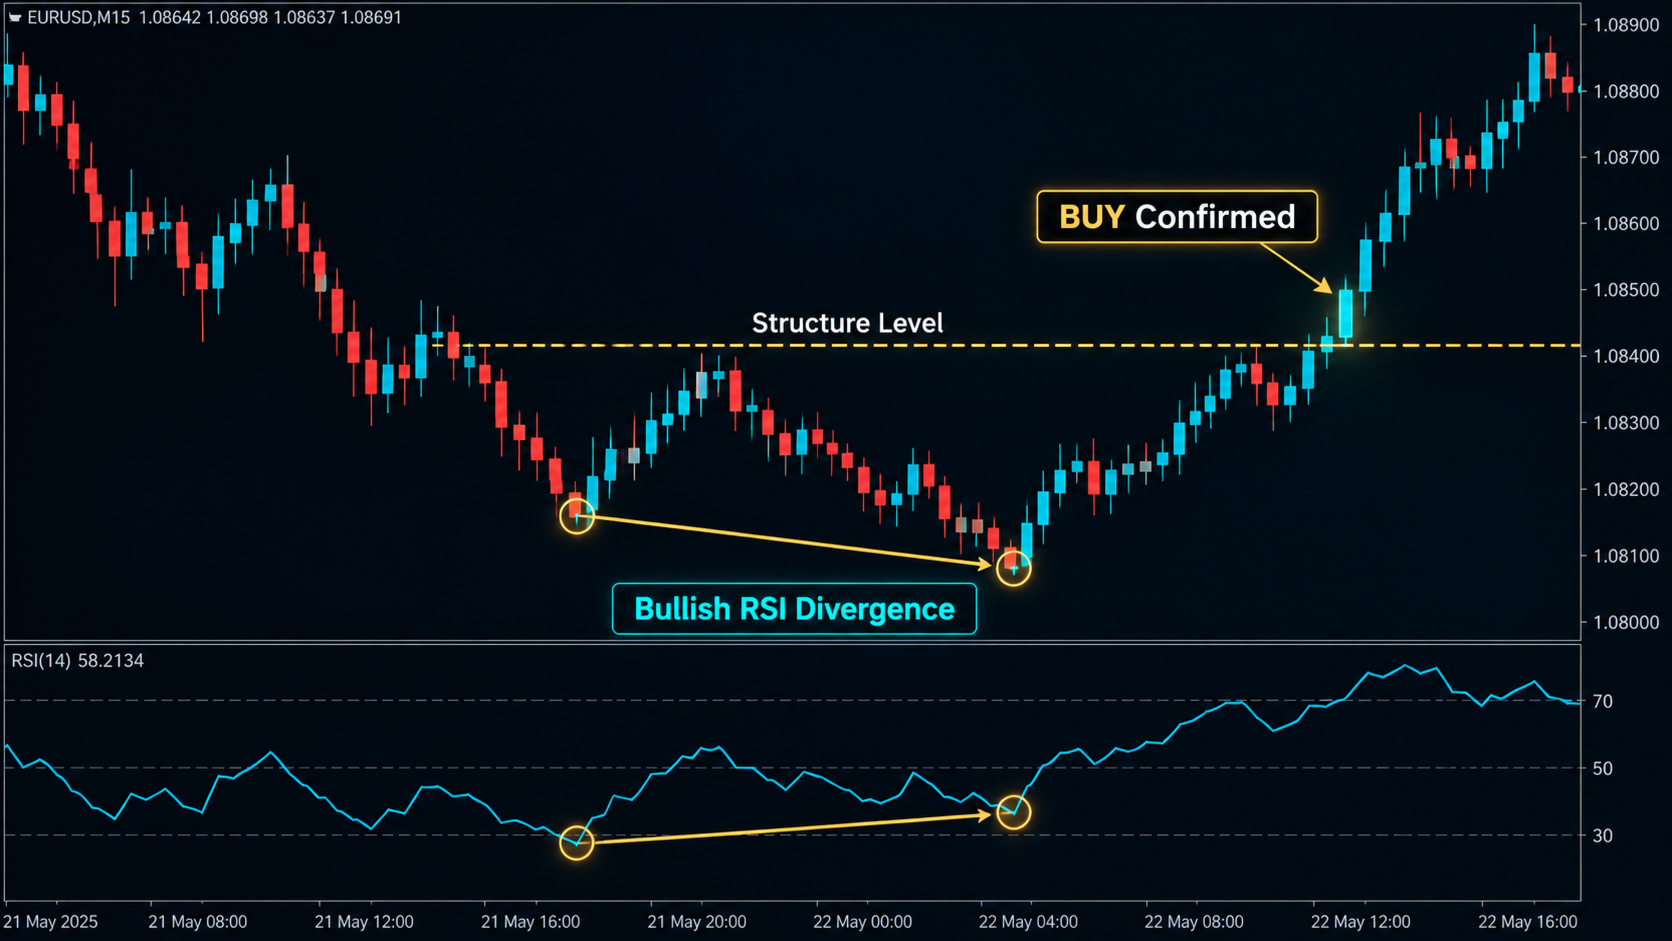
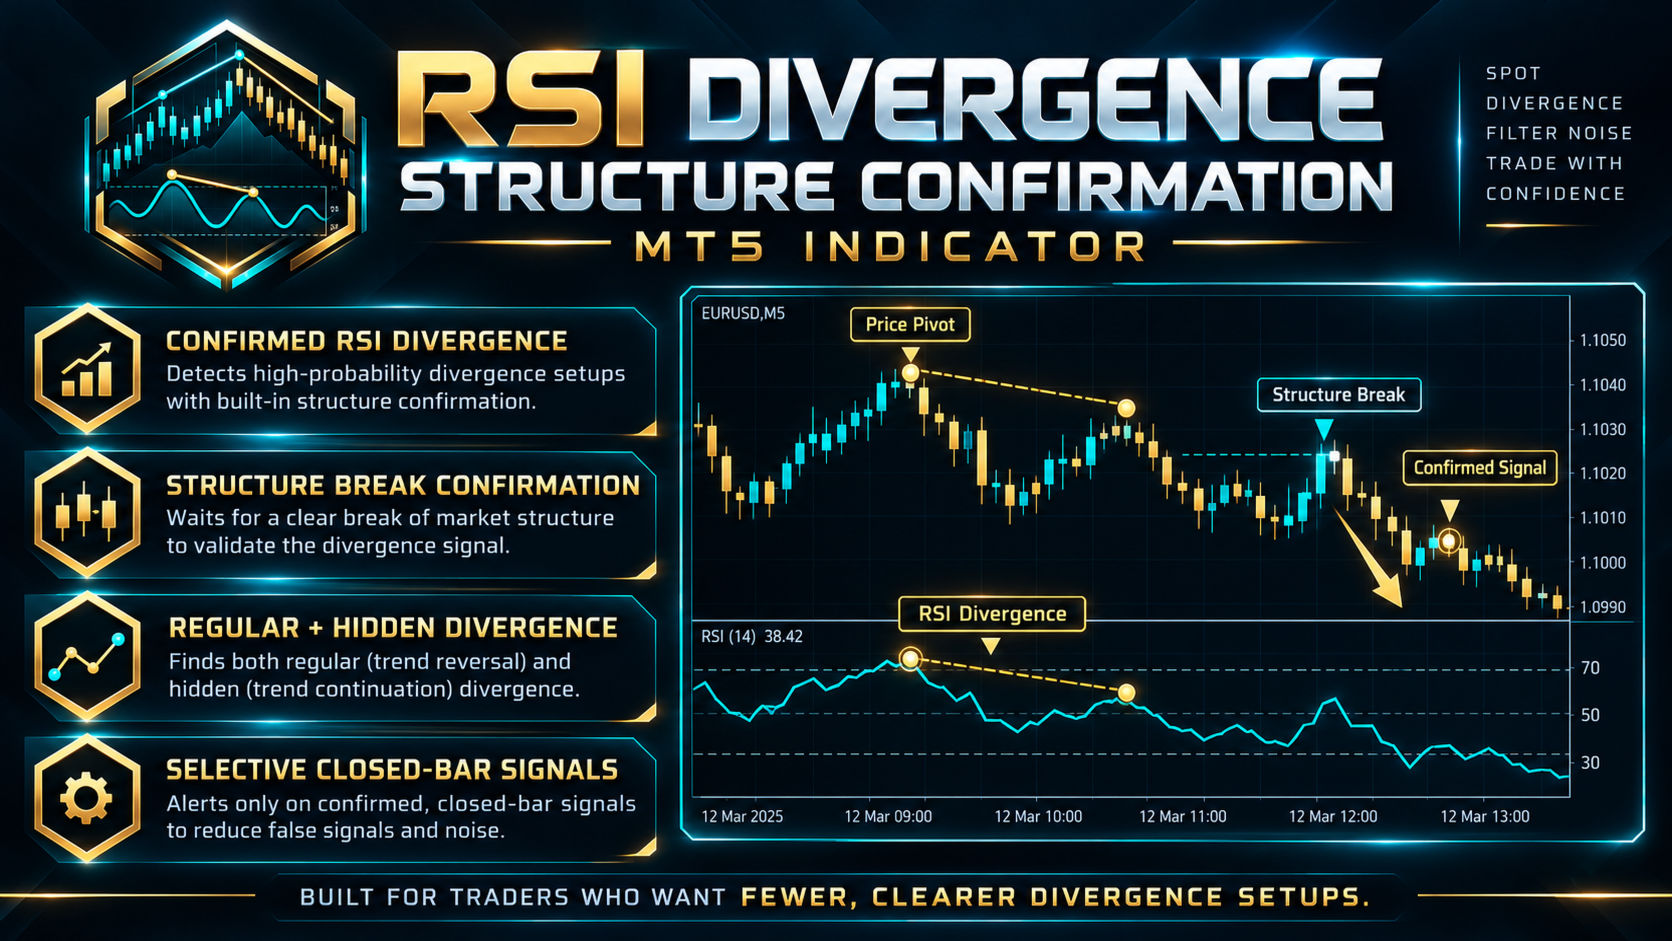
RSI Divergence Structure Confirmation is a MetaTrader 5 indicator that combines RSI divergence analysis with confirmed price pivots and a subsequent market-structure break. It is designed for traders who want to distinguish an early divergence observation from a later, price-confirmed signal.
How the Analysis Works
First, the indicator identifies confirmed price swing highs and lows and compares the RSI values at eligible pairs of pivots. The detection process supports regular bullish and bearish divergence, along with optional hidden bullish and bearish divergence.
A pivot is only considered confirmed after the required number of subsequent candles has closed. The indicator then applies configurable RSI, price-distance and ATR filters. For hidden divergence, an optional EMA trend filter can use a separately selected timeframe.
When a divergence passes the filters, the indicator records a nearby structure level using information available at that time. It then waits for a later completed candle to close beyond the stored level, subject to a configurable breakout margin and candle-body requirement.
The signal arrow is placed on the confirming candle, not retrospectively on the earlier pivot.
Main Features
-
Regular bullish and bearish RSI divergence detection.
-
Optional hidden bullish and bearish divergence detection.
-
Confirmed pivot matching with adjustable pivot distance and comparison depth.
-
Configurable RSI difference, RSI extreme and ATR-based price filters.
-
Price-structure confirmation using a locked level and closed candles.
-
Separate bullish and bearish setup tracking, with expiry, invalidation and same-direction cooldown.
-
Optional higher-timeframe EMA context for hidden divergence.
-
On-chart status panel with separate BUY and SELL diagnostics, including pivot, candidate, armed, signal and rejection counts.
-
Optional popup and mobile push alerts for newly confirmed closed-bar events.
-
Eight indicator buffers for chart signals and integration with custom tools or Expert Advisors.
Settings and First Use
Attach the indicator to a MetaTrader 5 chart and begin with the default Reversal Only mode. The default RSI period is 14, with four older bars and three later bars used for pivot confirmation.
Use Mode to select regular divergence, hidden divergence or both. Adjust the minimum RSI difference, pivot distance and ATR thresholds to control how selective the detection becomes.
Structure Lookback, Max Confirm Bars and the breakout settings control how setups are confirmed or allowed to expire.
For hidden divergence, the optional context EMA can be evaluated using completed candles from a selected timeframe.
Alerts are disabled by default; configure terminal notifications before enabling mobile push alerts.
Understanding the Chart
Green and red arrows represent confirmed regular bullish and bearish events. Blue and orange arrows represent confirmed hidden bullish and bearish events.
The panel shows whether the latest evaluated setup is waiting, confirmed, rejected, invalidated or expired, together with separate directional counts and notes.
The RSI calculation is internal to this indicator. This version does not add a separate RSI oscillator subwindow or draw connector lines between divergence pivots.
Important Information
This indicator is an analytical tool, not an automated trading system. It does not open or manage positions.
Divergence and structure breaks can fail, and some symbols or settings may produce long periods without signals.
Historical output may change when price history is revised, indicator inputs are changed or the evaluation window shifts.
The indicator does not establish a win rate or guaranteed trading advantage. Assess its behavior, including trading costs and execution conditions, before incorporating it into a trading strategy.