Lumin Chart
- Göstergeler
- Sürüm: 2.0
- Etkinleştirmeler: 5

LUMIN Chart reads the market structure for you and draws the zones that matter. It finds support, resistance and Order Blocks, scores each one from 0 to 12 and rates it WEAK, MEDIUM or STRONG, so you can see at a glance which levels deserve your attention.
This is an indicator only. It does not open, close or modify trades, and it does not need Algo Trading enabled.
Key features
Scored zones (0–12). Every zone is rated on:
impulse leaving the zone
rejection wick
respected bounces (exhausted zones lose points)
confluence with stacked zones
round levels
Order Block origin
alignment with the higher timeframe bias
discount/premium position
Hover over a zone to read its full score breakdown.
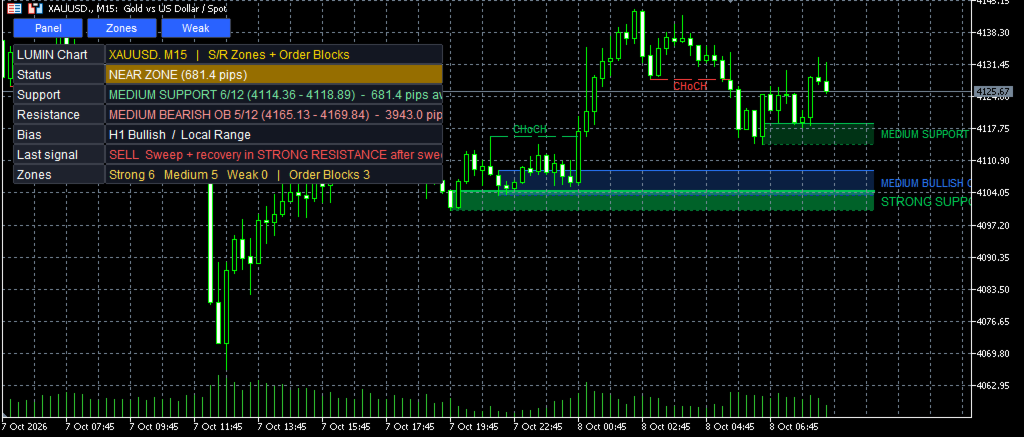
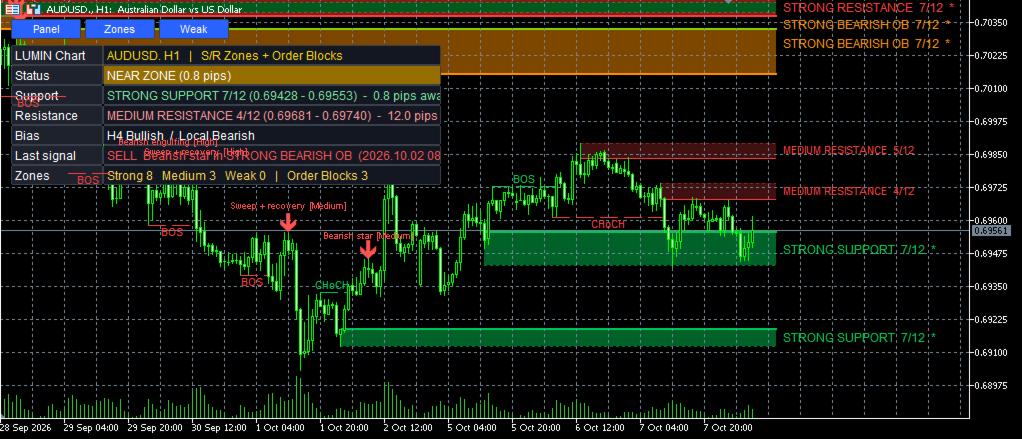
Clear zone marking. Each zone has a fill, a thick entry edge, a soft far edge and a label on the right (for example "STRONG SUPPORT 9/12"). Stronger zones are drawn more intensely. The zone where price currently sits is highlighted, and retests of broken zones are flagged.
Order Blocks. Detected after a BOS or CHoCH, with a configurable size and displacement filter.
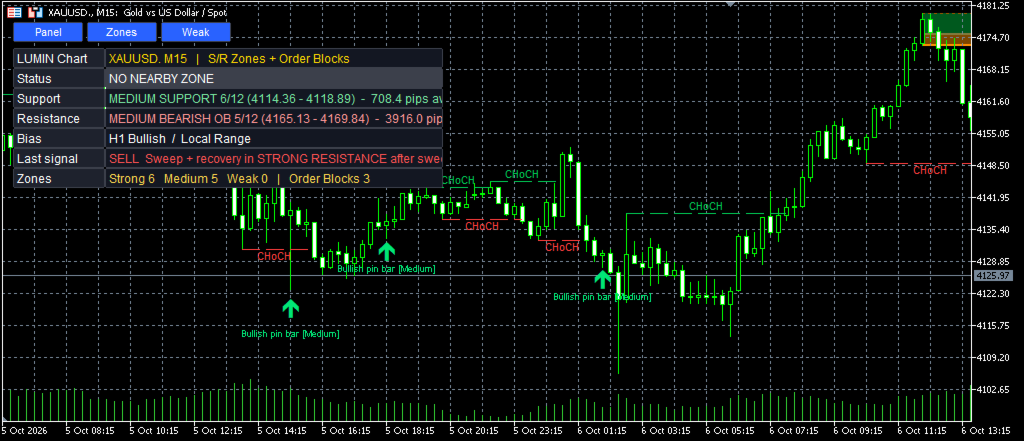
Candle-confirmation arrows. Bullish and bearish engulfing, pin bar, star, sweep and recovery, and retest candles are marked on qualifying zones, with a short text and a quality filter (Low, Medium, High). Arrows are calculated on closed candles and do not move or disappear once printed.
Market structure. BOS and CHoCH marks, plus an automatic higher timeframe bias (M15→H1, H1→H4 and so on, or choose your own).
Alerts. On zone touch (minimum zone rating configurable, optional early warning in pips) and on new candle signals. Popup, mobile push and sound, with a cooldown to avoid spam.
Panel and buttons. The panel shows the status, nearest support and resistance with distance in pips, the bias, the last signal and the zone count. Three buttons toggle the panel, the zones and the weak zones.
For developers. Two buffers (Buy arrow and Sell arrow) are available through iCustom.
How to use
Attach the indicator to any chart.
Look at the strong zones first and wait for price to reach them.
Use the arrows and alerts as a prompt to review the chart. Combine them with your own analysis and risk management.
Settings
Grouped and fully configurable:
Structure and higher timeframe
Zone detection and score thresholds
Zone colors and intensity
Order Blocks
Candle signals
Alerts
Panel position and size
Requirements and notes
MetaTrader 5, any symbol, any timeframe.
Use one copy per chart.
For push notifications, enter your MetaQuotes ID in the terminal (Tools → Options → Notifications).
On gold and indices, adjust "Points per pip" so the pip-based settings match the instrument.
Zones are dynamic. They are updated, flipped or removed as price breaks them.