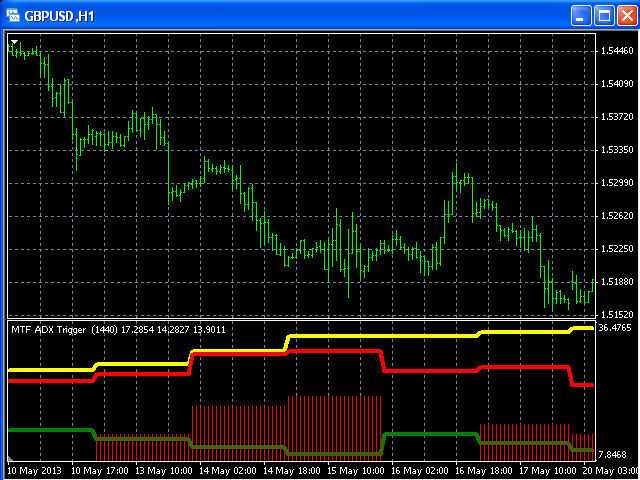
MTF ADX with Histogram
- Göstergeler
- Leonid Basis
- Sürüm: 4.8
- Güncellendi: 24 Nisan 2020
- Etkinleştirmeler: 5
Multi TimeFrame indicator MTF ADX with Histogram shows ADX indicator data from the TF by your choice.
You may choose a TimeFrame equal or greater than current TF.
- Yellow line is representing a price trend from the upper TF.
- Green line is representing +DI from the upper TF.
- Red line is representing -DI from the upper TF.
- Green histogram is displaying an Up-trend.
- Red histogram is displaying a Down-trend.