Is 3 SMA Spread
- Göstergeler
- Oleksandr Medviediev
- Sürüm: 1.4
- Güncellendi: 16 Aralık 2021
- Etkinleştirmeler: 20
3-SMA-Spread - Genişliğini her bir enstrümandan gelen girdiyle orantılı olarak değiştiren görsel iChannel (aşağıdaki formüle bakınız) oluşturarak 3 (üç) farklı enstrümanın piyasa yayılımı (SMA'ya dayalı "İstatistiksel Arbitraj") .
Temel prensip: Her tutarsızlıktan sonra "kendi" sembollerinin fiyatlarını takip eden fiyat satırları, sürekli olarak "sentetik" merkezin toplamına dönme eğilimindedir. Başka bir deyişle, 3 "ilişkili" enstrüman//çiftten oluşan bir sistem sürekli olarak ortalamalarına dönmeye çalışır ("ortalama geri dönüş" etkisi denir).
Herhangi bir Enstrüman/TF üzerinde çalışır (kullanılan tüm enstrümanlar için Charts/TF açılmalıdır)
Senkronizasyon mevcut. Mevcut çubuk kapatıldıktan sonra - Yeniden boyama yok / Yeniden çizme yok
Tüm değişkenler için "SetIndexBuffer" mevcuttur (EA'da kullanılabilir)
4 ve 5 haneli fiyatları otomatik olarak algıla
iChannel'ı oluşturmak için aşağıdaki formüller kullanılmıştır:
Fiyat Çizgisi Sembolü-1 - Göstergenin açık olduğu grafik
Fiyat Çizgisi Sembolü-2 - artı negatif korelasyona sahip enstrümanlar için "geri alma=doğru" Modu
Fiyat Çizgisi Sembolü-3 - Negatif korelasyona sahip enstrümanlar için рplus "reversal=true" Modu
Orta çizgi М = "sentetik" merkezi (S1 + S2 + S3)/3 (sarı noktalı çizgi)
iChannel = (S1-M) + (S2-M) + (S3-M) (kırmızı ve yeşil noktalar)
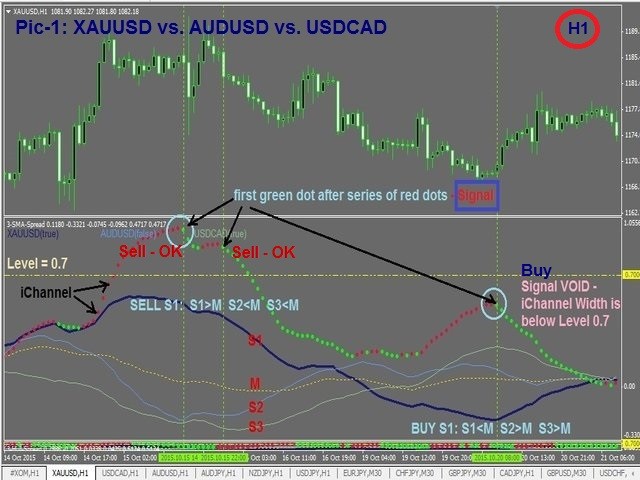
Bu formül, çeşitli enstrümanların tek bir grafikte birleştirilmesini sağlar (bkz. Şekil 1), örneğin:
XAUUSD ~1100
Avustralya Doları ~0,7
USDCAD ~1,33
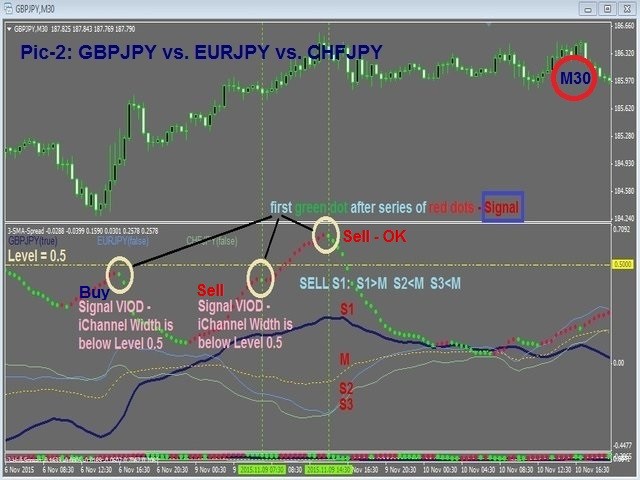
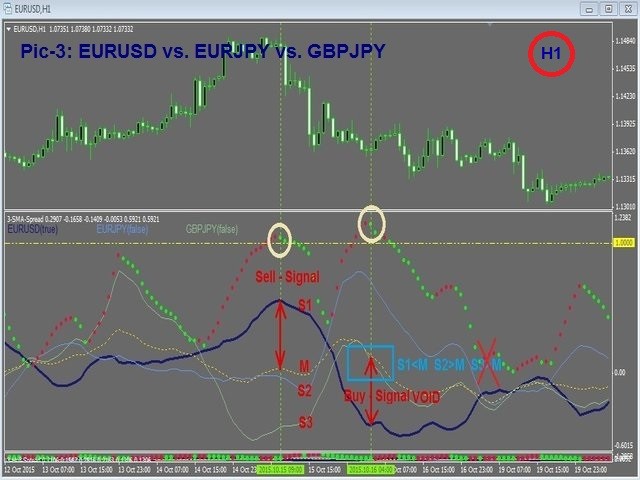
Sinyal Koşulları:
#1. iChannel'ın genişliği daralmaya başladı (bir dizi kırmızı noktadan sonra ilk yeşil nokta)
#2. iChannel Genişliği > Seviye
#3. Fiyat Çizgisi S1, Orta Çizgi М'nin bir tarafındadır ve Fiyat Çizgileri S2 ve S3, Orta Çizgi М'nin karşı tarafındadır - aşağıdaki gibi:
Sinyal SATIN AL Sembol-1: S1<M S2>M S3>M -- NOT: iChannel genişliği (kırmızı ve yeşil noktalar) genişliyor veya daralıyor
Sinyal SAT Sembol-1: S1>M S2<M S3<M -- NOT: iChannel genişliği (kırmızı ve yeşil noktalar) genişliyor veya daralıyor
Parametreler:
Inp_Fast_MA - Hızlı hareketli ortalamanın periyodu
Inp_Slow_MA - Yavaş hareketli ortalama dönemi
Inp_MA_Method - SMA'nın parametresi
Inp_MA_PriceType - SMA parametresi
Inp_Symbol_1 - Sembol-1 (varsayılan olarak GBPJPY)
Inp_Symbol_2 - Sembol-2 (varsayılan olarak EURJPY)
Inp_S2_revers - =Sembol-2'nin Sembol-1 ile negatif korelasyonu olması durumunda doğru
Inp_Symbol_3 - Sembol-3 (varsayılan olarak CHFJPY)
Inp_S3_revers - =Sembol-3'ün Sembol-1 ile negatif korelasyonu olması durumunda doğru
Diğer faydalı bilgiler:
Yüksek korelasyonlu 3 yollu enstrümanların tipik ÖRNEKLERİ:
GOLD ve altın oluşturan döviz çiftleri AUDUSD, USDCAD ve NZDUSD
ALTIN ve Ham/WTI ve Brent/BRN
Hisse Senetleri ve Endeksler (S&P500, NASDAQ, DJIA vb.)
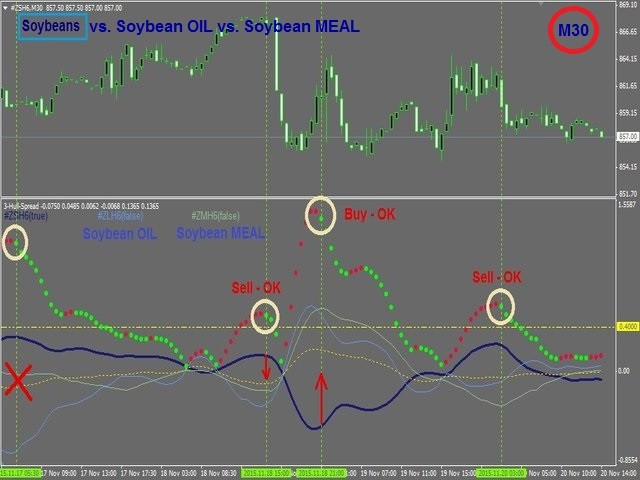
Soya Fasulyesi Mart 2016 (ZMH16) vs Soya Fasulyesi Yağı Mart 2016 (ZLH16) vs Soya Fasulyesi Mart 2016 (ZSH16), vb.
Döviz çiftlerinin 120 klasik 3 yollu kombinasyonunun tam listesi - Yorumlar bölümündeki bağlantıya bakın.
NOT: klasik 3 yollu kombinasyonlar için (yalnızca 3 para biriminin katıldığı durumlarda), Orta Çizgi М her zaman düz bir çizgi olacaktır.